| source | dataset | .html | .RData |
|---|---|---|---|
| 2024-09-11 | 2024-04-15 |
Quarterly Sector Accounts - Public Sector Debt, consolidated, nominal value
Data - OECD
Info
Data on public debt
| source | dataset | .html | .RData |
|---|---|---|---|
| 2024-09-14 | 2024-09-14 | ||
| 2024-09-14 | 2024-09-14 | ||
| 2024-09-14 | 2024-09-14 | ||
| 2024-09-14 | 2024-09-14 | ||
| 2021-08-22 | 2021-03-01 | ||
| 2024-06-20 | 2020-03-13 | ||
| 2024-09-09 | 2024-09-09 | ||
| 2024-09-09 | 2024-09-09 | ||
| 2024-06-20 | 2024-05-06 | ||
| 2024-06-20 | NA | ||
| 2024-09-11 | 2024-04-15 | ||
| 2023-06-18 | 2024-09-15 | ||
| 2023-06-18 | 2024-09-15 | ||
| 2023-06-18 | 2024-09-15 | ||
| 2024-09-15 | 2024-09-15 |
LAST_COMPILE
| LAST_COMPILE |
|---|
| 2024-09-15 |
Last
| obsTime | Nobs |
|---|---|
| 2023-Q4 | 914 |
Layout
- OECD Website. html
LOCATION
Code
QASA_TABLE7PSD %>%
  left_join(QASA_TABLE7PSD_var$LOCATION, by = "LOCATION") %>%
  group_by(LOCATION, Location) %>%
  summarise(Nobs = n()) %>%
  arrange(-Nobs) %>%
  mutate(Flag = gsub(" ", "-", str_to_lower(gsub(" ", "-", Location))),
         Flag = paste0('<img src="../../icon/flag/vsmall/', Flag, '.png" alt="Flag">')) %>%
  select(Flag, everything()) %>%
  {if (is_html_output()) datatable(., filter = 'top', rownames = F, escape = F) else .}
TRANSACTION
Code
QASA_TABLE7PSD %>%
  left_join(QASA_TABLE7PSD_var$TRANSACTION, by = "TRANSACTION") %>%
  group_by(TRANSACTION, Transaction) %>%
  summarise(Nobs = n()) %>%
  arrange(-Nobs) %>%
  print_table_conditional()
SECTOR
Code
QASA_TABLE7PSD %>%
  left_join(QASA_TABLE7PSD_var$SECTOR, by = "SECTOR") %>%
  group_by(SECTOR, Sector) %>%
  summarise(Nobs = n()) %>%
  arrange(-Nobs) %>%
print_table_conditional()| SECTOR | Sector | Nobs |
|---|---|---|
| S1311C | Central government | 255493 |
| S13G | General government | 228974 |
| S1311BC | Budgetary central government | 77612 |
| S101 | Total public sector | 40527 |
| S1101 | Non-financial public corporations | 39476 |
| S1201 | Financial public corporations | 34767 |
| S001 | Total economy | 5159 |
MEASURE
Code
QASA_TABLE7PSD %>%
  left_join(QASA_TABLE7PSD_var$MEASURE, by = "MEASURE") %>%
  group_by(MEASURE, Measure) %>%
  summarise(Nobs = n()) %>%
  arrange(-Nobs) %>%
print_table_conditional()| MEASURE | Measure | Nobs |
|---|---|---|
| CAR | Current prices, annual levels | 244692 |
| CXCAR | US $, current prices, current exchange rates, annual levels | 226551 |
| PCTGDPA | Percentage of GDP, current prices (Nat. Curr.) | 210765 |
Biggest Debt in $
PCTGDPA - Percentage of GDP, current prices (Nat. Curr.)
Code
QASA_TABLE7PSD %>%
  filter(TRANSACTION == "SAFGD",
         MEASURE == "PCTGDPA") %>%
  left_join(QASA_TABLE7PSD_var$LOCATION, by = "LOCATION") %>%
  group_by(LOCATION, Location) %>%
  summarise(year1 = first(obsTime),
            value1 = first(obsValue),
            year2 = last(obsTime),
            value2 = last(obsValue)) %>%
  arrange(-value2) %>%
  mutate_at(vars(value1, value2), funs(paste0(round(.), " %"))) %>%
  mutate(Flag = gsub(" ", "-", str_to_lower(gsub(" ", "-", Location))),
         Flag = paste0('<img src="../../icon/flag/vsmall/', Flag, '.png" alt="Flag">')) %>%
  select(Flag, everything()) %>%
  {if (is_html_output()) datatable(., filter = 'top', rownames = F, escape = F) else .}
CAR - Current prices, annual levels
Code
QASA_TABLE7PSD %>%
  filter(TRANSACTION == "SAFGD",
         MEASURE == "CAR") %>%
  left_join(QASA_TABLE7PSD_var$LOCATION, by = "LOCATION") %>%
  group_by(LOCATION, Location) %>%
  summarise(year1 = first(obsTime),
            value1 = first(obsValue),
            year2 = last(obsTime),
            value2 = last(obsValue)) %>%
  arrange(-value2) %>%
  mutate_at(vars(value1, value2), funs(paste0(round(./1000), ""))) %>%
  mutate(Flag = gsub(" ", "-", str_to_lower(gsub(" ", "-", Location))),
         Flag = paste0('<img src="../../icon/flag/vsmall/', Flag, '.png" alt="Flag">')) %>%
  select(Flag, everything()) %>%
  {if (is_html_output()) datatable(., filter = 'top', rownames = F, escape = F) else .}
CXCAR - US $, current prices, current exchange rates, annual levels
Code
QASA_TABLE7PSD %>%
  filter(TRANSACTION == "SAFGD",
         MEASURE == "CXCAR") %>%
  left_join(QASA_TABLE7PSD_var$LOCATION, by = "LOCATION") %>%
  group_by(LOCATION, Location) %>%
  summarise(year1 = first(obsTime),
            value1 = first(obsValue),
            year2 = last(obsTime),
            value2 = last(obsValue)) %>%
  arrange(-value2) %>%
  mutate_at(vars(value1, value2), funs(paste0("$ ", round(./1000), " Bn"))) %>%
  mutate(Flag = gsub(" ", "-", str_to_lower(gsub(" ", "-", Location))),
         Flag = paste0('<img src="../../icon/flag/vsmall/', Flag, '.png" alt="Flag">')) %>%
  select(Flag, everything()) %>%
  {if (is_html_output()) datatable(., filter = 'top', rownames = F, escape = F) else .}
France, United States
All
Code
QASA_TABLE7PSD %>%
  filter(LOCATION %in% c("FRA", "USA"),
         TRANSACTION == "SAFGD",
         MEASURE == "CXCAR",
         SECTOR == "S13G") %>%
  quarter_to_date %>%
  arrange(desc(date)) %>%
  mutate(obsValue = obsValue/10^3) %>%
  group_by(date) %>%
  filter(n() == 2) %>%
  left_join(QASA_TABLE7PSD_var$LOCATION, by = "LOCATION") %>%
  group_by(LOCATION) %>%
  left_join(colors, by = c("Location" = "country")) %>%
  ggplot(.) + geom_line(aes(x = date, y = obsValue, color = color)) +
  scale_color_identity() + add_2flags +
  theme_minimal() + xlab("") + ylab("") +
  scale_x_date(breaks = seq(1940, 2030, 2) %>% paste0("-01-01") %>% as.Date,
               labels = date_format("%Y")) +
  scale_y_continuous(breaks = seq(0, 40000, 2000))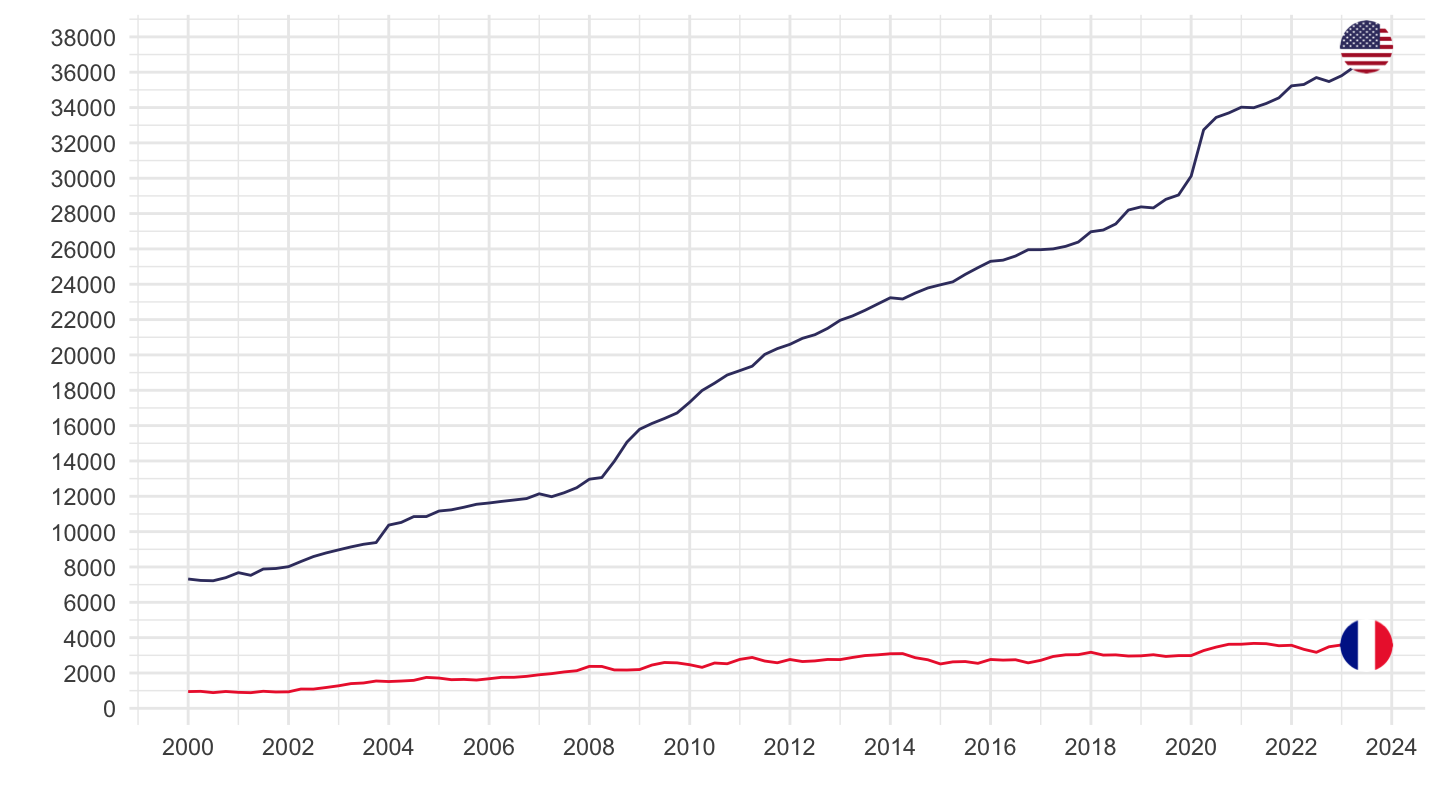
Log
Code
QASA_TABLE7PSD %>%
  filter(LOCATION %in% c("FRA", "USA"),
         TRANSACTION == "SAFGD",
         MEASURE == "CXCAR",
         SECTOR == "S13G") %>%
  quarter_to_date %>%
  arrange(desc(date)) %>%
  mutate(obsValue = obsValue/10^3) %>%
  group_by(date) %>%
  filter(n() == 2) %>%
  left_join(QASA_TABLE7PSD_var$LOCATION, by = "LOCATION") %>%
  group_by(LOCATION) %>%
  left_join(colors, by = c("Location" = "country")) %>%
  ggplot(.) + geom_line(aes(x = date, y = obsValue, color = color)) +
  scale_color_identity() + add_2flags +
  theme_minimal() + xlab("") + ylab("") +
  scale_x_date(breaks = seq(1940, 2030, 2) %>% paste0("-01-01") %>% as.Date,
               labels = date_format("%Y")) +
  scale_y_log10(breaks = seq(0, 40000, 2000))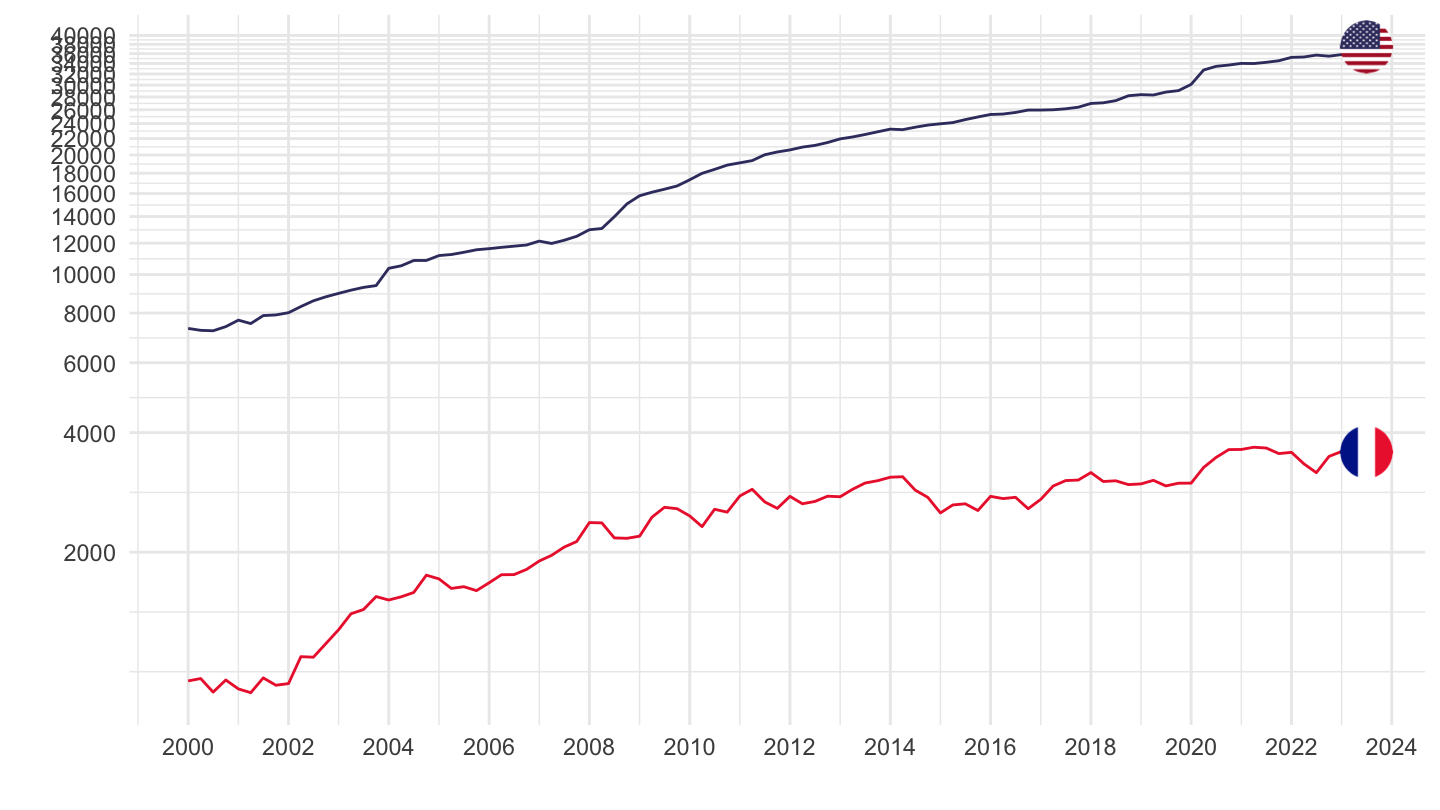
Japan, United States
Code
QASA_TABLE7PSD %>%
  filter(LOCATION %in% c("USA", "JPN"),
         TRANSACTION == "SAFGD",
         MEASURE == "CXCAR",
         SECTOR == "S13G") %>%
  quarter_to_date %>%
  arrange(desc(date)) %>%
  mutate(obsValue = obsValue/10^3) %>%
  left_join(QASA_TABLE7PSD_var$LOCATION, by = "LOCATION") %>%
  group_by(LOCATION) %>%
  left_join(colors, by = c("Location" = "country")) %>%
  ggplot(.) + geom_line(aes(x = date, y = obsValue, color = color)) +
  scale_color_identity() + add_2flags +
  theme_minimal() + xlab("") + ylab("") +
  scale_x_date(breaks = seq(1940, 2030, 5) %>% paste0("-01-01") %>% as.Date,
               labels = date_format("%Y")) +
  scale_y_continuous(breaks = seq(0, 40000, 2000))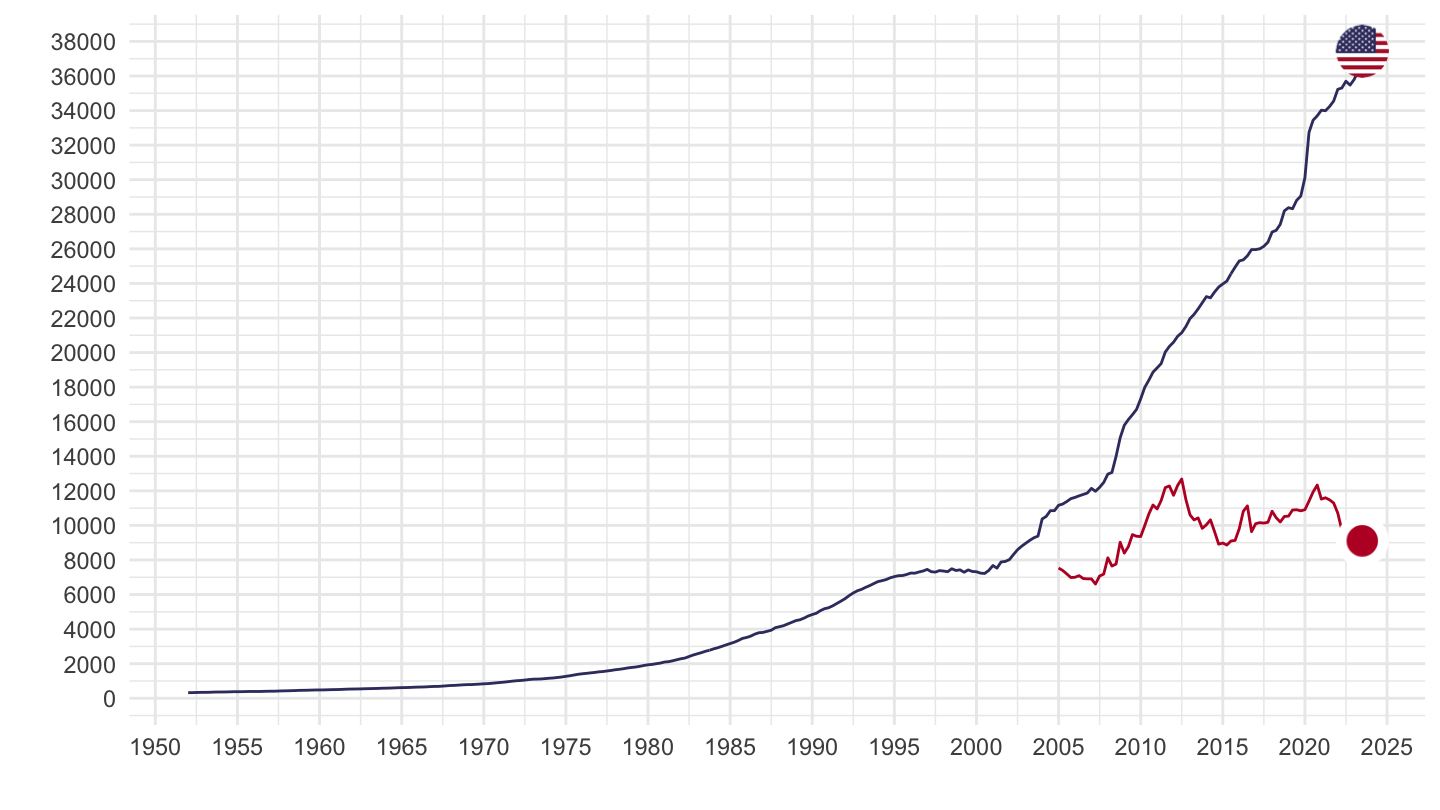
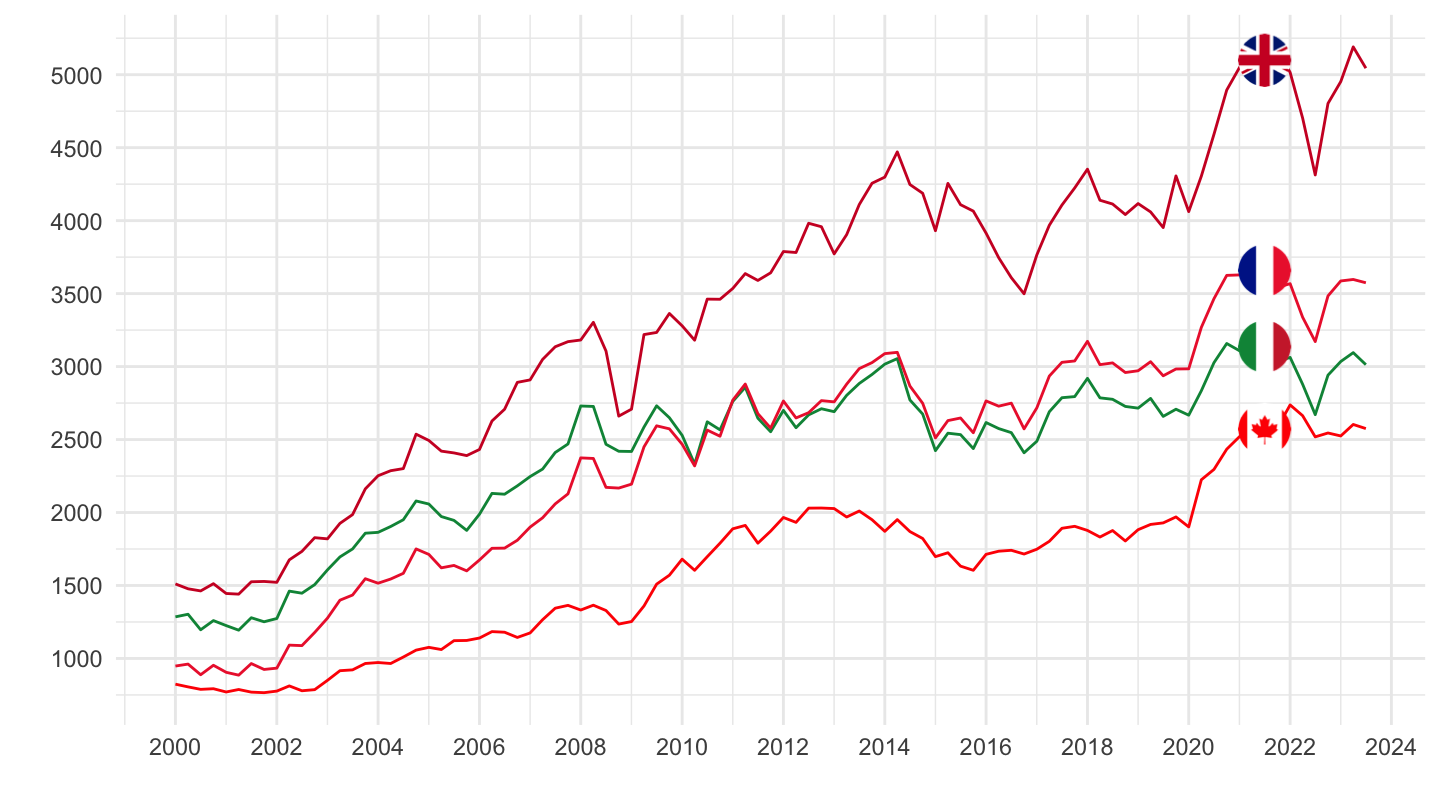
France, United Kingdom, Italy, Canada
Code
QASA_TABLE7PSD %>%
  filter(LOCATION %in% c("FRA", "GBR", "ITA", "CAN"),
         TRANSACTION == "SAFGD",
         MEASURE == "CXCAR",
         SECTOR == "S13G") %>%
  quarter_to_date %>%
  arrange(desc(date)) %>%
  mutate(obsValue = obsValue/10^3) %>%
  left_join(QASA_TABLE7PSD_var$LOCATION, by = "LOCATION") %>%
  group_by(LOCATION) %>%
  group_by(date) %>%
  filter(n() == 4) %>%
  left_join(colors, by = c("Location" = "country")) %>%
  ggplot(.) + geom_line(aes(x = date, y = obsValue, color = color)) +
  scale_color_identity() + add_4flags +
  theme_minimal() + xlab("") + ylab("") +
  scale_x_date(breaks = seq(1940, 2030, 2) %>% paste0("-01-01") %>% as.Date,
               labels = date_format("%Y")) +
  scale_y_continuous(breaks = seq(0, 40000, 500))