
Last observation: Q2 2026 (N = 21)
First observation: Q4 1995 (N = 21)
Last data update: 09 oct. 2026, 22:31
Last compile: 10 oct. 2026, 00:57
`DETTE-TRIM-APU-2020` |>
  filter(INDICATEUR %in% c("DETTE_MAASTRICHT", "DETTE_NETTE"),
         DETTE_MAASTRICHT_INTRUMENTS == "F",
         `SECT-INST` == "S13",
         NATURE == "VALEUR_ABSOLUE") |>
  quarter_to_date() |>
  arrange(desc(date)) |>
  ggplot() + theme_minimal() + ylab("Dette (Mds €)") + xlab("") +
  geom_line(aes(x = date, y = OBS_VALUE, color = Indicateur)) +
  theme(legend.title = element_blank(),
        legend.position = c(0.4, 0.9)) +
  scale_x_date(breaks = seq(1950, 2100, 2) |> paste0("-01-01") |> as.Date(),
               labels = date_format("%Y")) +
  scale_y_continuous(breaks = seq(0, 4000, 250),
                     labels = dollar_format(acc = 1, pre = "", su = " Mds€"))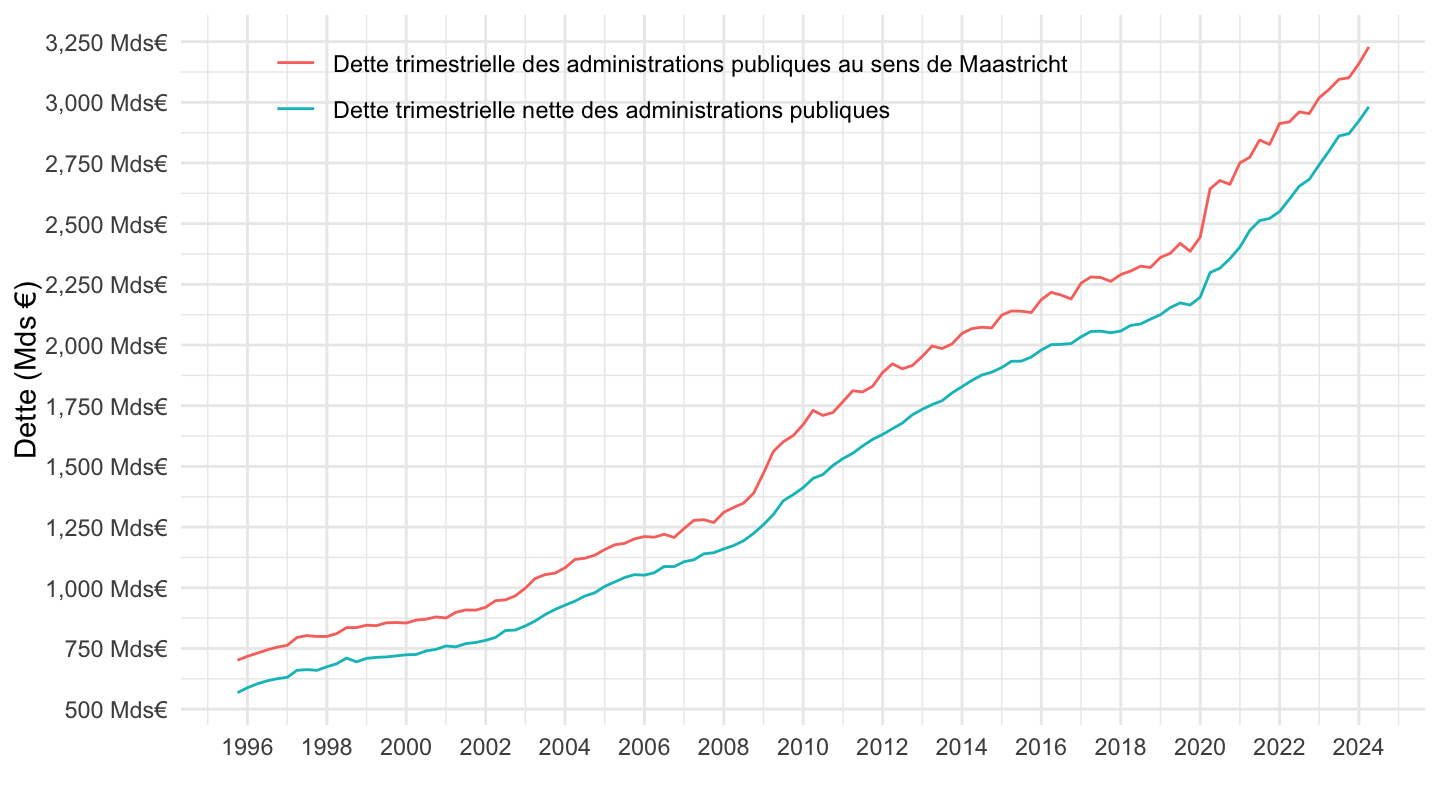
`DETTE-TRIM-APU-2020` |>
  filter(INDICATEUR %in% c("DETTE_MAASTRICHT", "DETTE_NETTE"),
         DETTE_MAASTRICHT_INTRUMENTS == "F",
         `SECT-INST` == "S13",
         NATURE == "VALEUR_ABSOLUE") |>
  quarter_to_date() |>
  arrange(desc(date)) |>
  ggplot() + theme_minimal() + ylab("Dette (Mds €)") + xlab("") +
  geom_line(aes(x = date, y = OBS_VALUE, color = Indicateur)) +
  theme(legend.title = element_blank(),
        legend.position = c(0.4, 0.9)) +
  scale_x_date(breaks = seq(1950, 2100, 2) |> paste0("-01-01") |> as.Date(),
               labels = date_format("%Y")) +
  scale_y_log10(breaks = seq(0, 4000, 250),
                     labels = dollar_format(acc = 1, pre = "", su = " Mds€"))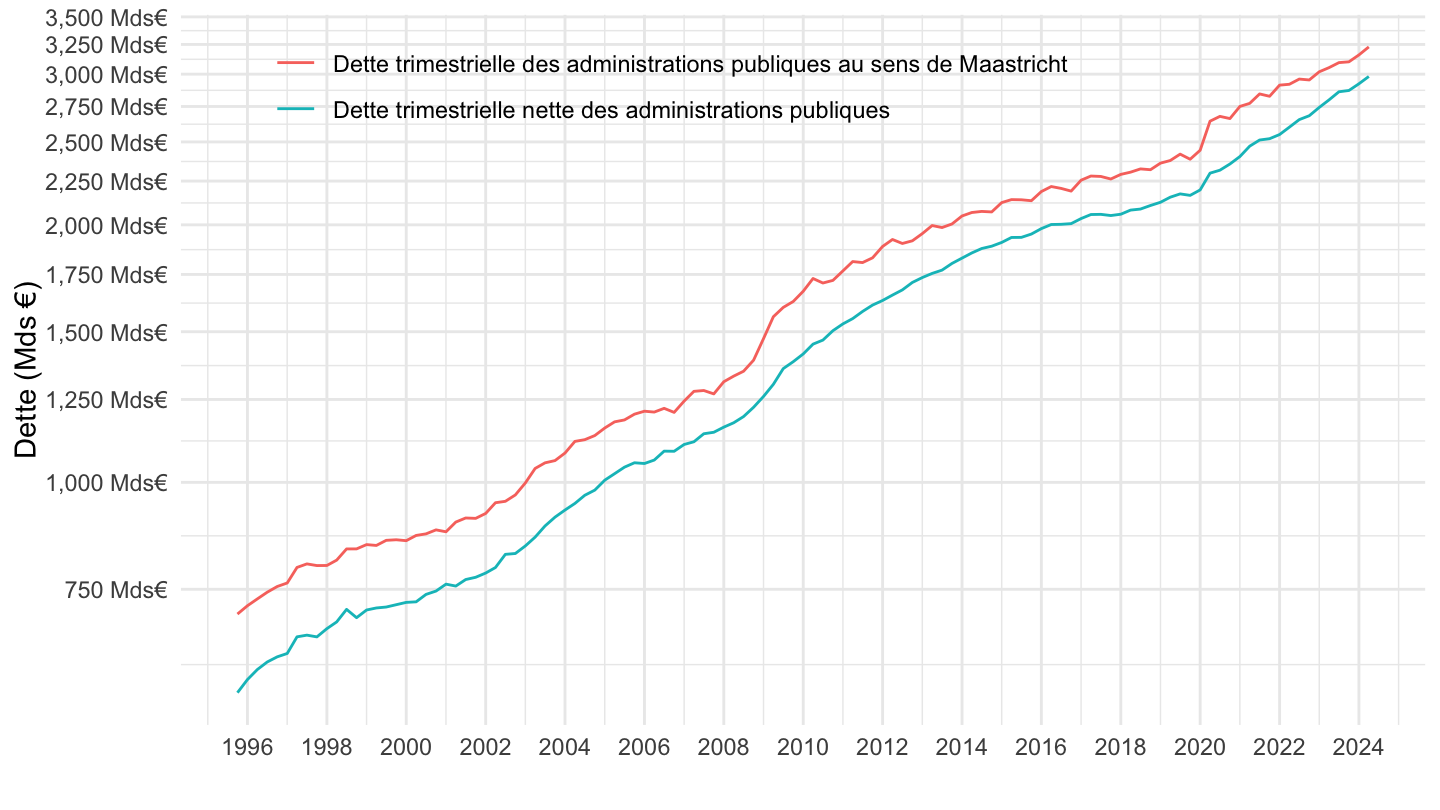
`DETTE-TRIM-APU-2020` |>
  filter(INDICATEUR %in% c("DETTE_MAASTRICHT", "DETTE_NETTE"),
         DETTE_MAASTRICHT_INTRUMENTS == "F",
         `SECT-INST` == "S13",
         NATURE == "VALEUR_ABSOLUE") |>
  quarter_to_date() |>
  filter(date >= as.Date("2020-01-01")) |>
  arrange(desc(date)) |>
  ggplot() + theme_minimal() + ylab("Dette (Mds €)") + xlab("") +
  geom_line(aes(x = date, y = OBS_VALUE, color = Indicateur)) +
  theme(legend.title = element_blank(),
        legend.position = c(0.4, 0.9)) +
  scale_x_date(breaks = seq(1950, 2100, 1) |> paste0("-01-01") |> as.Date(),
               labels = date_format("%Y")) +
  scale_y_log10(breaks = seq(0, 4000, 250),
                     labels = dollar_format(acc = 1, pre = "", su = " Mds€"))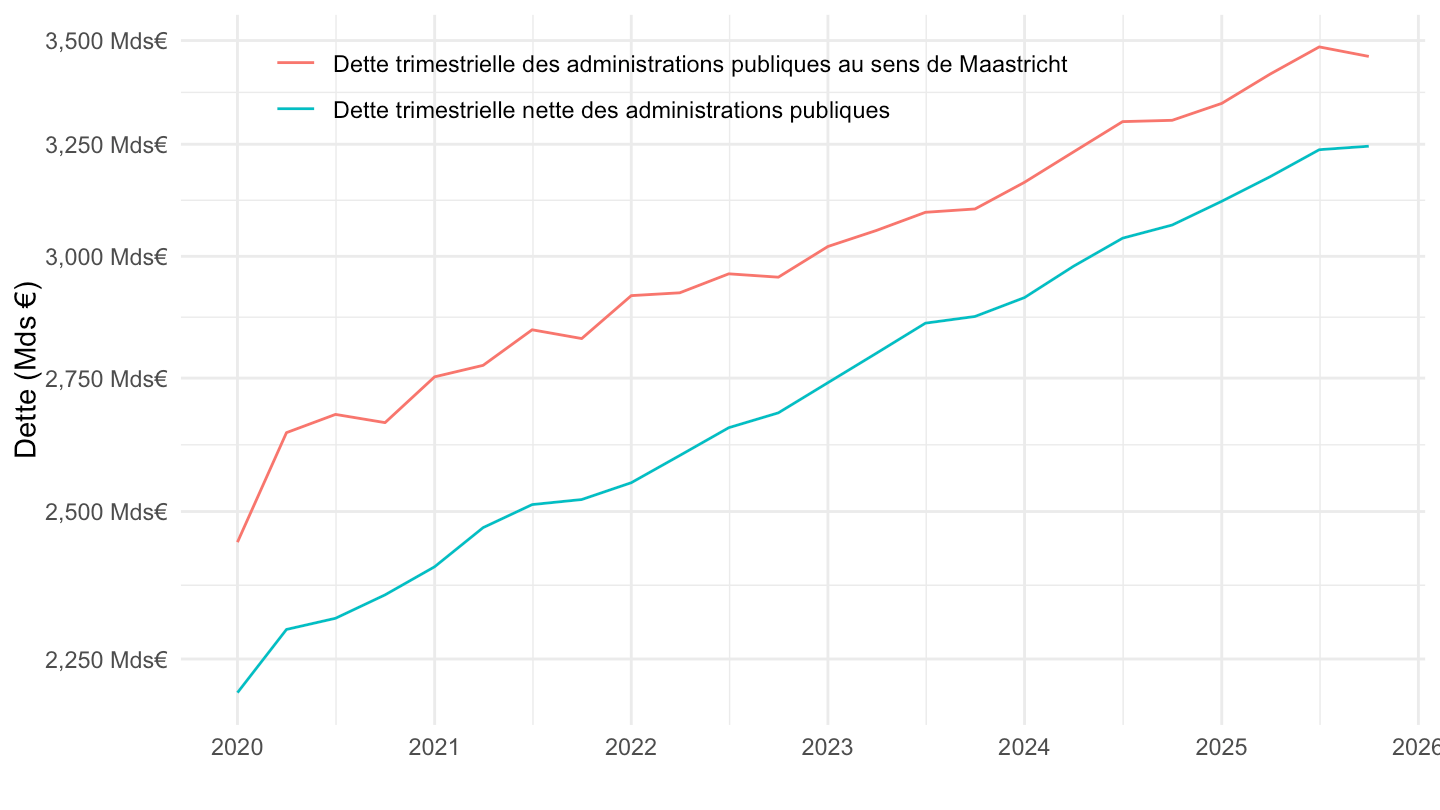
`DETTE-TRIM-APU-2020` |>
  filter(INDICATEUR %in% c("DETTE_MAASTRICHT", "DETTE_NETTE"),
         DETTE_MAASTRICHT_INTRUMENTS == "F",
         `SECT-INST` == "S13",
         NATURE == "VALEUR_ABSOLUE") |>
  quarter_to_date() |>
  filter(date >= as.Date("2015-01-01"),
         month(date) == 10) |>
  arrange(desc(date)) |>
  mutate(year = as.character(year(date))) |>
  left_join(gdp, by = "year") |>
  ggplot() + theme_minimal() + ylab("Dette publique (% du PIB)") + xlab("") +
  geom_line(aes(x = date, y = OBS_VALUE/gdp, color = Indicateur)) +
  theme(legend.title = element_blank(),
        legend.position = c(0.5, 0.8)) +
  scale_x_date(breaks = seq(1950, 2100, 1) |> paste0("-01-01") |> as.Date(),
               labels = date_format("%Y")) +
  scale_y_log10(labels = percent_format(acc = 1),
                breaks = seq(0, 2, 0.05)) +
  geom_label_repel(aes(x = date, y = OBS_VALUE/gdp, label = percent(OBS_VALUE/gdp, acc = 0.1), color = Indicateur), show.legend = F)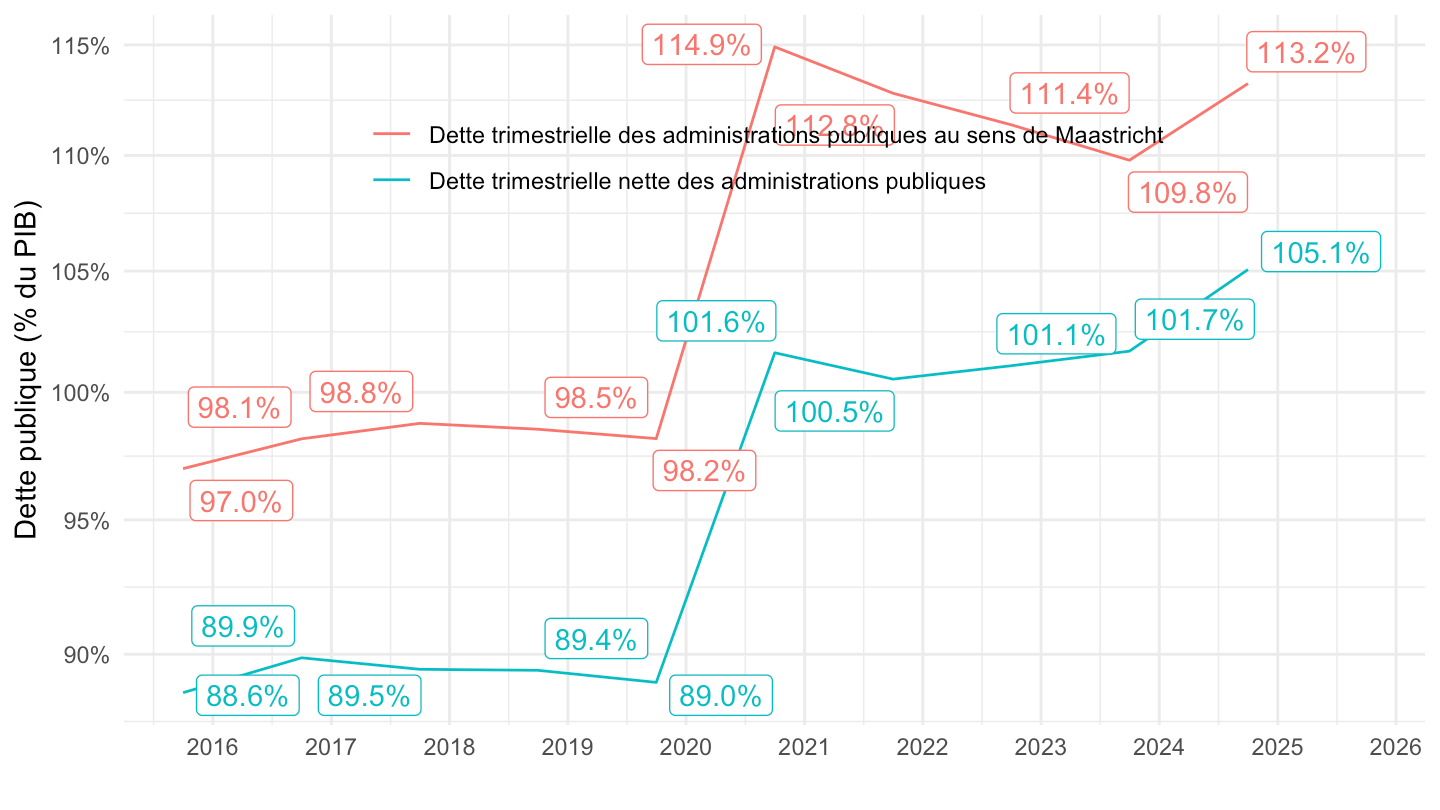
`DETTE-TRIM-APU-2020` |>
  filter(INDICATEUR %in% c("DETTE_MAASTRICHT", "DETTE_NETTE"),
         DETTE_MAASTRICHT_INTRUMENTS == "F",
         `SECT-INST` == "S13",
         NATURE == "VALEUR_ABSOLUE") |>
  quarter_to_date() |>
  filter(date >= as.Date("2018-01-01"),
         month(date) == 10) |>
  arrange(desc(date)) |>
  mutate(year = as.character(year(date))) |>
  left_join(gdp, by = "year") |>
  ggplot() + theme_minimal() + ylab("Dette publique (% du PIB)") + xlab("") +
  geom_line(aes(x = date, y = OBS_VALUE/gdp, color = Indicateur)) +
  theme(legend.title = element_blank(),
        legend.position = c(0.5, 0.5)) +
  scale_x_date(breaks = seq(1950, 2100, 1) |> paste0("-01-01") |> as.Date(),
               labels = date_format("%Y")) +
  scale_y_log10(labels = percent_format(acc = 1),
                breaks = seq(0, 2, 0.05)) +
  geom_label(aes(x = date, y = OBS_VALUE/gdp, label = percent(OBS_VALUE/gdp, acc = 0.1), color = Indicateur), show.legend = F)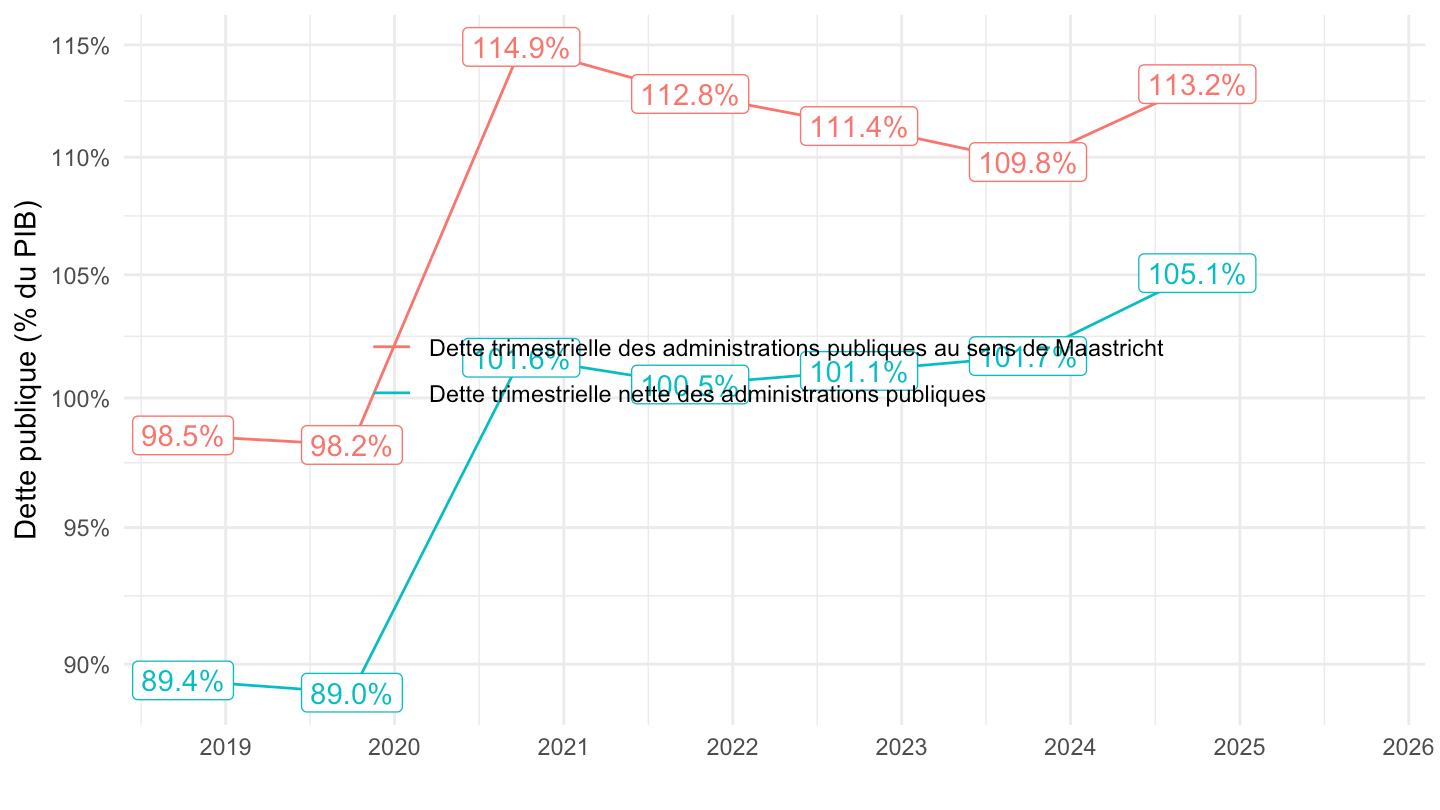
`DETTE-TRIM-APU-2020` |>
  filter(INDICATEUR %in% c("DETTE_MAASTRICHT", "DETTE_NETTE"),
         DETTE_MAASTRICHT_INTRUMENTS == "F",
         `SECT-INST` == "S13",
         NATURE == "VALEUR_ABSOLUE") |>
  quarter_to_date() |>
  filter(date >= as.Date("2020-01-01"),
         month(date) == 10) |>
  arrange(desc(date)) |>
  mutate(year = as.character(year(date))) |>
  left_join(gdp, by = "year") |>
  ggplot() + theme_minimal() + ylab("Dette (% du PIB)") + xlab("") +
  geom_line(aes(x = date, y = OBS_VALUE/gdp, color = Indicateur)) +
  theme(legend.title = element_blank(),
        legend.position = c(0.5, 0.5)) +
  scale_x_date(breaks = seq(1950, 2100, 1) |> paste0("-01-01") |> as.Date(),
               labels = date_format("%Y")) +
  scale_y_log10(labels = percent_format(acc = 1),
                breaks = seq(0, 2, 0.01)) +
  geom_label(aes(x = date, y = OBS_VALUE/gdp, label = percent(OBS_VALUE/gdp, acc = 0.1), color = Indicateur), show.legend = F)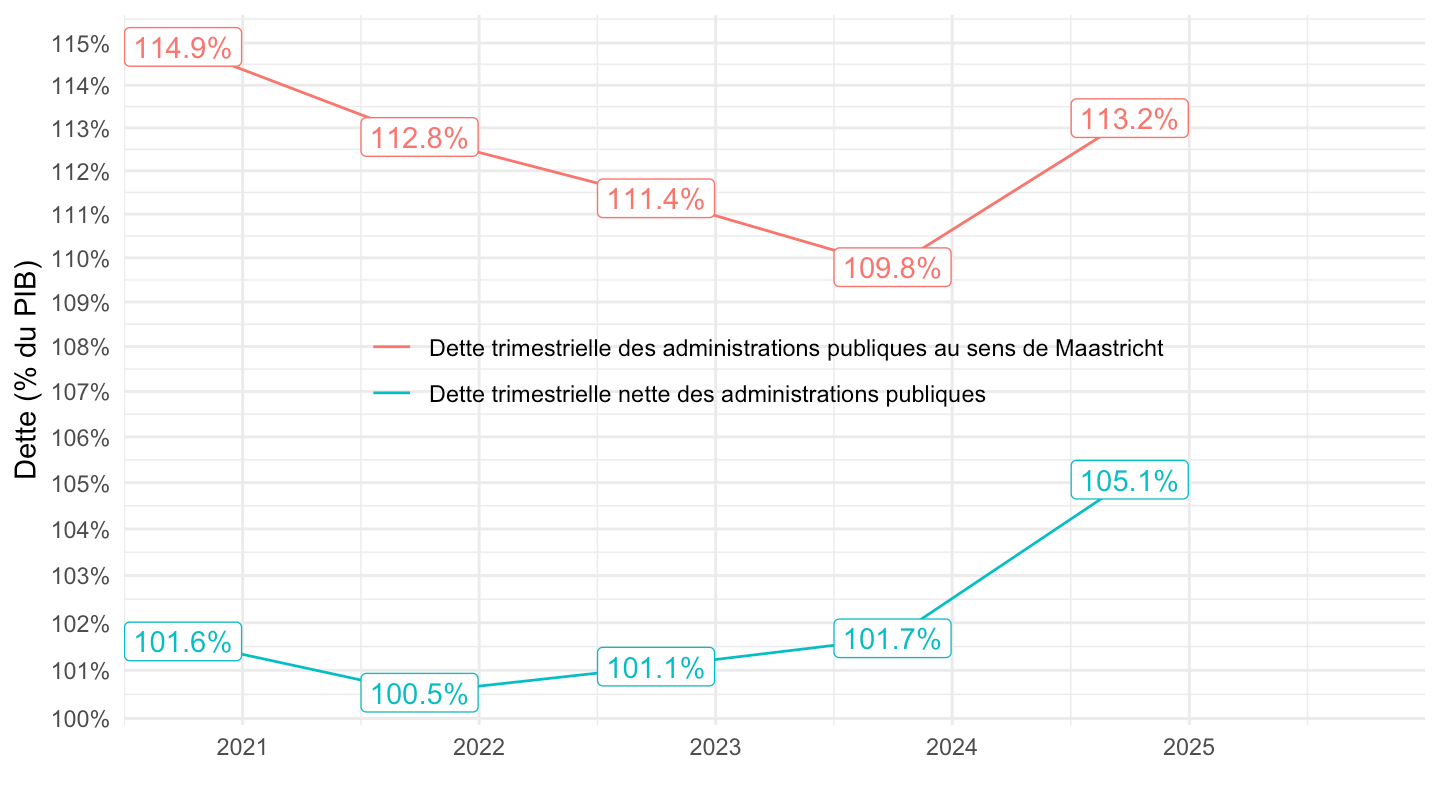
| source | dataset | Title | Updated |
|---|---|---|---|


