| source | dataset | Title | .html | .rData |
|---|---|---|---|---|
| insee | T_3217 | 3.217 – Principaux impôts par catégorie (En milliards d'euros) | 2026-07-23 | 2026-07-19 |
| insee | CNA-2020-PIB | Produit intérieur brut (PIB) et ses composantes | 2026-07-23 | 2026-07-23 |
3.217 – Principaux impôts par catégorie (En milliards d’euros)
Données - INSEE
Info
Données sur les finances publiques
| source | dataset | Title | .html | .rData |
|---|---|---|---|---|
| insee | T_3201 | 3.201 – Dépenses et recettes des administrations publiques (S13) (En milliards d'euros) | 2026-07-23 | 2026-07-23 |
| insee | T_3217 | 3.217 – Principaux impôts par catégorie (En milliards d'euros) | 2026-07-23 | 2026-07-19 |
| insee | T_7301 | 7.301 – Compte des administrations publiques (S13) (En milliards d'euros) | 2026-07-23 | 2025-10-24 |
Last
Code
T_3217 %>%
  group_by(year) %>%
  summarise(Nobs = n()) %>%
  arrange(desc(year)) %>%
  head(1) %>%
print_table_conditional()| year | Nobs |
|---|---|
| 2025 | 95 |
Principaux impots
Code
ig_b("insee", "TEF2020", "recette-administrations-publiques-bind")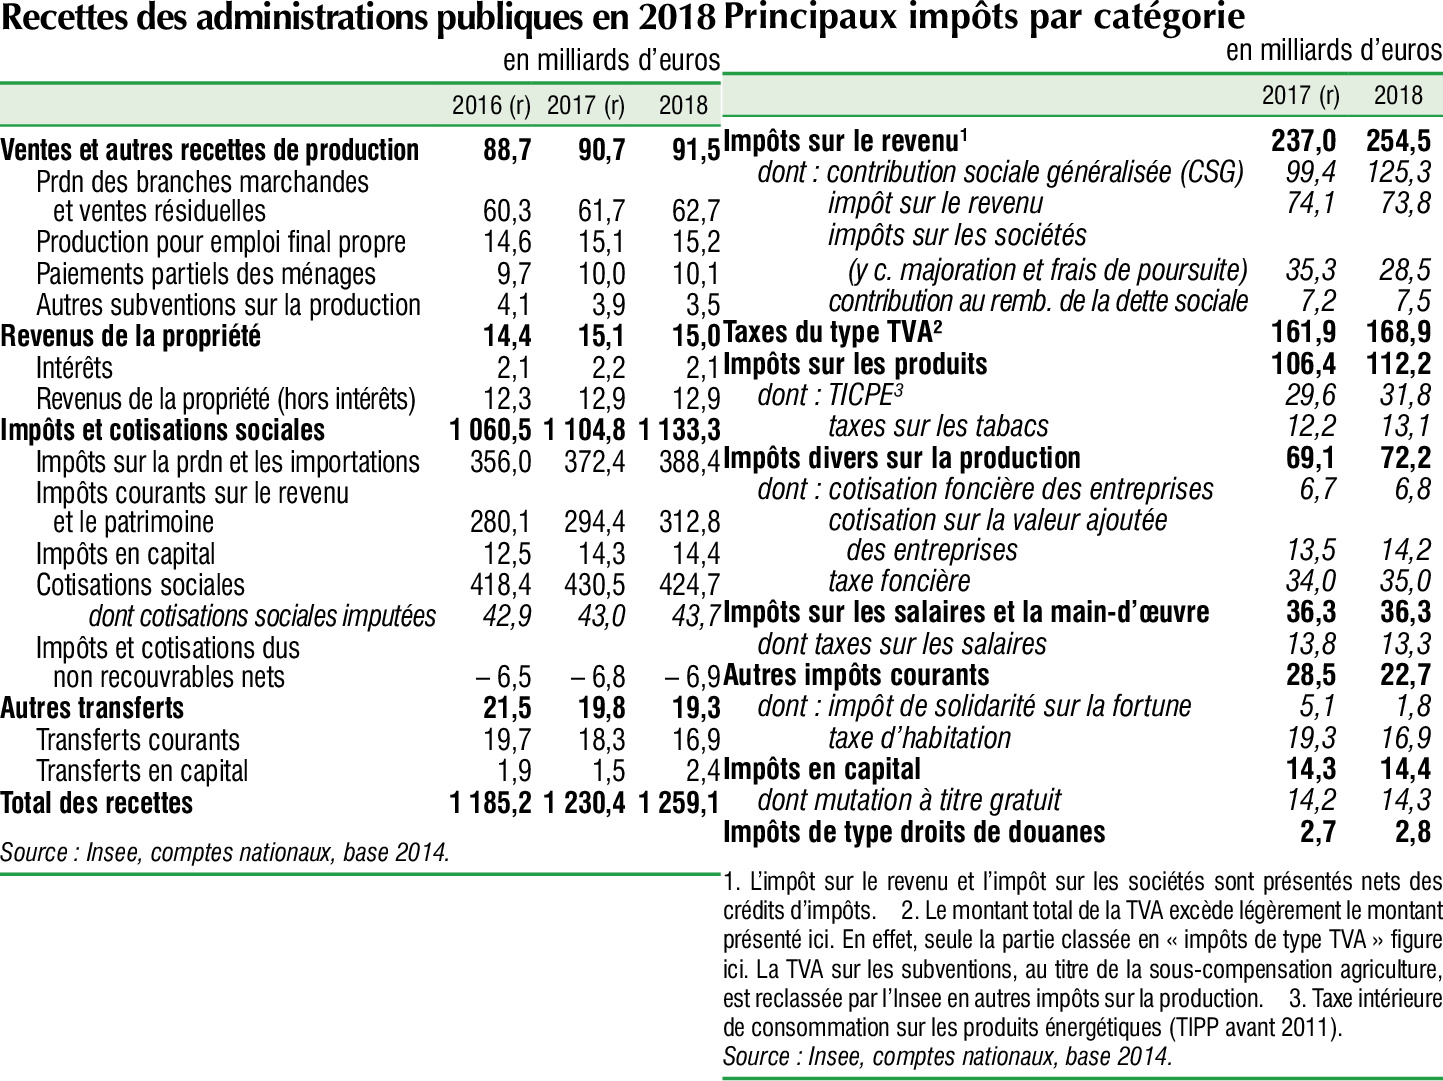
Données
2019-2023 Bind
Code
ig_b("insee", "T_3217-table")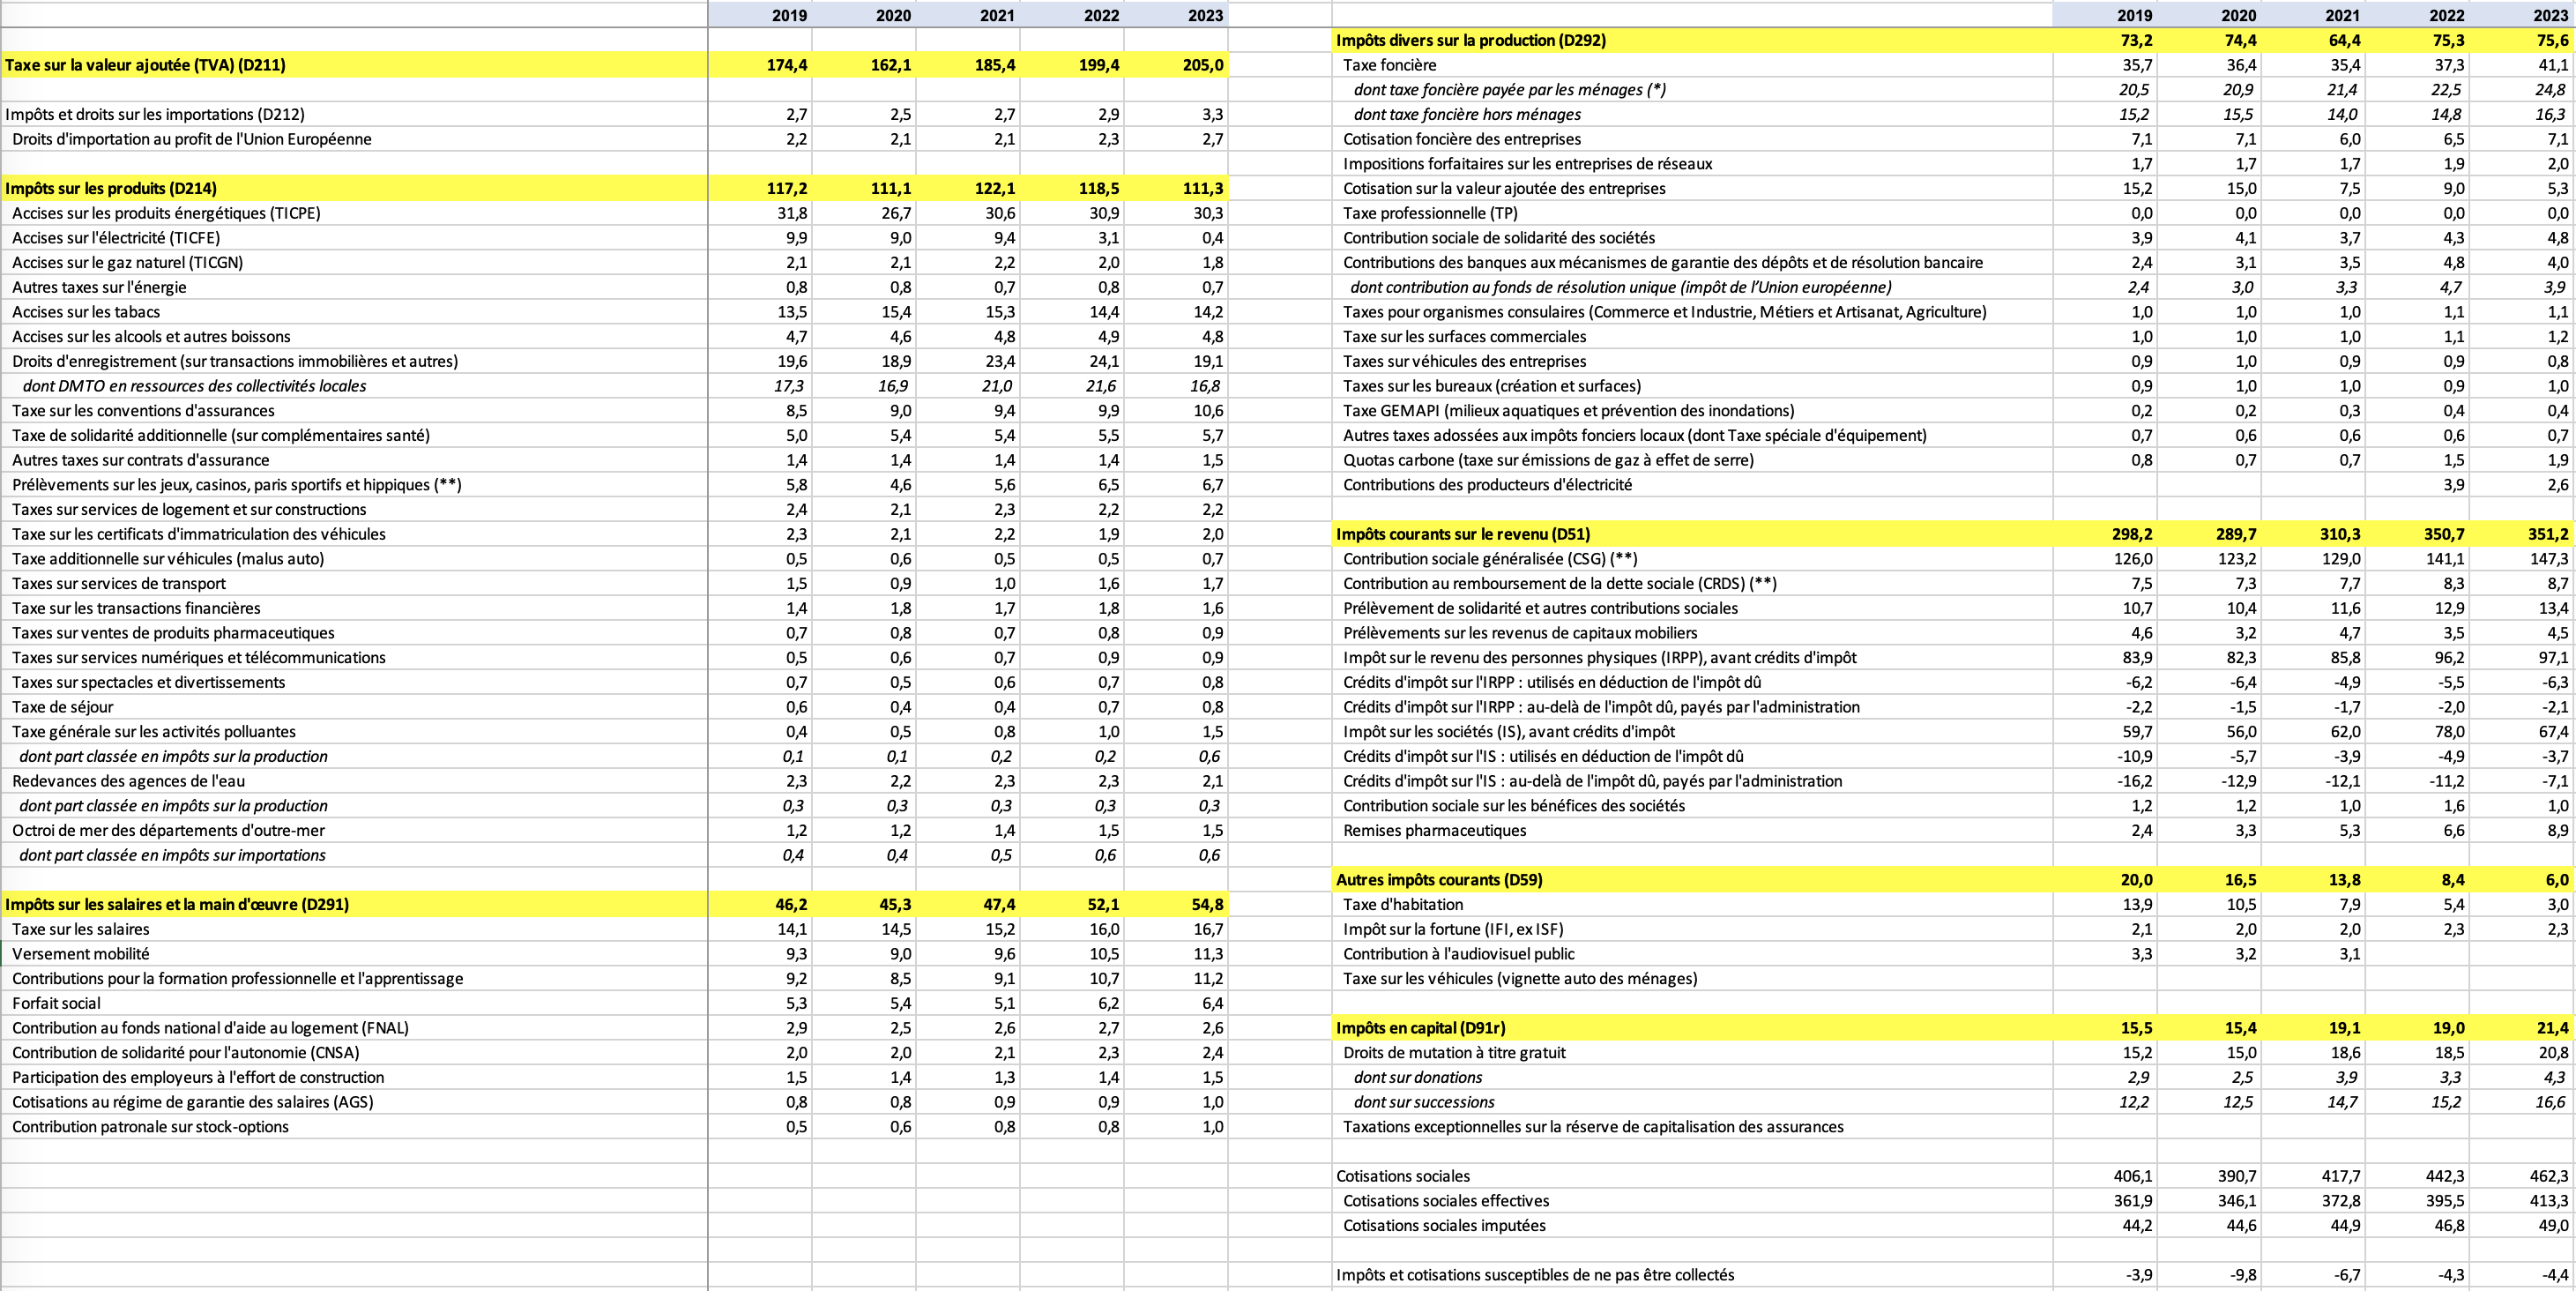
2015-2019 Bind
Code
ig_b("insee", "T_3217_bind")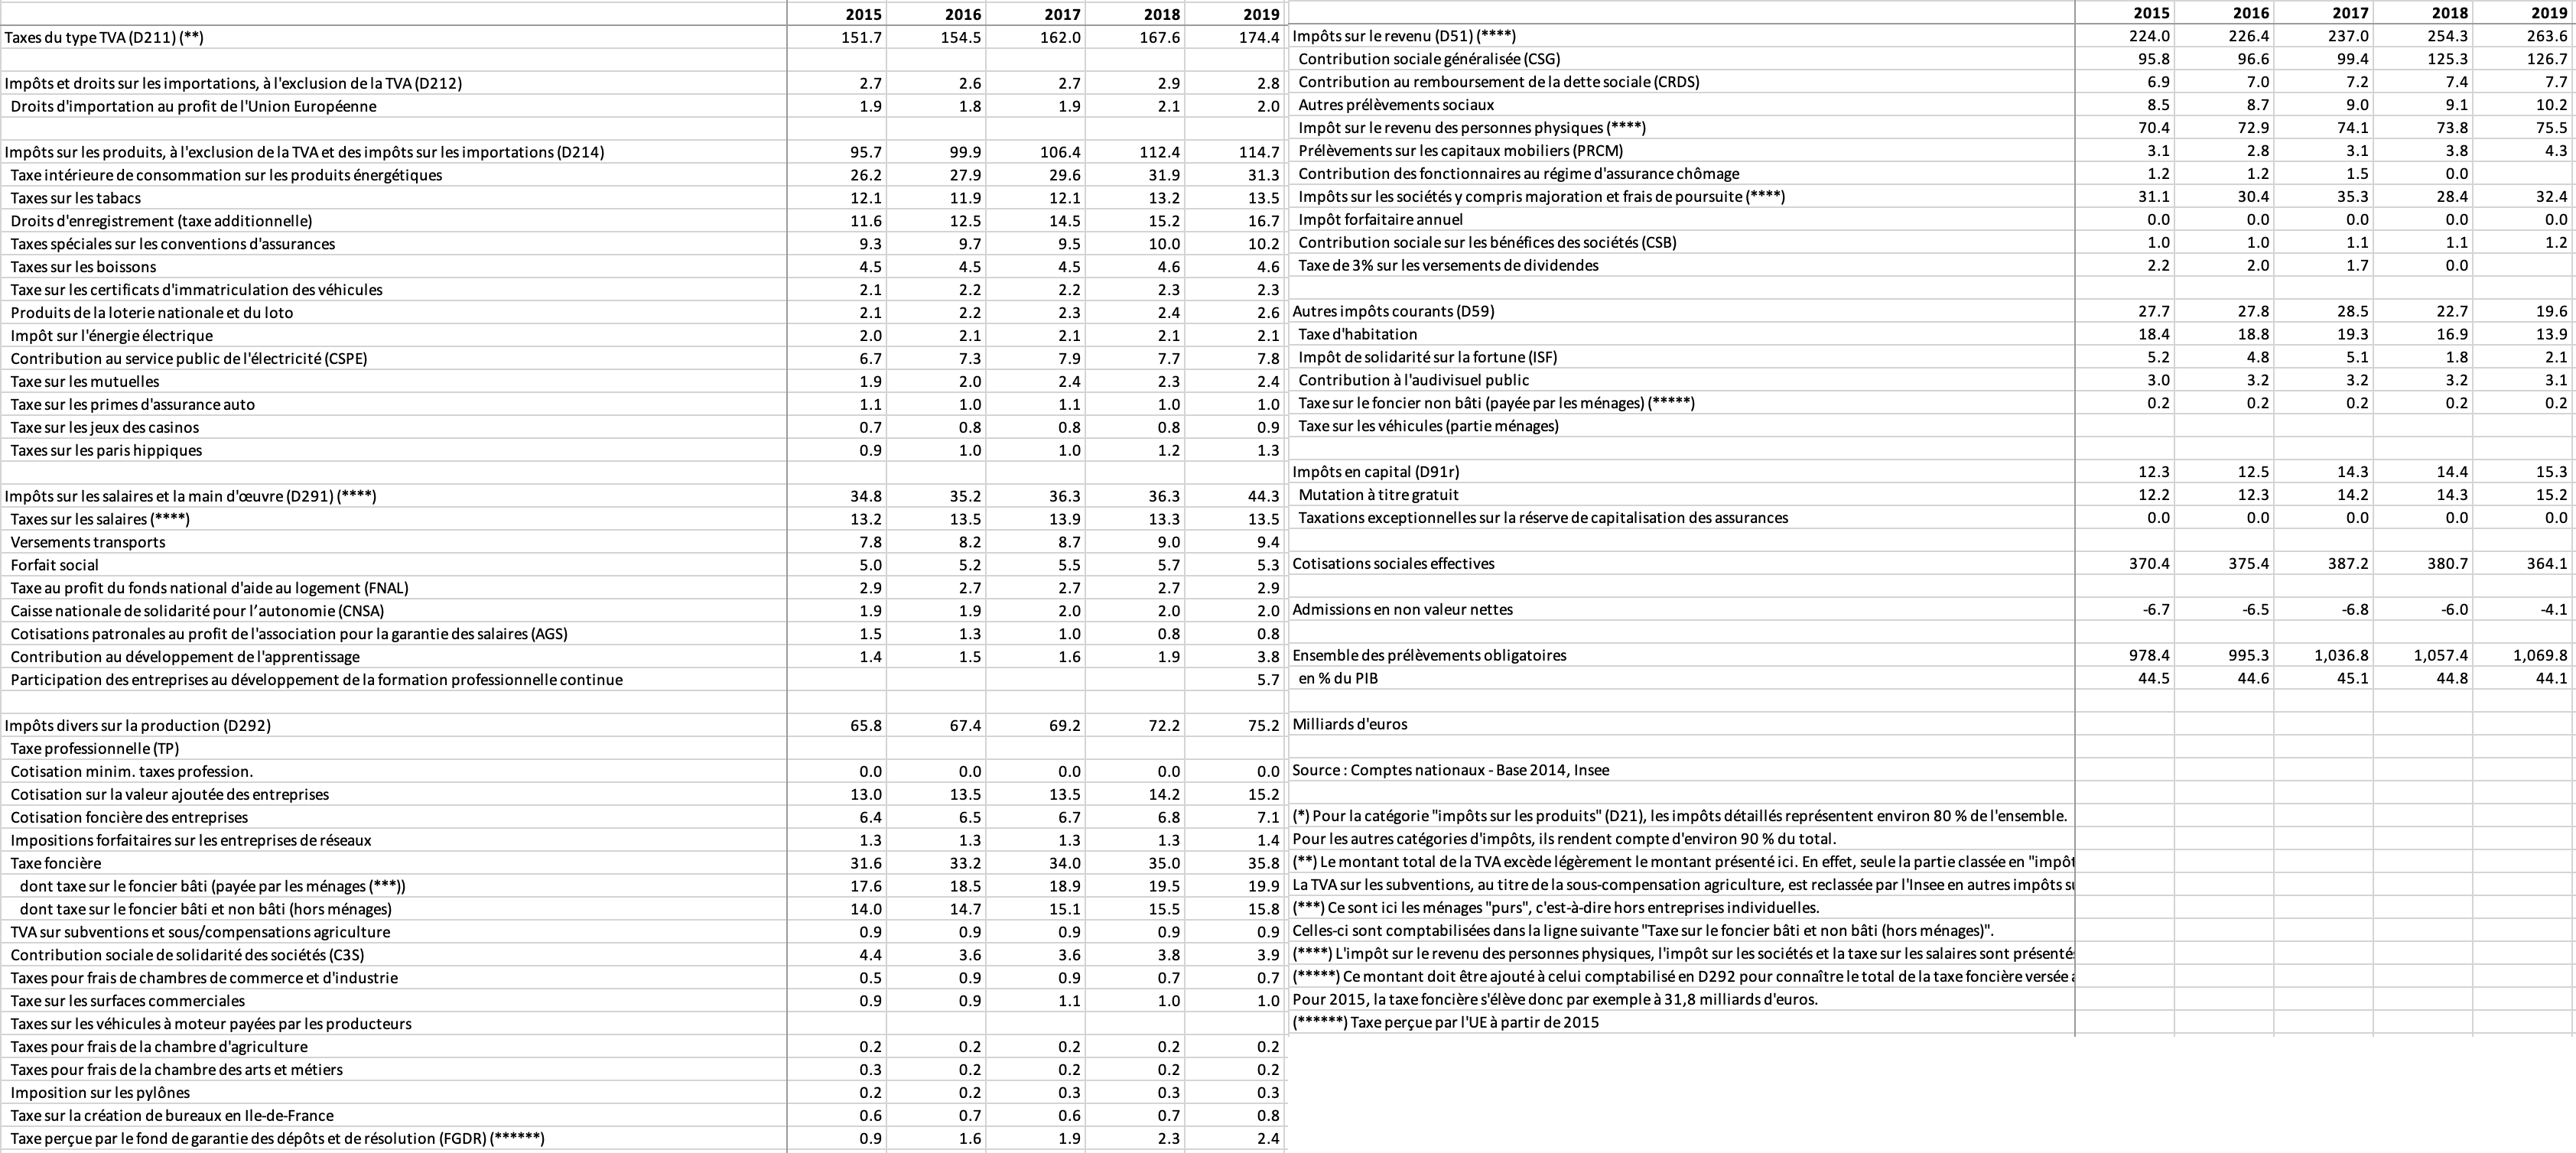
Ordre Ligne
Code
T_3217 %>%
  filter(max(year) == year) %>%
  left_join(gdp, by = "year") %>%
  select(-year) %>%
  mutate(`%` = round(100*value / gdp, 2)) %>%
  {if (is_html_output()) datatable(., filter = 'top', rownames = F) else .}
Ordre décroissant
Code
T_3217 %>%
  filter(max(year) == year) %>%
  left_join(gdp, by = "year") %>%
  select(-year) %>%
  mutate(`%` = round(100*value / gdp, 2)) %>%
  arrange(-value) %>%
  {if (is_html_output()) datatable(., filter = 'top', rownames = F) else .}
Individuel
Ensemble des prélèvements obligatoires
Code
T_3217 %>%
  filter(line %in% c(102, 108)) %>%
  left_join(gdp, by = "year") %>%
  year_to_date2 %>%
  ggplot + geom_line(aes(x = date, y = value / gdp, color = Line)) +
  theme_minimal() + xlab("") + ylab("% du PIB") +
  scale_x_date(breaks = seq(1960, 2100, 2) %>% paste0("-01-01") %>% as.Date,
               labels = date_format("%Y")) +
  scale_y_continuous(breaks = 0.01*seq(0, 500, 1),
                labels = percent_format(accuracy = 1)) +

  theme(legend.position = c(0.75, 0.15),
        legend.title = element_blank()) +
  geom_label(data = . %>%
               group_by(Line) %>%
               filter(date == max(date)), aes(x = date, y = value / gdp, label = paste0(round(value, 1), " Md"), color = Line))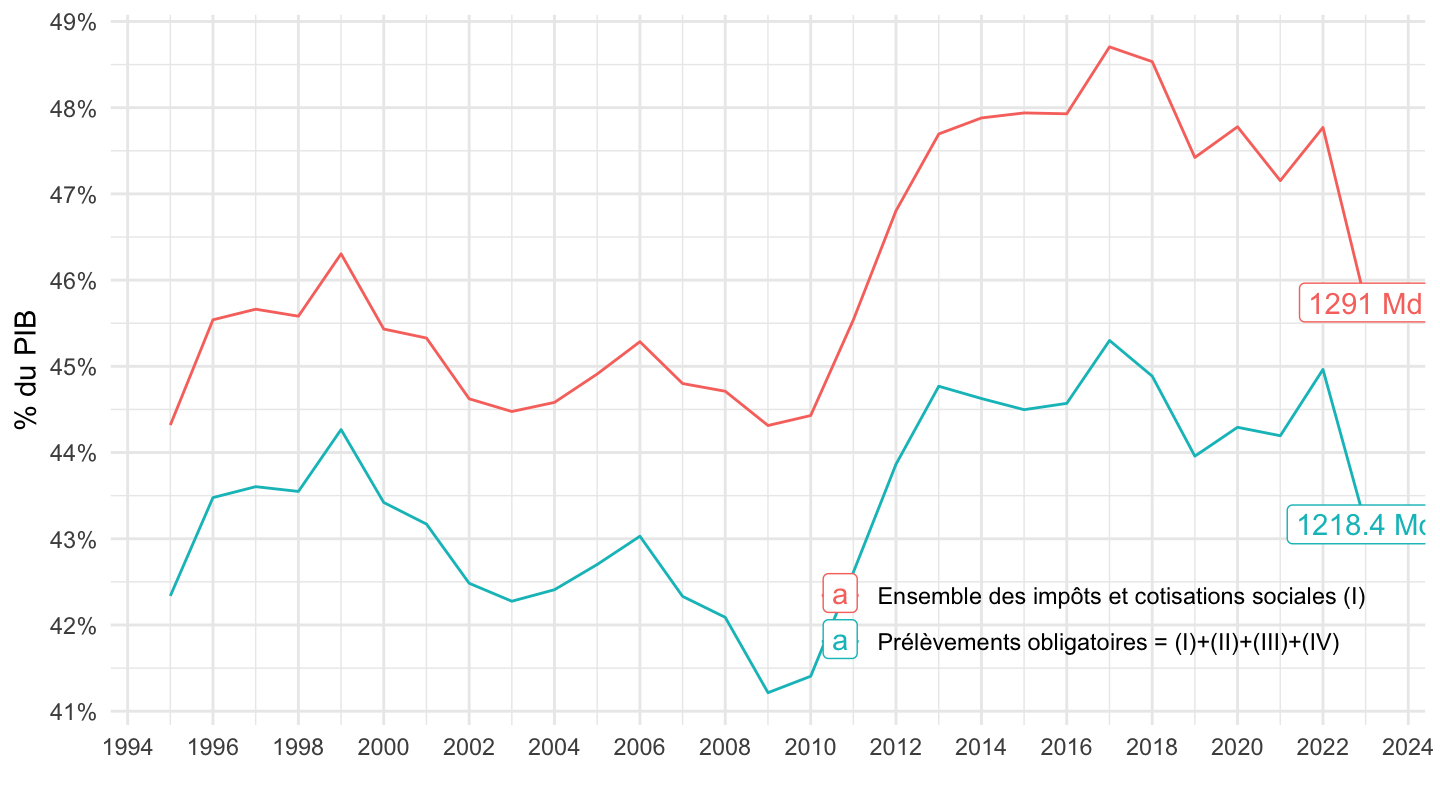
Cotisations sociales effectives
Code
T_3217 %>%
  filter(line %in% c(96, 97)) %>%
  left_join(gdp, by = "year") %>%
  year_to_date2 %>%
  ggplot + geom_line(aes(x = date, y = value / gdp, color = Line)) +
  theme_minimal() + xlab("") + ylab("% du PIB") +
  scale_x_date(breaks = seq(1960, 2100, 2) %>% paste0("-01-01") %>% as.Date,
               labels = date_format("%Y")) +
  scale_y_continuous(breaks = 0.01*seq(0, 500, 1),
                labels = percent_format(accuracy = 1)) +

  theme(legend.position = c(0.75, 0.15),
        legend.title = element_blank()) +
  geom_label(data = . %>%
               group_by(Line) %>%
               filter(date == max(date)), aes(x = date, y = value / gdp, label = paste0(round(value, 1), " Md"), color = Line))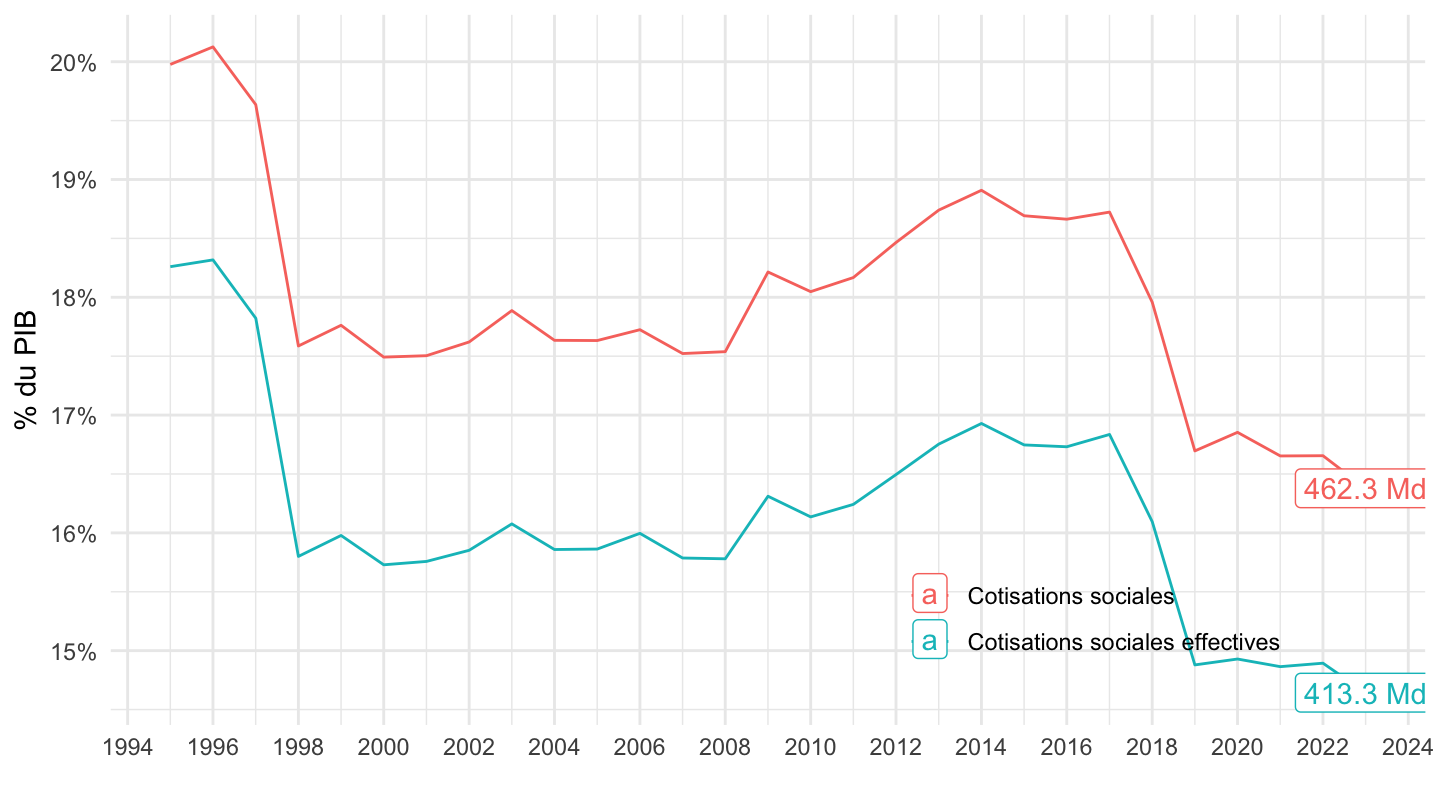
Tabac
Code
T_3217 %>%
  filter(line %in% c(15)) %>%
  left_join(gdp, by = "year") %>%
  year_to_date2 %>%
  ggplot + geom_line(aes(x = date, y = value / gdp)) +
  theme_minimal() + xlab("") + ylab("% du PIB") +
  scale_x_date(breaks = seq(1960, 2100, 5) %>% paste0("-01-01") %>% as.Date,
               labels = date_format("%Y")) +
  scale_y_continuous(breaks = 0.01*seq(0, 500, 0.02),
                labels = percent_format(accuracy = .01)) +

  theme(legend.position = c(0.75, 0.15),
        legend.title = element_blank()) +
  geom_label(data = . %>%
               group_by(Line) %>%
               filter(date == max(date)), aes(x = date, y = value / gdp, label = paste0(round(value, 1), " Md"), color = Line))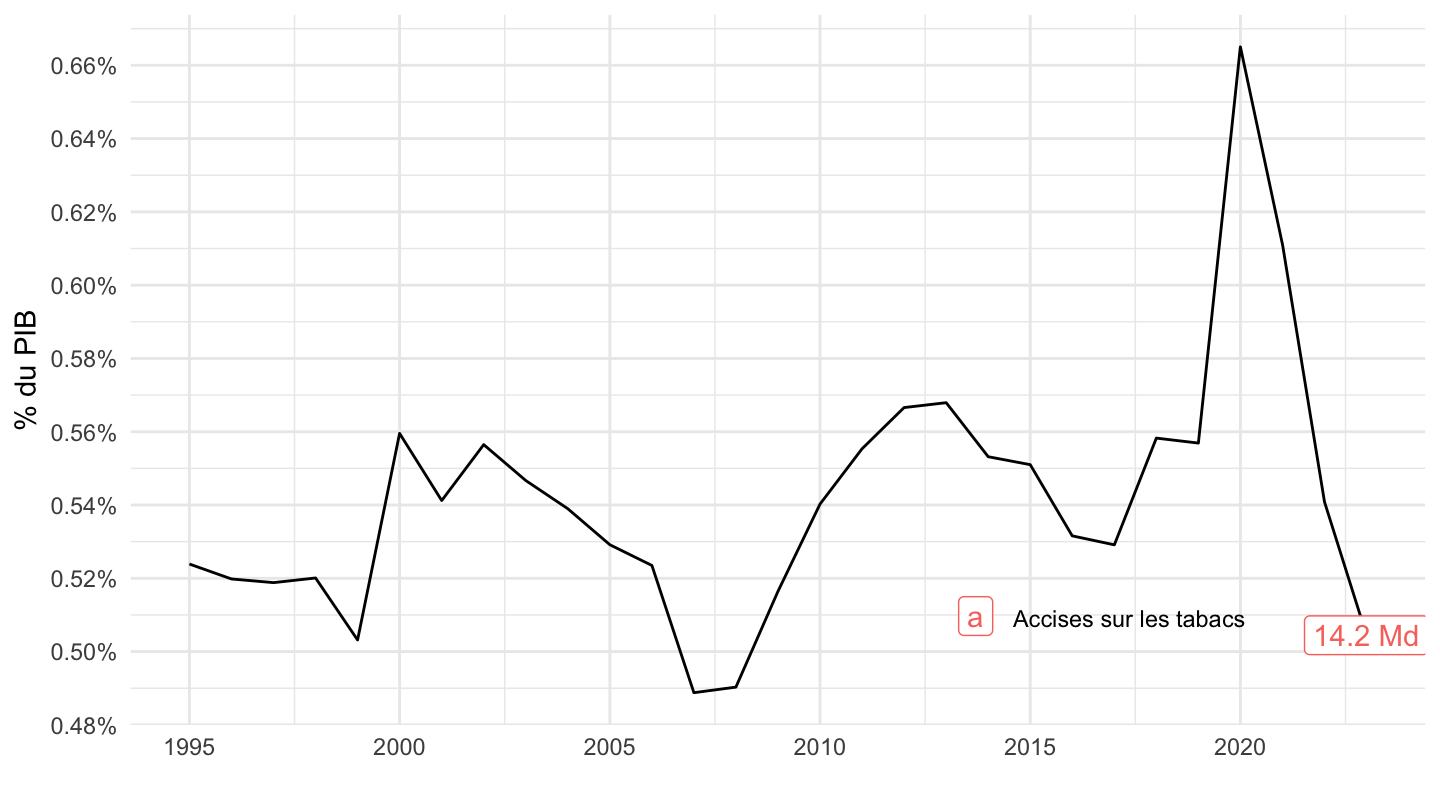
CSG (Santé), Tabac
Code
T_3217 %>%
  filter(line %in% c(71, 15)) %>%
  left_join(gdp, by = "year") %>%
  year_to_date2 %>%
  ggplot + geom_line(aes(x = date, y = value / gdp, color = Line)) +
  theme_minimal() + xlab("") + ylab("% du PIB") +
  scale_x_date(breaks = seq(1960, 2100, 2) %>% paste0("-01-01") %>% as.Date,
               labels = date_format("%Y")) +
  scale_y_continuous(breaks = 0.01*seq(0, 500, 1),
                labels = percent_format(accuracy = 1)) +

  theme(legend.position = c(0.75, 0.15),
        legend.title = element_blank()) +
  geom_label(data = . %>%
               group_by(Line) %>%
               filter(date == max(date)), aes(x = date, y = value / gdp, label = paste0(round(value, 1), " Md"), color = Line))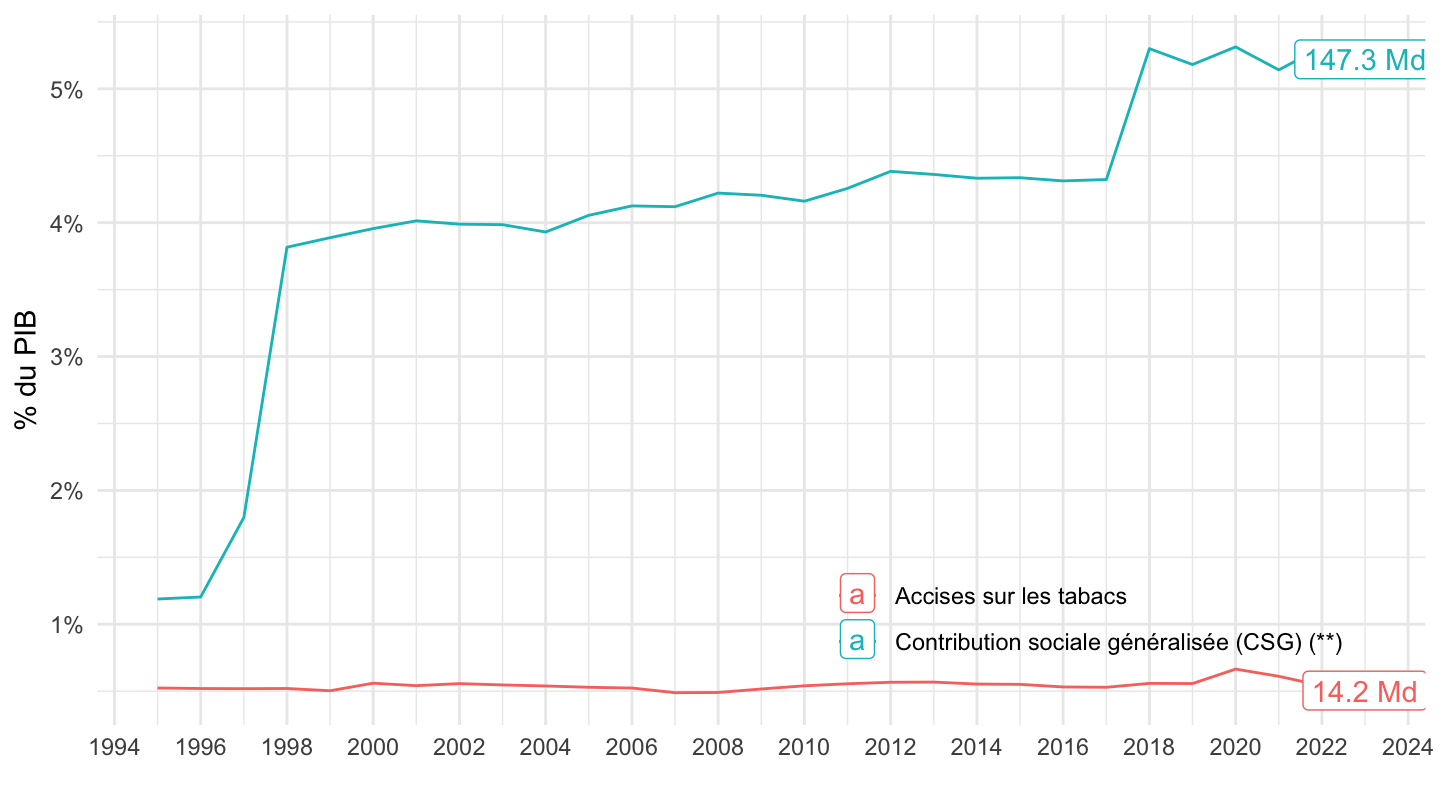
Gros prélèvements
TVA, produits
Code
T_3217 %>%
  filter(line %in% c(5, 10, 40, 50)) %>%
  left_join(gdp, by = "year") %>%
  year_to_date2 %>%
  ggplot + geom_line(aes(x = date, y = value / gdp, color = Line)) +
  theme_minimal() + xlab("") + ylab("% du PIB") +
  scale_x_date(breaks = seq(1960, 2100, 2) %>% paste0("-01-01") %>% as.Date,
               labels = date_format("%Y")) +
  scale_y_continuous(breaks = 0.01*seq(0, 500, 1),
                labels = percent_format(accuracy = 1)) +

  theme(legend.position = c(0.55, 0.55),
        legend.title = element_blank()) +
  geom_label(data = . %>%
               group_by(Line) %>%
               filter(date == max(date)), aes(x = date, y = value / gdp, label = paste0(round(value, 1), " Md"), color = Line))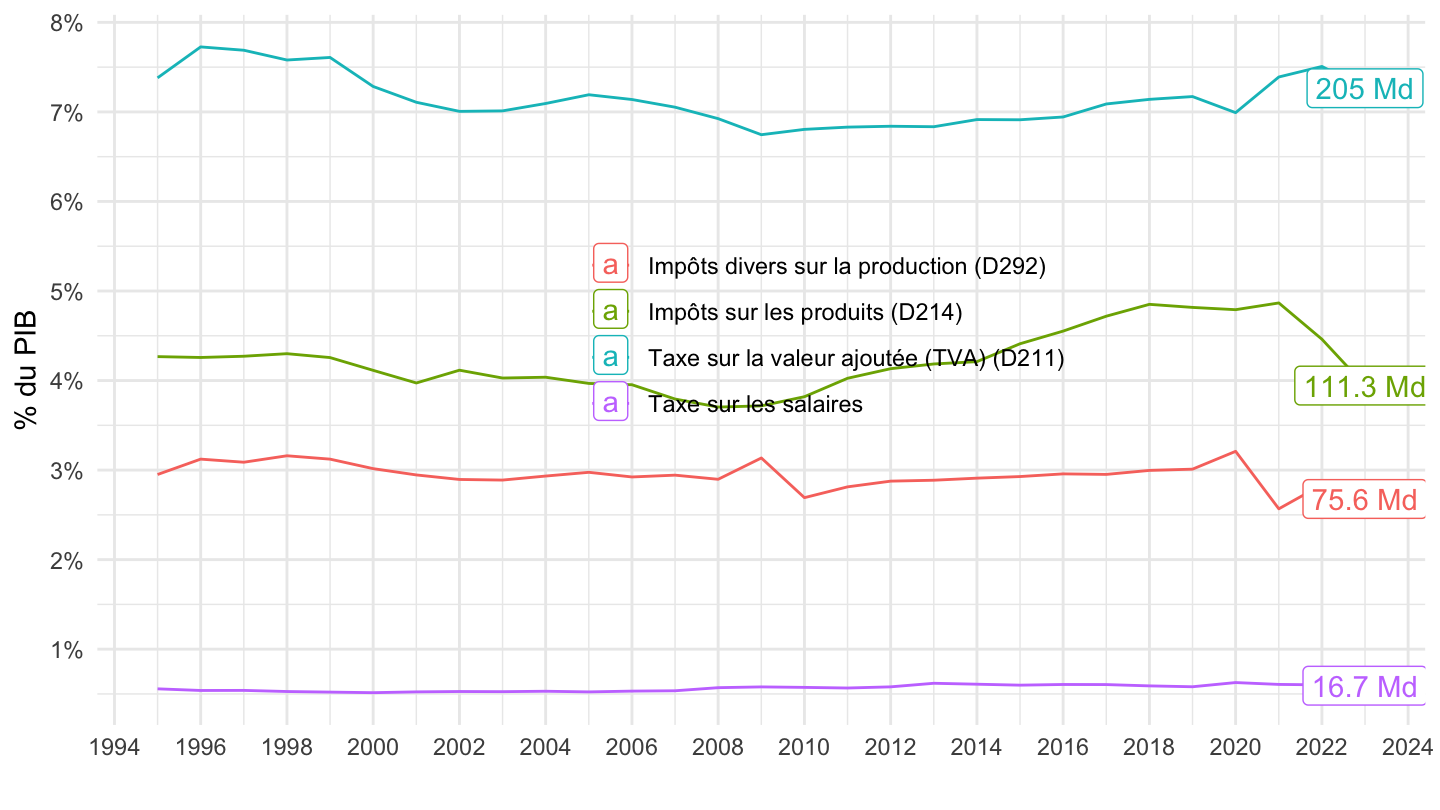
Impôt sur les sociétés
Code
T_3217 %>%
  filter(line %in% c(78)) %>%
  left_join(gdp, by = "year") %>%
  year_to_date2 %>%
  ggplot + geom_line(aes(x = date, y = value / gdp, color = Line)) +
  theme_minimal() + xlab("") + ylab("% du PIB") +
  scale_x_date(breaks = seq(1960, 2100, 2) %>% paste0("-01-01") %>% as.Date,
               labels = date_format("%Y")) +
  scale_y_continuous(breaks = 0.01*seq(0, 500, .2),
                labels = percent_format(accuracy = .1)) +

  theme(legend.position = c(0.6, 0.9),
        legend.title = element_blank()) +
  geom_label(data = . %>%
               group_by(Line) %>%
               filter(date == max(date)), aes(x = date, y = value / gdp, label = paste0(round(value, 1), " Md"), color = Line))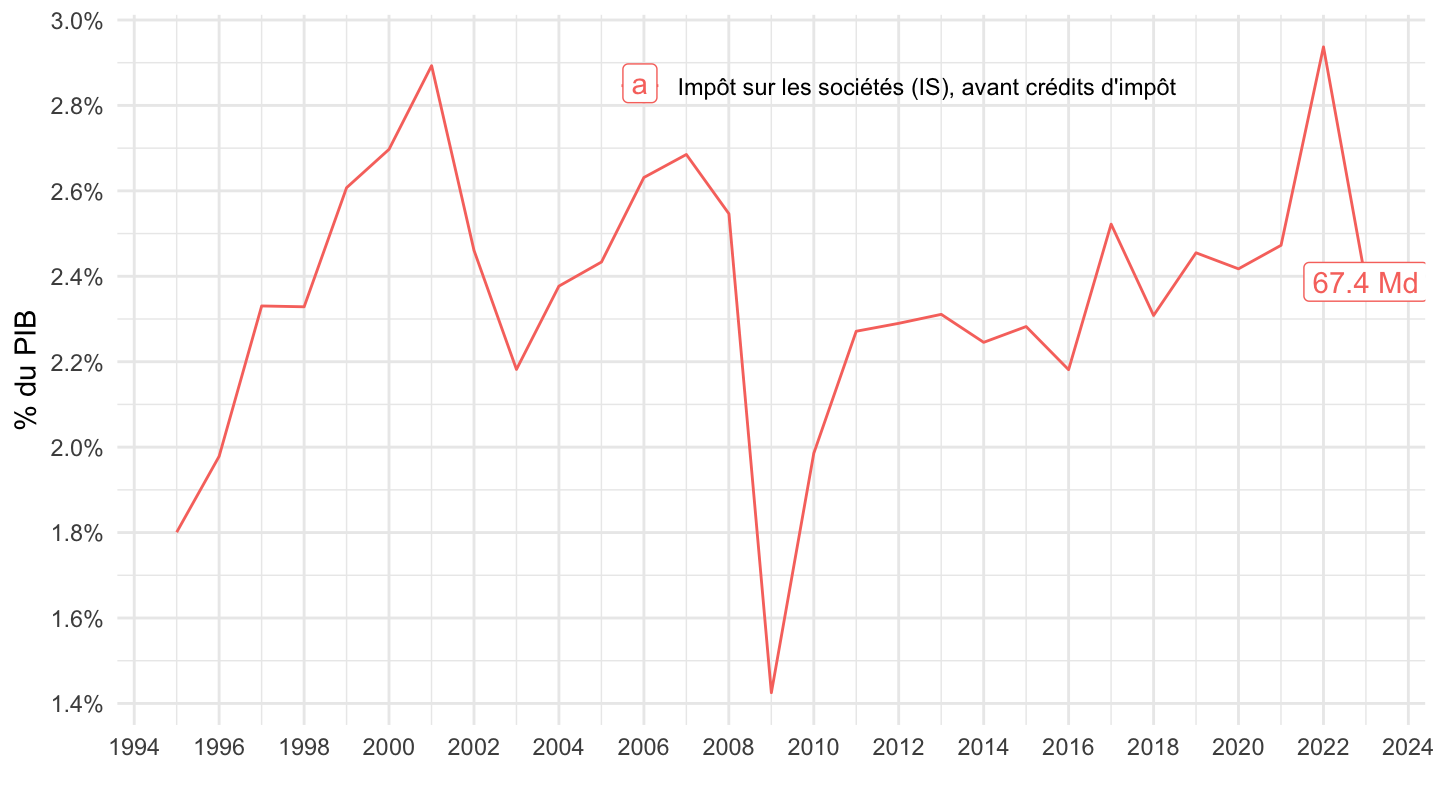
Impôt sur les sociétés, IR, TICPE
Code
T_3217 %>%
  filter(line %in% c(78, 75,11)) %>%
  left_join(gdp, by = "year") %>%
  year_to_date2 %>%
  ggplot + geom_line(aes(x = date, y = value / gdp, color = Line)) +
  theme_minimal() + xlab("") + ylab("% du PIB") +
  scale_x_date(breaks = seq(1960, 2100, 2) %>% paste0("-01-01") %>% as.Date,
               labels = date_format("%Y")) +
  scale_y_continuous(breaks = 0.01*seq(0, 500, .2),
                labels = percent_format(accuracy = .1)) +

  theme(legend.position = c(0.55, 0.9),
        legend.title = element_blank()) +
  geom_label(data = . %>%
               group_by(Line) %>%
               filter(date == max(date)), aes(x = date, y = value / gdp, label = paste0(round(value, 1), " Md"), color = Line))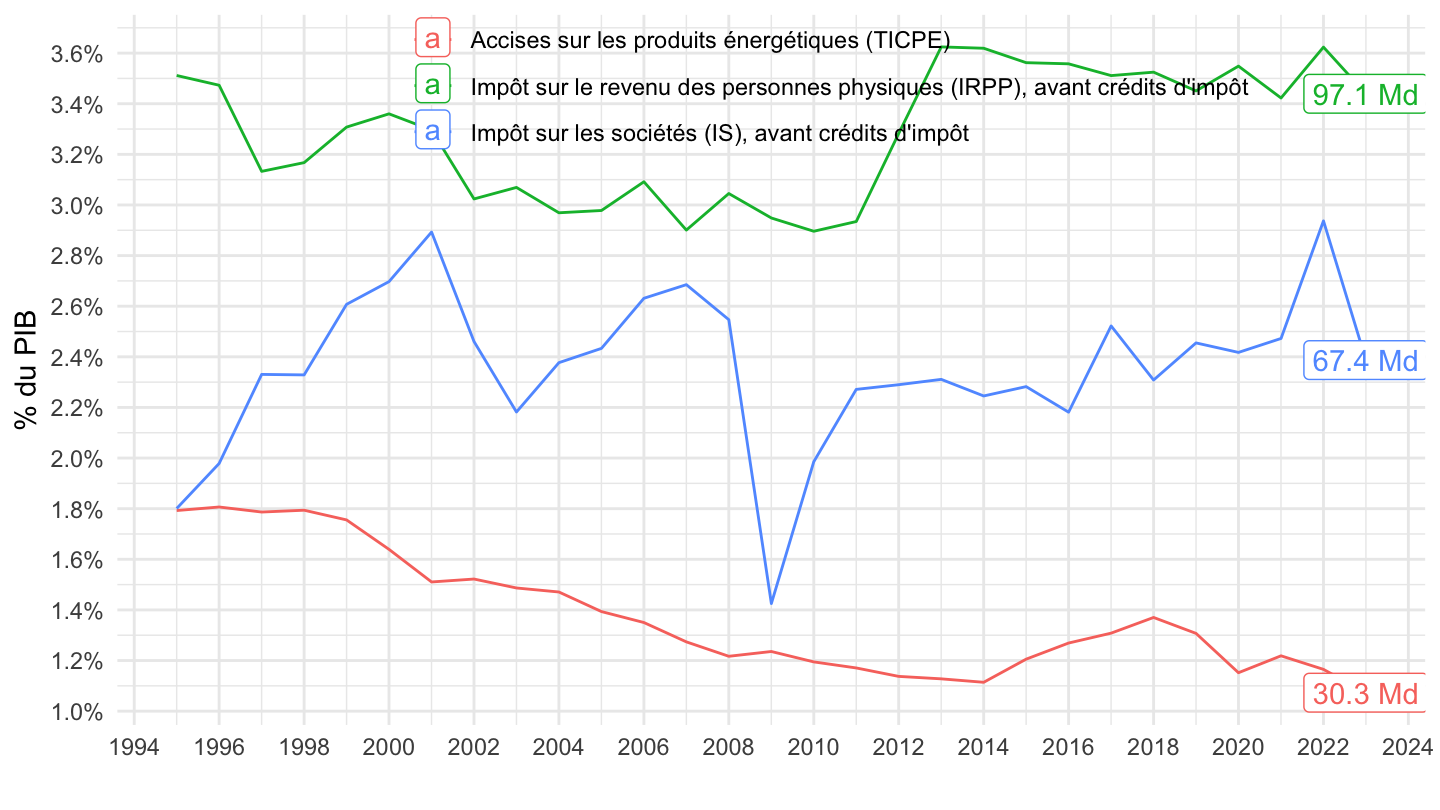
Droits d’enregistrement, droits de mutation, habitation, foncière
Code
T_3217 %>%
  filter(line %in% c(7, 64, 58, 33)) %>%
  left_join(gdp, by = "year") %>%
  year_to_date2 %>%
  ggplot + geom_line(aes(x = date, y = value / gdp, color = Line)) +
  theme_minimal() + xlab("") + ylab("% du PIB") +
  scale_x_date(breaks = seq(1960, 2100, 2) %>% paste0("-01-01") %>% as.Date,
               labels = date_format("%Y")) +
  scale_y_continuous(breaks = 0.01*seq(0, 500, .1),
                labels = percent_format(accuracy = .1)) +

  theme(legend.position = c(0.3, 0.9),
        legend.title = element_blank())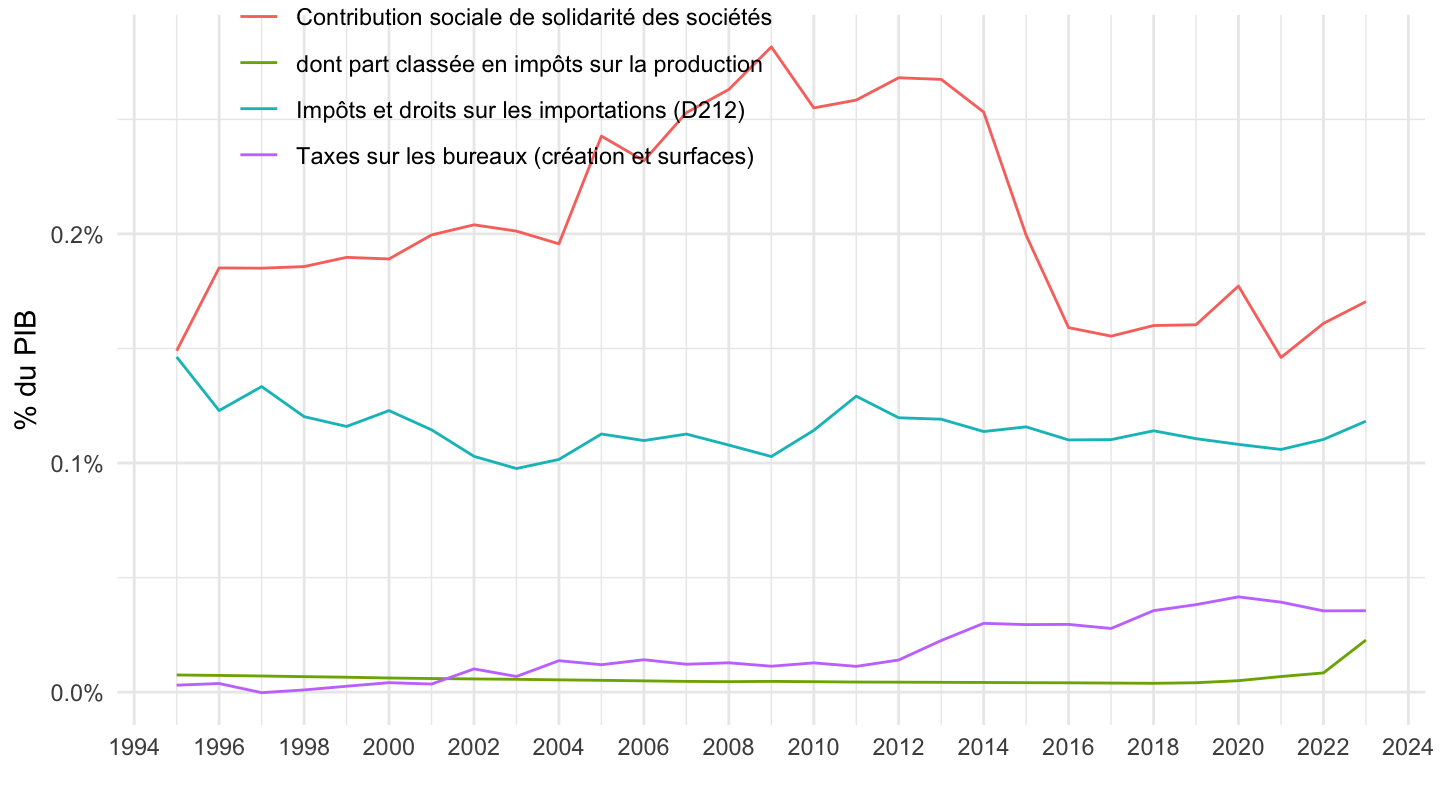
IR, TVA, CSG
Tous
Code
T_3217 %>%
  filter(line %in% c(5, 71, 75)) %>%
  left_join(gdp, by = "year") %>%
  year_to_date2 %>%
  ggplot + geom_line(aes(x = date, y = value / gdp, color = Line)) +
  theme_minimal() + xlab("") + ylab("% du PIB") +
  scale_x_date(breaks = seq(1960, 2100, 2) %>% paste0("-01-01") %>% as.Date,
               labels = date_format("%Y")) +
  scale_y_continuous(breaks = 0.01*seq(0, 500, 1),
                labels = percent_format(accuracy = 1)) +

  theme(legend.position = c(0.55, 0.15),
        legend.title = element_blank()) +
  geom_label(data = . %>%
               group_by(Line) %>%
               filter(date == max(date)), aes(x = date, y = value / gdp, label = paste0(round(value, 1), " Md"), color = Line))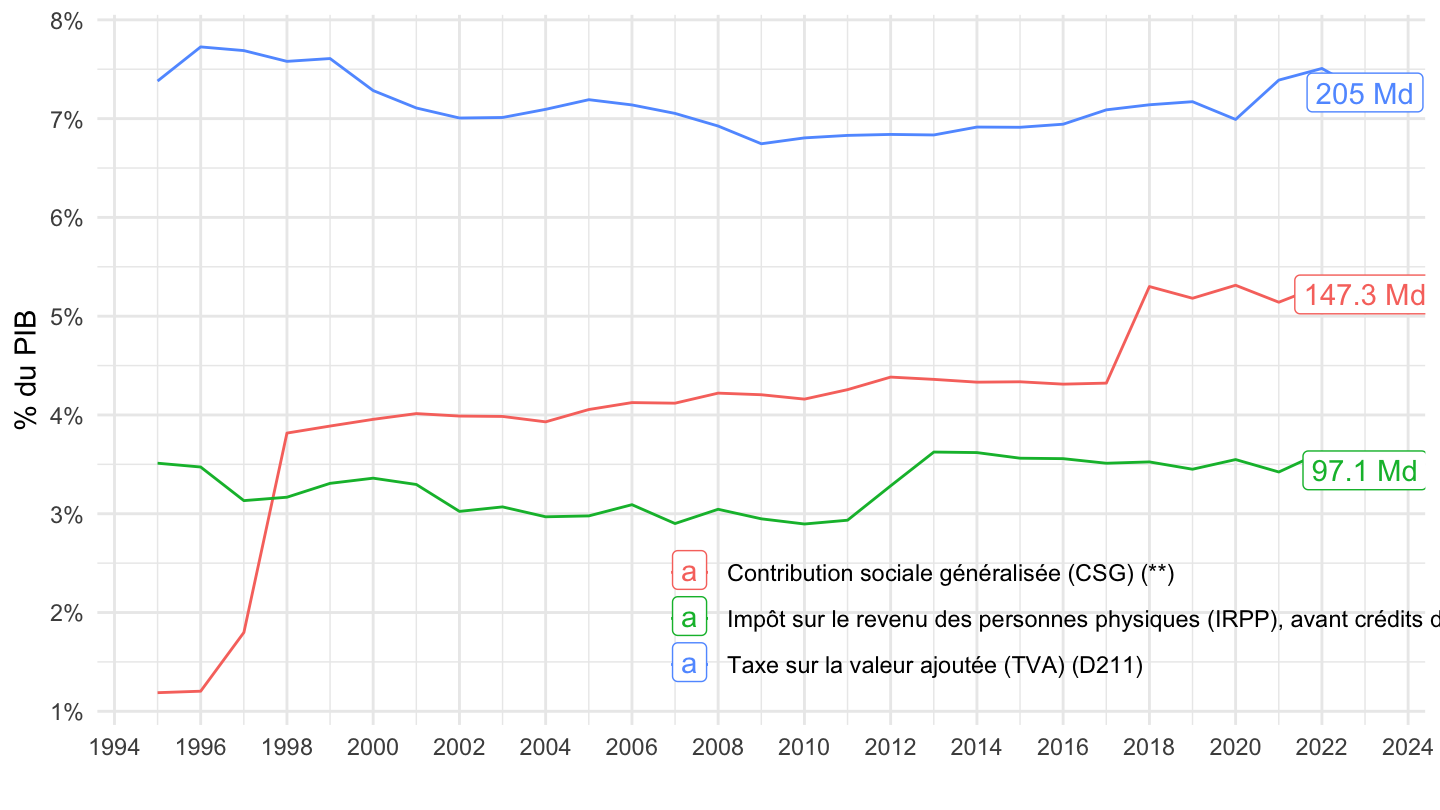
Court
Code
T_3217 %>%
  filter(line %in% c(5, 71, 75)) %>%
  left_join(tibble(line = c(5, 71, 75),
                   Variable = c("TVA", "Impôt sur le Revenu", "CSG"))) %>%
  left_join(gdp, by = "year") %>%
  year_to_date2 %>%
  ggplot + geom_line(aes(x = date, y = value / gdp, color = Variable)) +
  theme_minimal() + xlab("") + ylab("% du PIB") +
  scale_x_date(breaks = seq(1960, 2100, 2) %>% paste0("-01-01") %>% as.Date,
               labels = date_format("%Y")) +
  scale_y_continuous(breaks = 0.01*seq(0, 500, 1),
                labels = percent_format(accuracy = 1)) +

  theme(legend.position = c(0.85, 0.15),
        legend.title = element_blank()) +
  geom_label(data = . %>%
               group_by(Variable) %>%
               filter(date == max(date)), aes(x = date, y = value / gdp, label = paste0(round(value, 1), " Md"), color = Variable))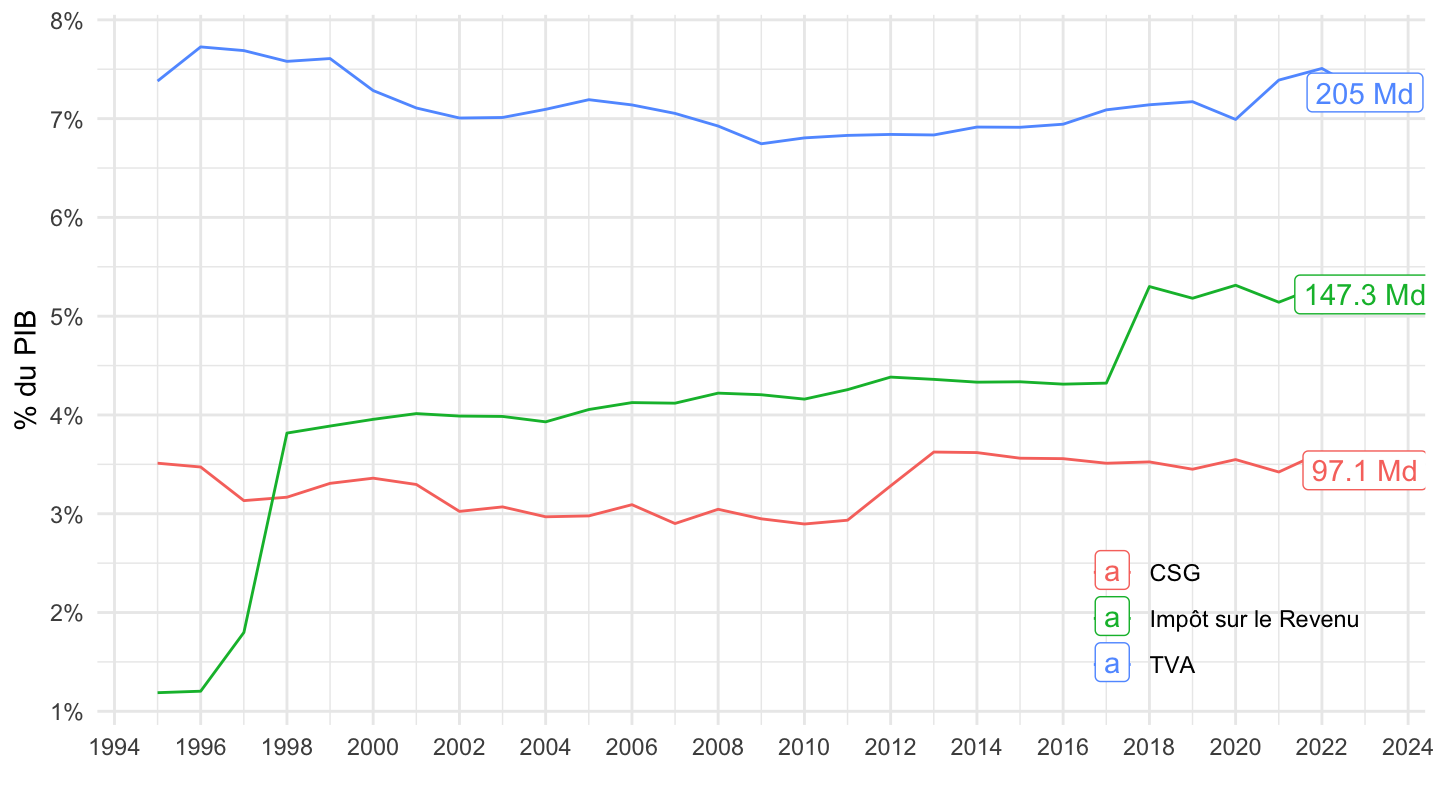
IR, CSG (Santé), TVA, Impôts sur les produits
Code
T_3217 %>%
  filter(line %in% c(5, 71, 75, 10)) %>%
  left_join(gdp, by = "year") %>%
  year_to_date2 %>%
  ggplot + geom_line(aes(x = date, y = value / gdp, color = Line)) +
  theme_minimal() + xlab("") + ylab("% du PIB") +
  scale_x_date(breaks = seq(1960, 2100, 5) %>% paste0("-01-01") %>% as.Date,
               labels = date_format("%Y")) +
  scale_y_continuous(breaks = 0.01*seq(0, 500, 1),
                labels = percent_format(accuracy = 1),
                limits = c(0, 0.08)) +

  theme(legend.position = c(0.6, 0.15),
        legend.title = element_blank()) +
  geom_label(data = . %>%
               group_by(Line) %>%
               filter(date == max(date)), aes(x = date, y = value / gdp, label = paste0(round(value, 1), " Md"), color = Line))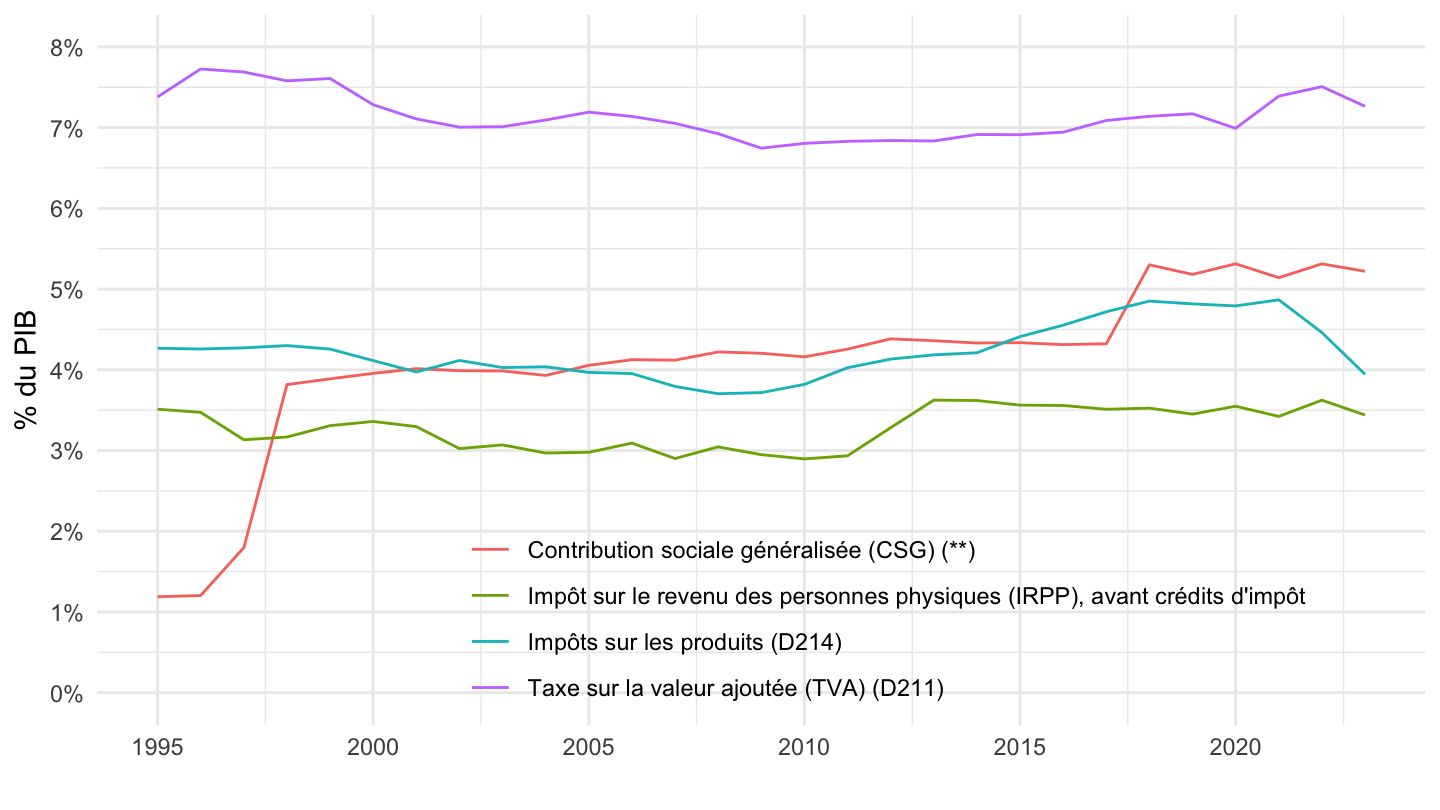
Taxe foncière, Impots divers sur la production, Impôts sur les salaires
Code
T_3217 %>%
  filter(line %in% c(51, 50, 39)) %>%
  left_join(gdp, by = "year") %>%
  year_to_date2 %>%
  ggplot + geom_line(aes(x = date, y = value / gdp, color = Line)) +
  theme_minimal() + xlab("") + ylab("% du PIB") +
  scale_x_date(breaks = seq(1960, 2100, 5) %>% paste0("-01-01") %>% as.Date,
               labels = date_format("%Y")) +
  scale_y_continuous(breaks = 0.01*seq(0, 500, .5),
                labels = percent_format(accuracy = .1)) +

  theme(legend.position = c(0.3, 0.5),
        legend.title = element_blank()) +
  geom_label(data = . %>%
               group_by(Line) %>%
               filter(date == max(date)), aes(x = date, y = value / gdp, label = paste0(round(value, 1), " Md"), color = Line))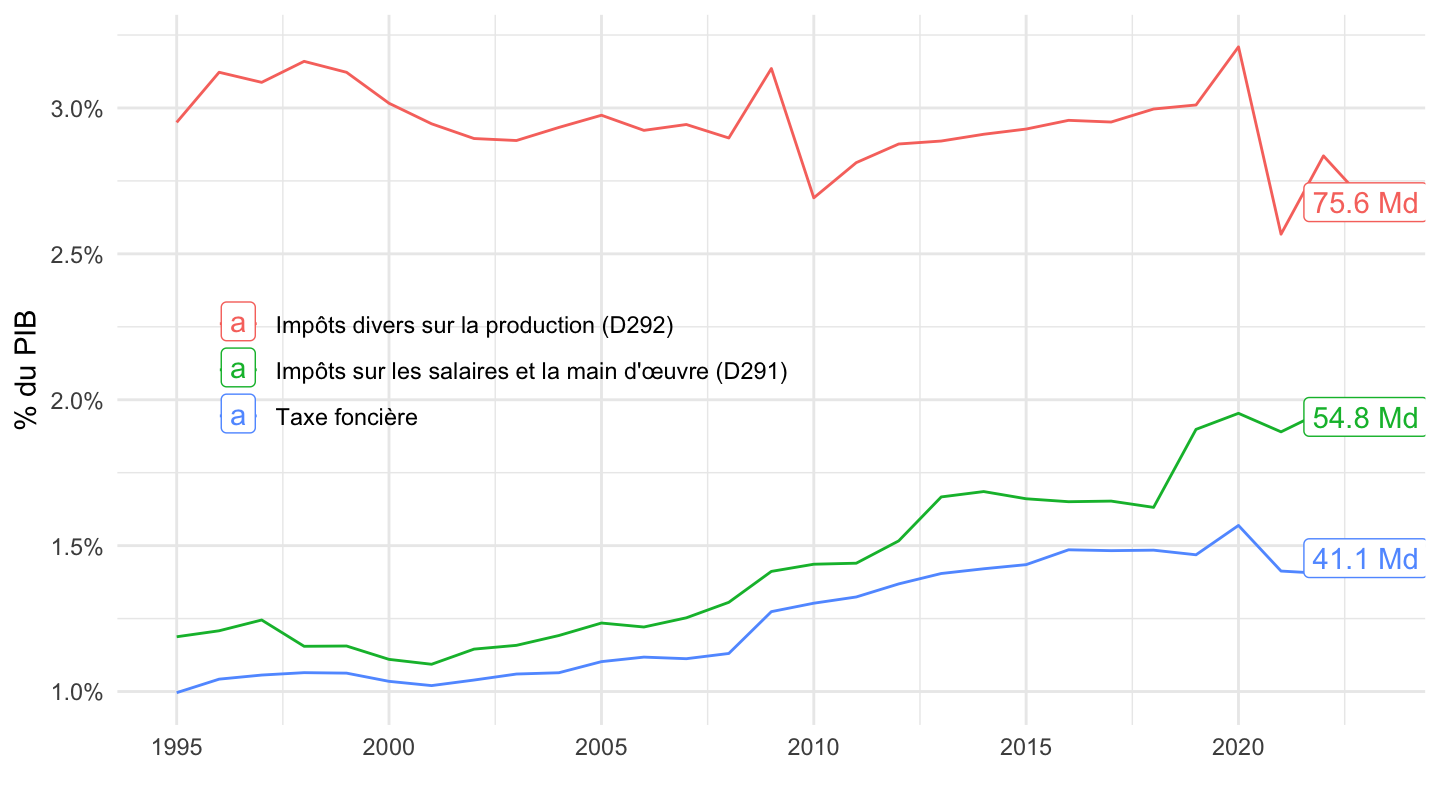
Autres impots, Droit enregistrement, IS, TIPP
Code
T_3217 %>%
  filter(line %in% c(8, 9, 13, 6, 14)) %>%
  left_join(gdp, by = "year") %>%
  year_to_date2 %>%
  ggplot + geom_line(aes(x = date, y = value / gdp, color = Line)) +
  theme_minimal() + xlab("") + ylab("% du PIB") +
  scale_x_date(breaks = seq(1960, 2100, 5) %>% paste0("-01-01") %>% as.Date,
               labels = date_format("%Y")) +
  scale_y_continuous(breaks = 0.01*seq(0, 500, .1),
                labels = percent_format(accuracy = .1)) +

  theme(legend.position = c(0.6, 0.9),
        legend.title = element_blank())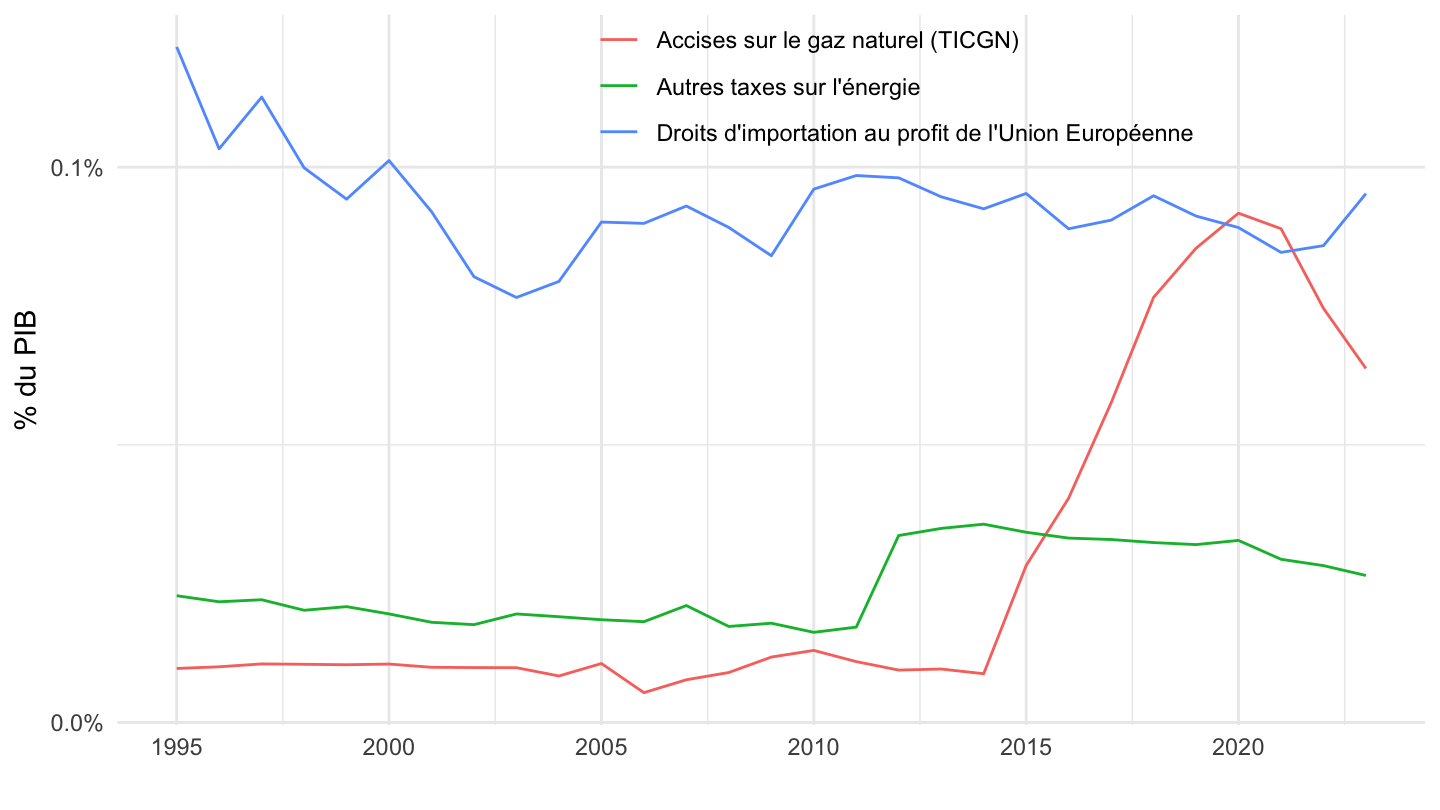
Autres impots, Droit enregistrement, IS, TIPP
All
Code
T_3217 %>%
  filter(line %in% c(8, 9, 13, 6, 14)) %>%
  left_join(gdp, by = "year") %>%
  year_to_date2 %>%
  ggplot + geom_line(aes(x = date, y = value / gdp, color = Line)) +
  theme_minimal() + xlab("") + ylab("% du PIB") +
  scale_x_date(breaks = seq(1960, 2100, 5) %>% paste0("-01-01") %>% as.Date,
               labels = date_format("%Y")) +
  scale_y_continuous(breaks = 0.01*seq(0, 500, .1),
                labels = percent_format(accuracy = .1),
                limits = c(0, 0.008)) +
  theme(legend.position = c(0.3, 0.86),
        legend.title = element_blank())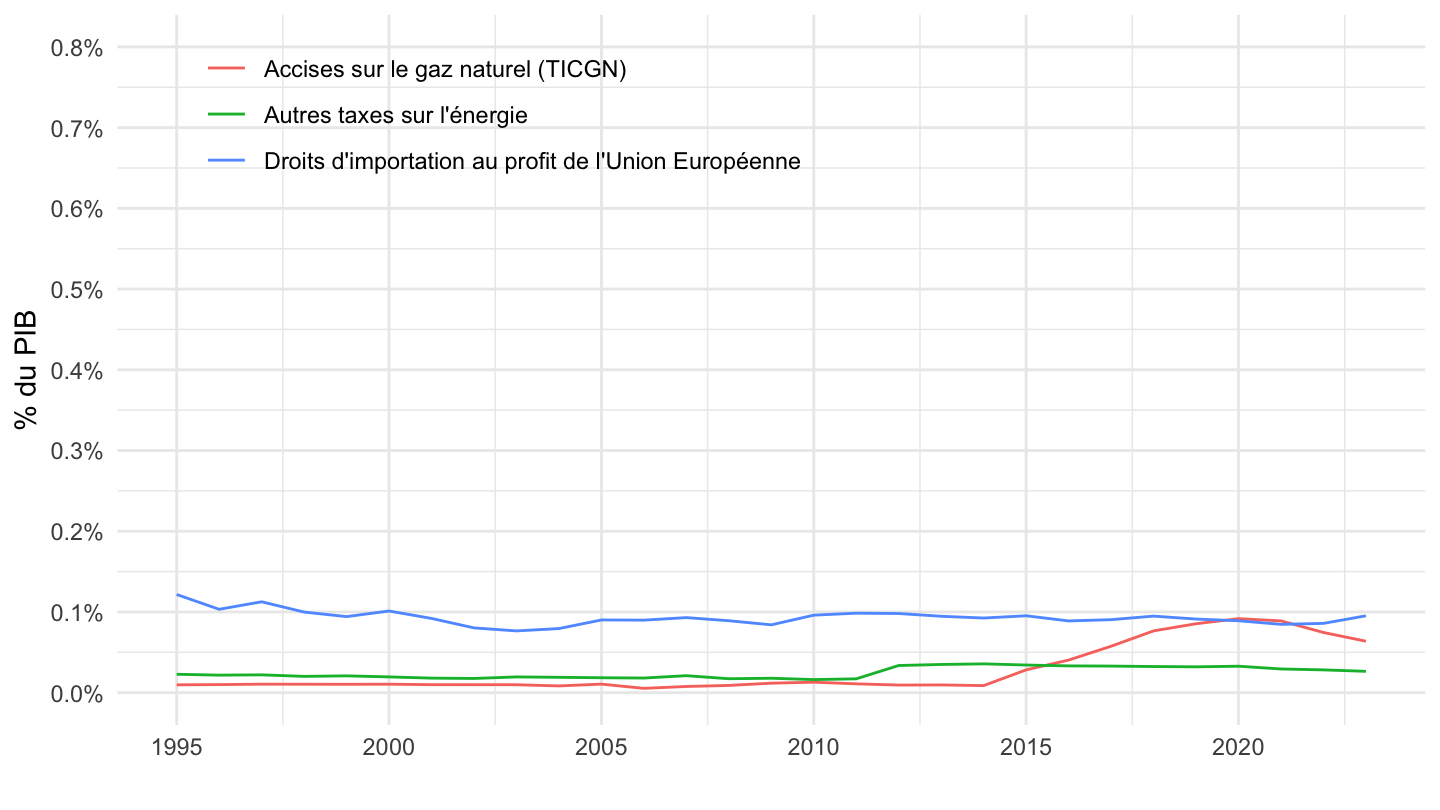
2000-
Code
T_3217 %>%
  filter(line %in% c(8, 9, 13, 6, 14)) %>%
  left_join(gdp, by = "year") %>%
  year_to_date2 %>%
  filter(date >= as.Date("2000-01-01")) %>%
  ggplot + geom_line(aes(x = date, y = value / gdp, color = Line)) +
  theme_minimal() + xlab("") + ylab("% du PIB") +
  scale_x_date(breaks = seq(1960, 2100, 2) %>% paste0("-01-01") %>% as.Date,
               labels = date_format("%Y")) +
  scale_y_continuous(breaks = 0.01*seq(0, 500, .1),
                labels = percent_format(accuracy = .1),
                limits = c(0, 0.008)) +
  theme(legend.position = c(0.3, 0.86),
        legend.title = element_blank())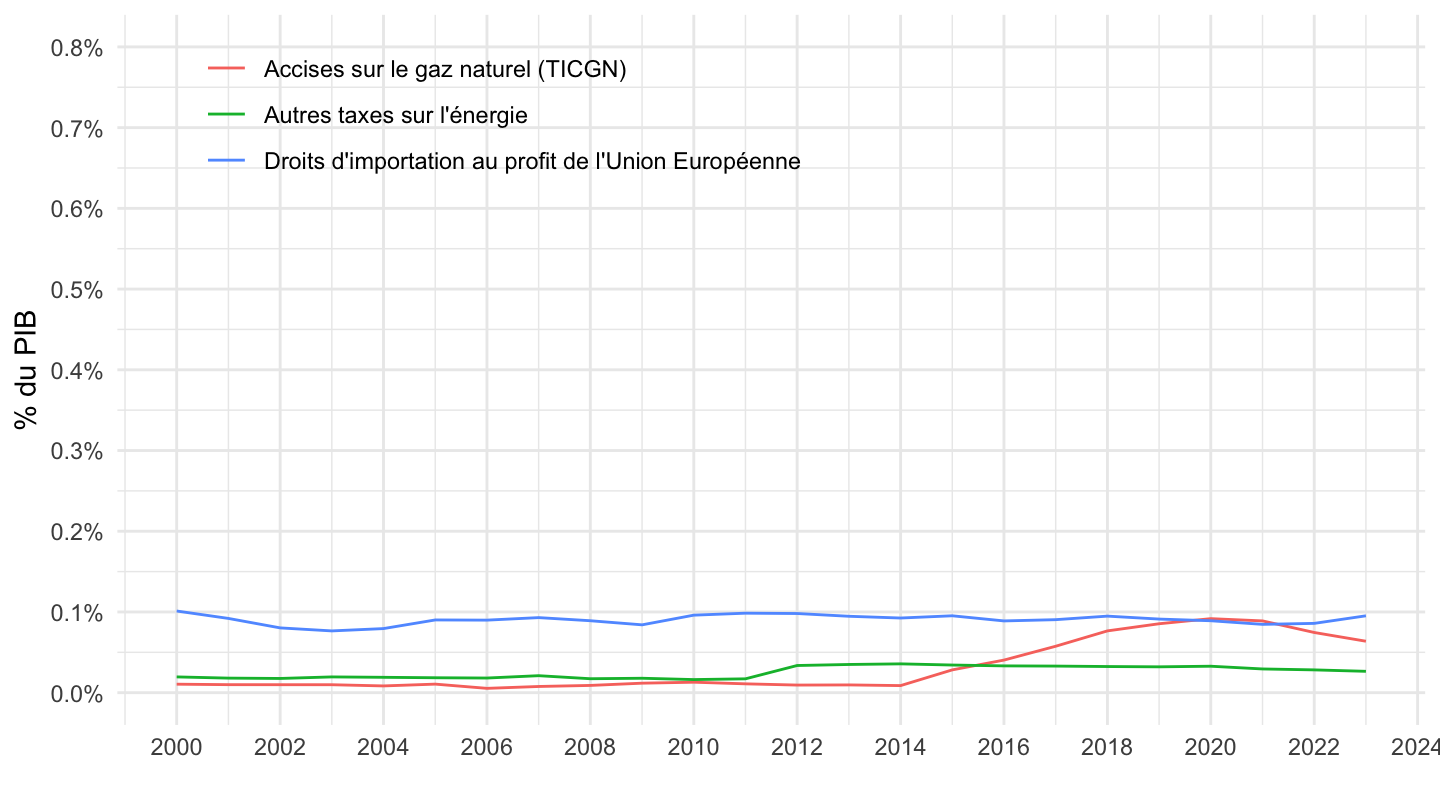
2007-
Code
T_3217 %>%
  filter(line %in% c(8, 9, 13, 6, 14)) %>%
  left_join(gdp, by = "year") %>%
  year_to_date2 %>%
  filter(date >= as.Date("2007-01-01")) %>%
  ggplot + geom_line(aes(x = date, y = value / gdp, color = Line)) +
  theme_minimal() + xlab("") + ylab("% du PIB") +
  scale_x_date(breaks = seq(1960, 2100, 1) %>% paste0("-01-01") %>% as.Date,
               labels = date_format("%Y")) +
  scale_y_continuous(breaks = 0.01*seq(0, 500, .1),
                labels = percent_format(accuracy = .1),
                limits = c(0, 0.008)) +
  theme(legend.position = c(0.3, 0.86),
        legend.title = element_blank())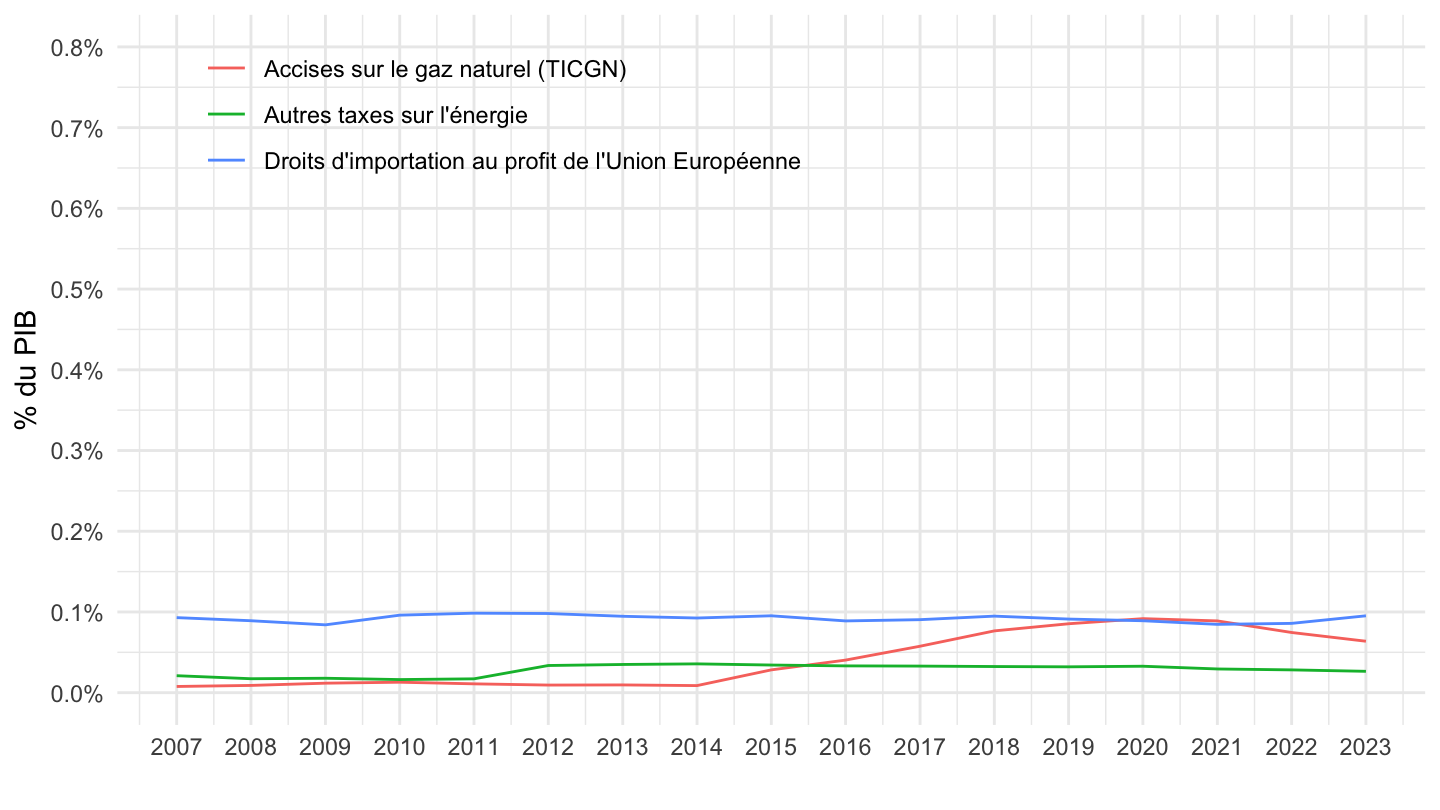
Somme
Code
T_3217 %>%
  filter(line %in% c(8, 9, 13, 6, 14)) %>%
  left_join(gdp, by = "year") %>%
  year_to_date2 %>%
  filter(date >= as.Date("2007-01-01")) %>%
  group_by(date) %>%
  summarise(value = sum(value),
            gdp = gdp[1]) %>%
  ggplot + geom_line(aes(x = date, y = value / gdp)) +
  theme_minimal() + xlab("") + ylab("% du PIB") +
  scale_x_date(breaks = seq(1960, 2100, 1) %>% paste0("-01-01") %>% as.Date,
               labels = date_format("%Y")) +
  scale_y_continuous(breaks = 0.01*seq(0, 500, .1),
                labels = percent_format(accuracy = .1)) +
  theme(legend.position = c(0.3, 0.86),
        legend.title = element_blank())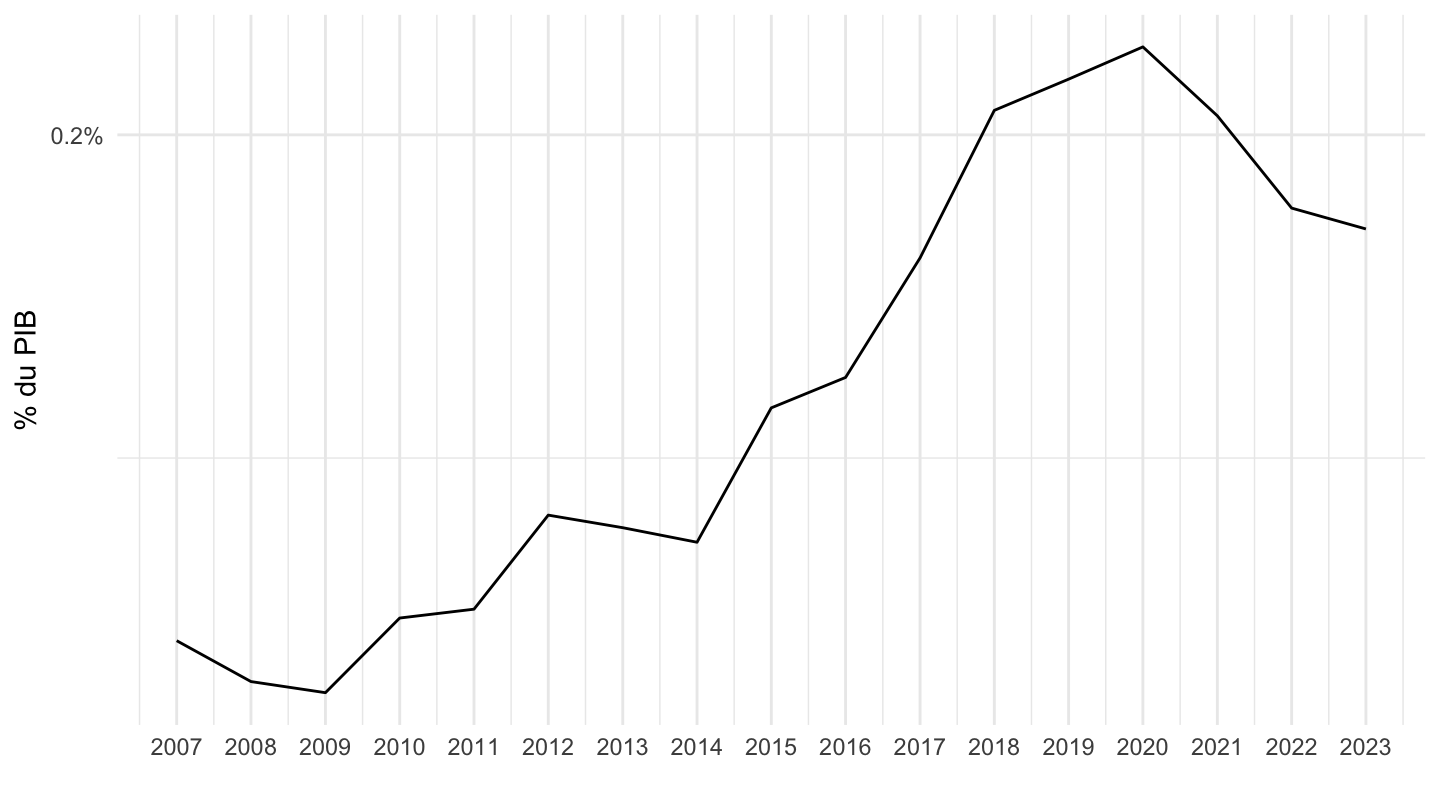
Petits impôts
Droits de mutation
Code
T_3217 %>%
  filter(line %in% c(91, 92, 93)) %>%
  left_join(gdp, by = "year") %>%
  year_to_date2 %>%
  ggplot + geom_line(aes(x = date, y = value / gdp, color = Line)) +
  theme_minimal() + xlab("") + ylab("% du PIB") +
  scale_x_date(breaks = seq(1960, 2100, 2) %>% paste0("-01-01") %>% as.Date,
               labels = date_format("%Y")) +
  scale_y_continuous(breaks = 0.01*seq(0, 500, .1),
                labels = percent_format(accuracy = .1)) +

  theme(legend.position = c(0.3, 0.9),
        legend.title = element_blank()) +
  geom_label(data = . %>%
               group_by(Line) %>%
               filter(date == max(date)), aes(x = date, y = value / gdp, label = paste0(round(value, 1), " Md"), color = Line))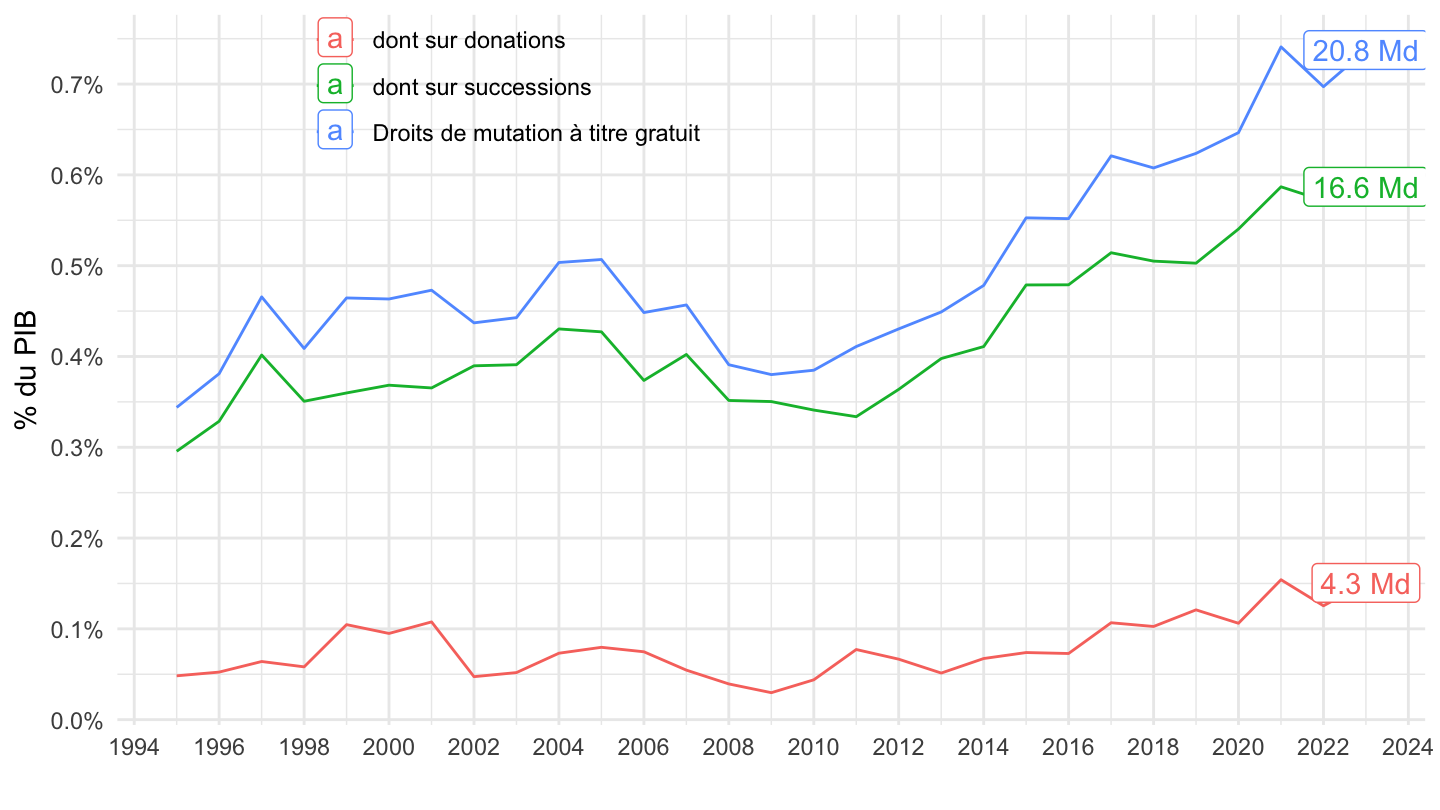
Droits d’enregistrement
Code
T_3217 %>%
  filter(line %in% c(17)) %>%
  left_join(gdp, by = "year") %>%
  year_to_date2 %>%
  ggplot + geom_line(aes(x = date, y = value / gdp, color = Line)) +
  theme_minimal() + xlab("") + ylab("Droits d'enregistrement (% du PIB)") +
  scale_x_date(breaks = seq(1960, 2100, 2) %>% paste0("-01-01") %>% as.Date,
               labels = date_format("%Y")) +
  scale_y_continuous(breaks = 0.01*seq(0, 500, 0.05),
                labels = percent_format(accuracy = .01)) +

  theme(legend.position = c(0.45, 0.85),
        legend.title = element_blank()) +
  geom_label(data = . %>%
               filter(date %in% c(max(date), as.Date("2021-01-01"))), aes(x = date, y = value / gdp, label = paste0(round(value, 1), " Md"), color = Line))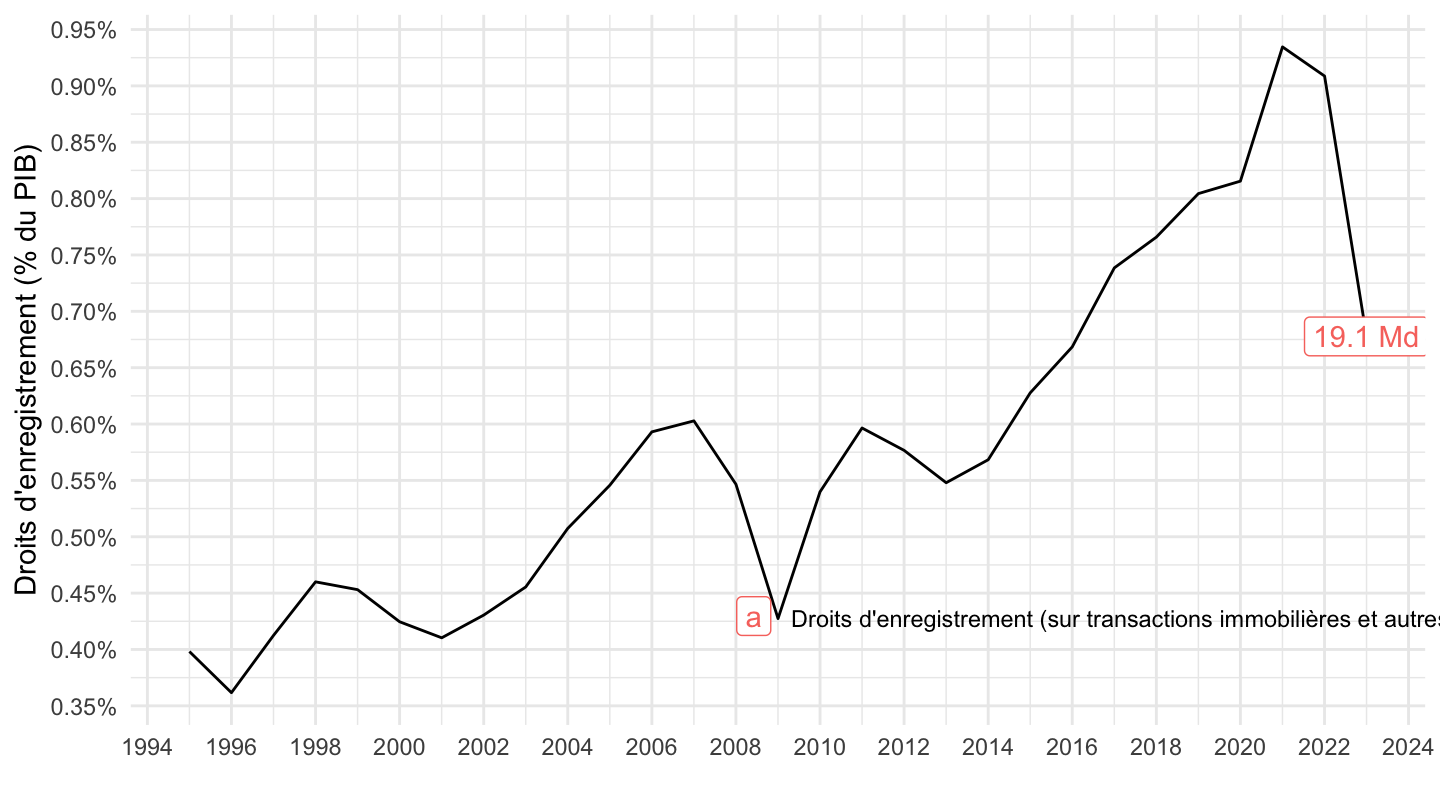
Taxe intérieure de consommation sur les produits énergétiques
Code
T_3217 %>%
  filter(line %in% c(11)) %>%
  left_join(gdp, by = "year") %>%
  year_to_date2 %>%
  ggplot + geom_line(aes(x = date, y = value / gdp)) +
  theme_minimal() + xlab("") + ylab("Taxe intérieure de conso sur les produits énergétiques\n(% du PIB)") +
  scale_x_date(breaks = seq(1960, 2100, 2) %>% paste0("-01-01") %>% as.Date,
               labels = date_format("%Y")) +
  scale_y_continuous(breaks = 0.01*seq(0, 500, 0.05),
                labels = percent_format(accuracy = .01)) +

  theme(legend.position = c(0.75, 0.15),
        legend.title = element_blank()) +
  geom_label(data = . %>%
               group_by(Line) %>%
               filter(date == max(date)), aes(x = date, y = value / gdp, label = paste0(round(value, 1), " Md"), color = Line))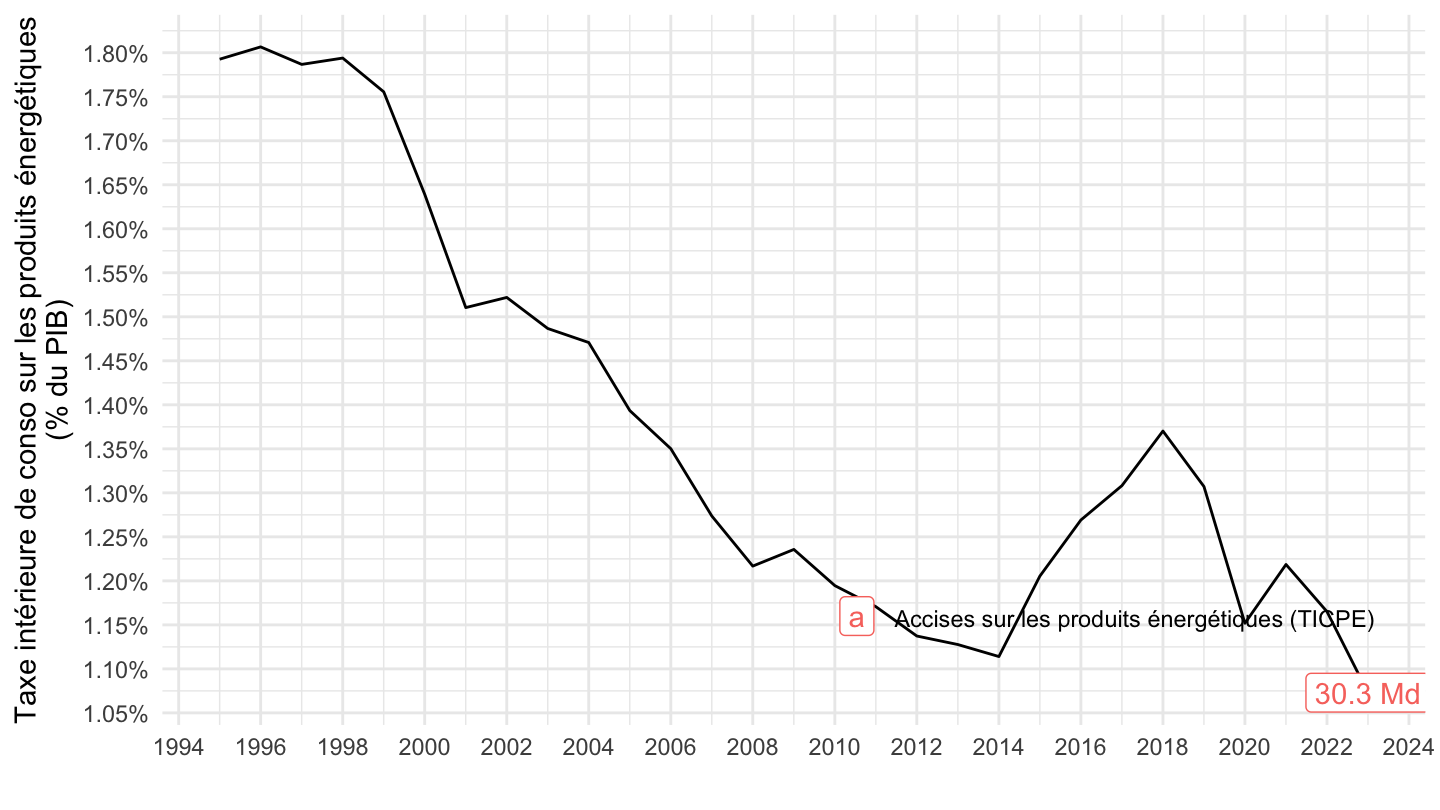
Taxe foncière
Code
T_3217 %>%
  filter(line %in% c(51, 52, 53)) %>%
  left_join(gdp, by = "year") %>%
  year_to_date2 %>%
  mutate(Line = gsub("Taxe foncière", " Taxe foncière", Line)) %>%
  ggplot + geom_line(aes(x = date, y = value / gdp, color = Line)) +
  theme_minimal() + xlab("") + ylab("Taxe foncière (% du PIB)") +
  scale_x_date(breaks = seq(1960, 2100, 2) %>% paste0("-01-01") %>% as.Date,
               labels = date_format("%Y")) +
  scale_y_continuous(breaks = 0.01*seq(0, 500, 0.1),
                labels = percent_format(accuracy = .1)) +
  theme(legend.position = c(0.3, 0.9),
        legend.title = element_blank()) +
  geom_label(data = . %>%
               group_by(Line) %>%
               filter(date == max(date)), aes(x = date, y = value / gdp, label = paste0(round(value, 1), " Md"), color = Line))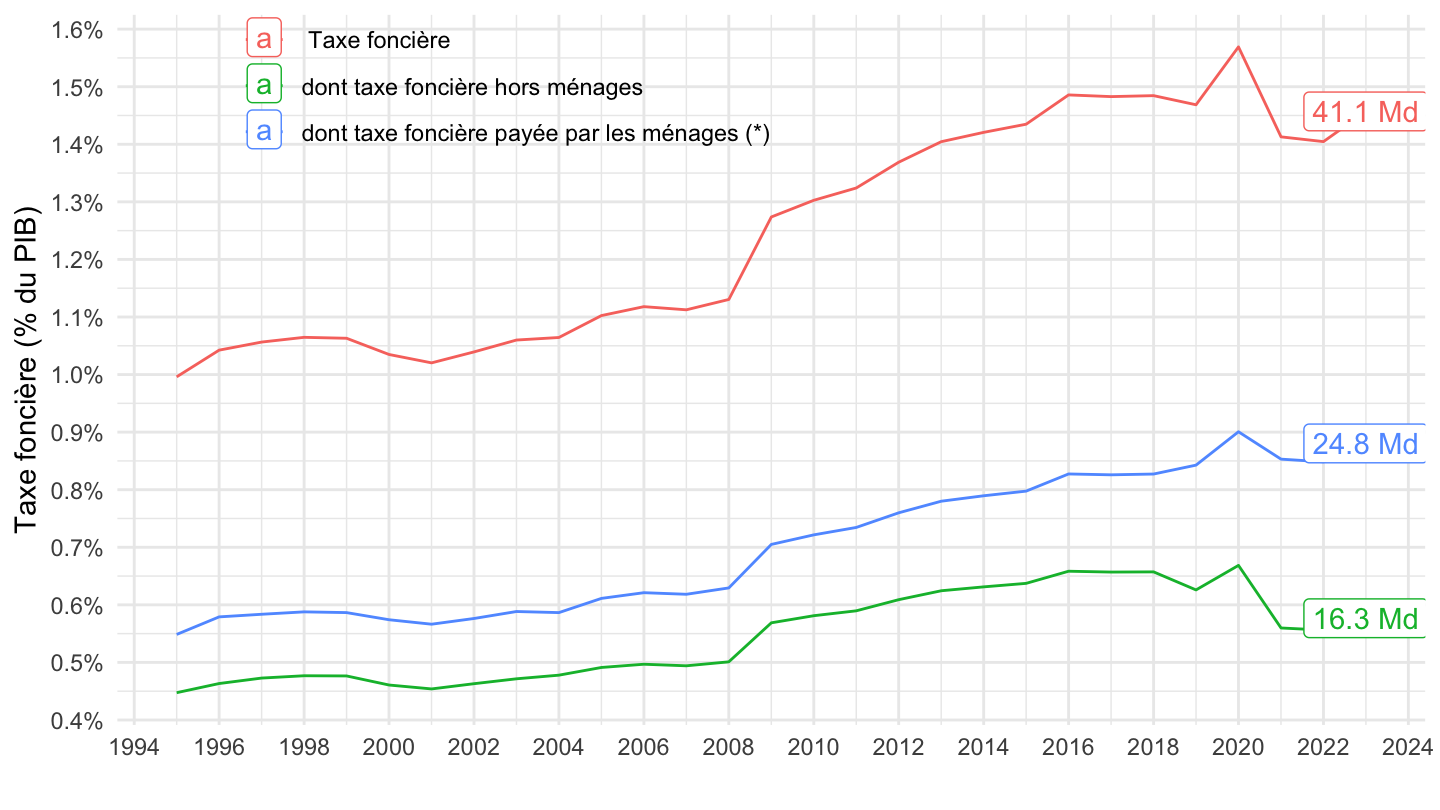
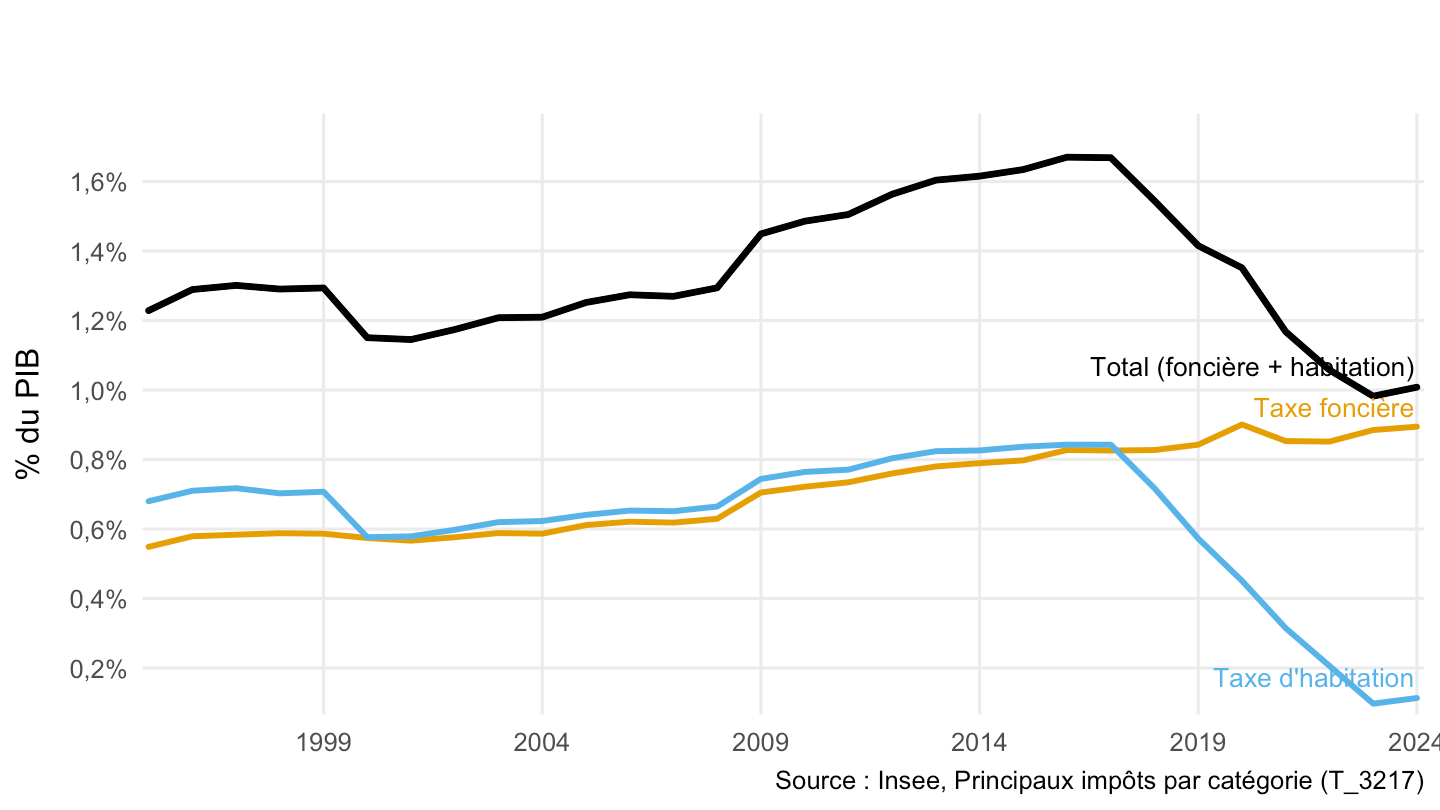
Taxe foncière, taxe habitation
Code
library(dplyr)
library(tidyr)
library(ggplot2)
library(scales)
library(ggrepel)  # install.packages("ggrepel") si besoin

# Palette Okabe-Ito (daltonien-friendly)
pal <- c(
  "Taxe foncière" = "#E69F00",
  "Taxe d'habitation"                   = "#56B4E9",
  "Total (foncière + habitation)"       = "#000000"  # total en noir
)

df_plot <-
  T_3217 %>%
  filter(grepl("foncière payée par les ménages", Line) |
           grepl("habitation", Line)) %>%
  mutate(Line = ifelse(grepl("foncière", Line),
                       "Taxe foncière",
                       "Taxe d'habitation")) %>%
  select(-line) %>%
  pivot_wider(names_from = Line, values_from = value) %>%
  mutate(`Total (foncière + habitation)` =
           `Taxe foncière` + `Taxe d'habitation`) %>%
  pivot_longer(cols = -year, names_to = "Line", values_to = "value") %>%
  left_join(gdp, by = "year") %>%
  year_to_date2() %>%
  mutate(share_gdp = value / gdp) %>%
  # On impose l'ordre d'affichage/couleurs
  mutate(Line = factor(Line,
                       levels = c("Taxe foncière",
                                  "Taxe d'habitation",
                                  "Total (foncière + habitation)")))

# Points de fin pour l’étiquetage direct
end_labels <-
  df_plot %>%
  group_by(Line) %>%
  slice_max(date, n = 1, with_ties = FALSE) %>%
  ungroup() %>%
  mutate(
    label_val = paste0(
      label_number(accuracy = 0.1, big.mark = " ", decimal.mark = ",")(value),
      " Md€"
    )
  )

ggplot(df_plot, aes(x = date, y = share_gdp, color = Line)) +
  geom_line(size = 1.05, lineend = "round") +
  # Style différent pour le total
  geom_line(
    data = ~ dplyr::filter(.x, Line == "Total (foncière + habitation)"),
    size = 1.2, lineend = "round"
  ) +
  # étiquettes en bout de ligne (remplace la légende)
  geom_text_repel(
    data = end_labels,
    aes(label = paste0(Line)),
    show.legend = FALSE,
    size = 3.5,
    label.size = 0,
    label.padding = unit(0.2, "lines"),
    max.overlaps = 50,
    direction = "y",
    nudge_x = 60,  # pousse légèrement à droite
    seed = 62
  ) +
  scale_color_manual(values = pal, guide = "none") +
  scale_y_continuous(
    labels = label_percent(accuracy = 0.1, decimal.mark = ","),
    breaks = 0.01*seq(0, 3, 0.2),
    expand  = expansion(mult = c(0.02, 0.08))  # de l’air en haut et à droite
  ) +
  scale_x_date(
    date_breaks = "5 years",
    date_labels = "%Y",
    expand = expansion(mult = c(0.005, 0))  # marge à droite pour les labels
  ) +
  labs(
    title = "",
    subtitle = "",
    x = NULL, y = "% du PIB",
    caption = "Source : Insee, Principaux impôts par catégorie (T_3217)"
  ) +
  theme_minimal(base_size = 12) +
  theme(
    plot.title      = element_text(face = "bold"),
    plot.subtitle   = element_text(margin = margin(b = 6)),
    axis.title.y    = element_text(margin = margin(r = 8)),
    axis.text.x     = element_text(angle = 0, vjust = 0.5),
    panel.grid.minor= element_blank()
  )