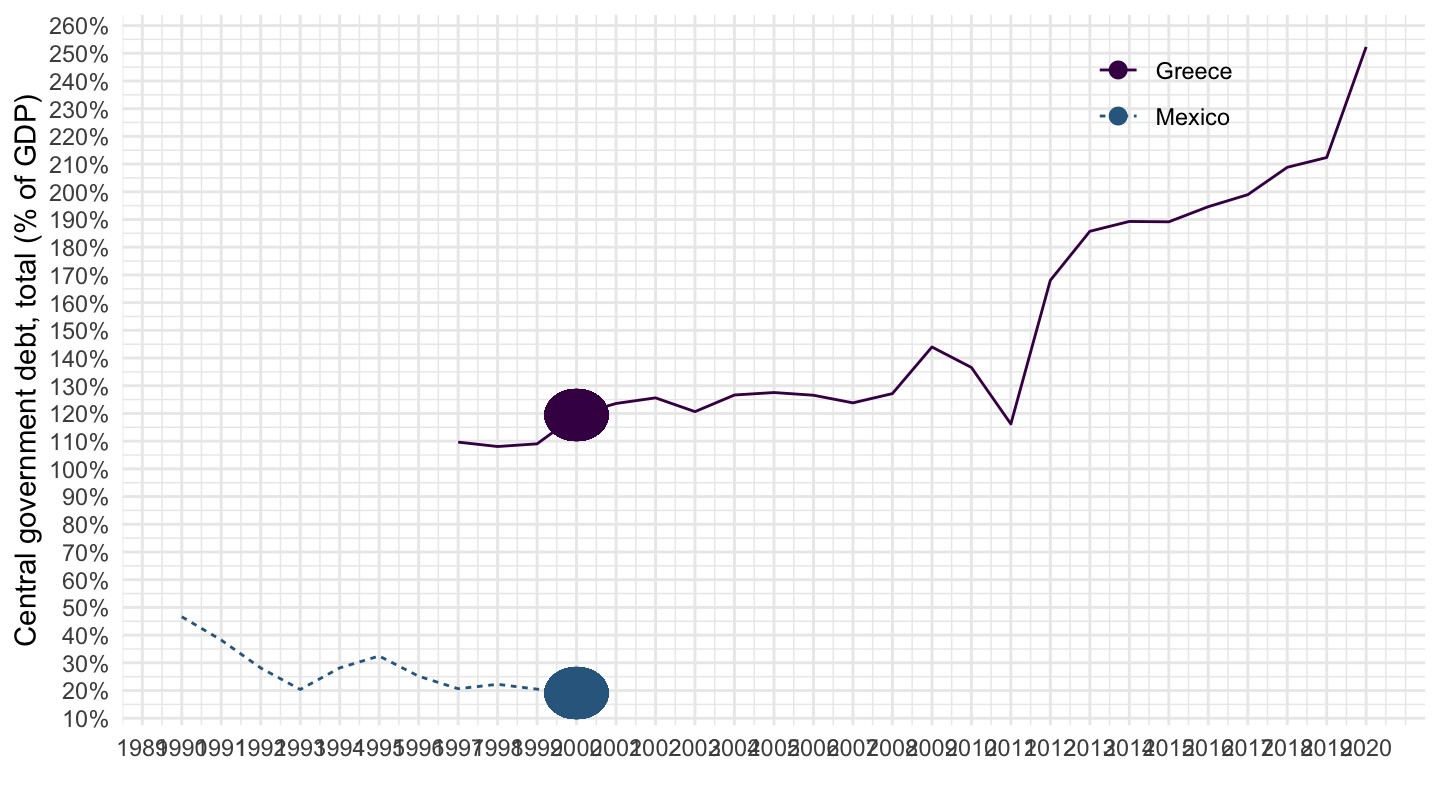
Central government debt, total (% of GDP)
Data - WDI
François Geerolf
Info
LAST_DOWNLOAD
public_debt %>%
  arrange(-(dataset == "GC.DOD.TOTL.GD.ZS")) %>%
  mutate(Title = read_lines(paste0("~/Dropbox/website/data/", source, "/",dataset, ".Rmd"), skip = 1, n_max = 1) %>% gsub("title: ", "", .) %>% gsub("\"", "", .)) %>%
  mutate(Download = as.Date(file.info(paste0("~/Dropbox/website/data/", source, "/", dataset, ".RData"))$mtime),
         Compile = as.Date(file.info(paste0("~/Dropbox/website/data/", source, "/", dataset, ".html"))$mtime)) %>%
  mutate(Compile = paste0("[", Compile, "](https://fgeerolf.com/data/", source, "/", dataset, '.html)')) %>%
print_table_conditional_20()| source | dataset | Title | Download | Compile |
|---|---|---|---|---|
| wdi | GC.DOD.TOTL.GD.ZS | Central government debt, total (% of GDP) | 2023-03-29 | 2023-03-30 |
| eurostat | ei_mfir_m | Interest rates - monthly data | 2023-06-05 | 2023-06-05 |
| eurostat | gov_10q_ggdebt | Quarterly government debt | 2023-06-03 | 2023-06-01 |
| fred | r | Interest Rates | 2023-06-05 | 2023-06-05 |
| gfd | debt | Debt | 2021-03-01 | 2021-08-22 |
| imf | FM | Fiscal Monitor | 2020-03-13 | 2023-03-29 |
| imf | GGXCNL_G01_GDP_PT | Net lending/borrowing (also referred as overall balance) (% of GDP) | 2023-06-03 | 2023-06-01 |
| imf | GGXONLB_G01_GDP_PT | Primary net lending/borrowing (also referred as primary balance) (% of GDP) | 2023-06-03 | 2023-06-03 |
| imf | GGXWDN_G01_GDP_PT | Net debt (% of GDP) | 2021-04-01 | 2023-04-01 |
| imf | HPDD | Historical Public Debt Database | NA | 2023-03-24 |
| wdi | GC.XPN.INTP.CN | Interest payments (current LCU) | 2023-03-30 | 2023-04-30 |
| wdi | GC.XPN.INTP.RV.ZS | Interest payments (% of revenue) | 2020-05-09 | 2023-03-30 |
| wdi | GC.XPN.INTP.ZS | Interest payments (% of expense) | 2020-05-09 | 2023-03-30 |
LAST_COMPILE
| LAST_COMPILE |
|---|
| 2023-06-18 |
Nobs - Javascript
GC.DOD.TOTL.GD.ZS %>%
  left_join(iso2c, by = "iso2c") %>%
  group_by(iso2c, Iso2c) %>%
  mutate(value = round(value, 2)) %>%
  summarise(Nobs = n(),
            `Year 1` = first(year),
            `HH Consumption 1 (%)` = first(value),
            `Year 2` = last(year),
            `HH Consumption 2 (%)` = last(value)) %>%
  arrange(-Nobs) %>%
  {if (is_html_output()) datatable(., filter = 'top', rownames = F) else .}
Japan, Switzerland
GC.DOD.TOTL.GD.ZS %>%
  filter(iso2c %in% c("JP", "CH")) %>%
  left_join(iso2c, by = "iso2c") %>%
  year_to_date %>%
  mutate(value = value/100) %>%
  ggplot(.) + theme_minimal() + add_2flags +
  geom_line(aes(x = date, y = value, color = Iso2c, linetype = Iso2c)) +
  xlab("") + ylab("Central government debt, total (% of GDP)") +
  scale_color_manual(values = viridis(4)[1:3]) +
  theme(legend.title = element_blank(),
        legend.position = c(0.8, 0.9)) +
  scale_x_date(breaks = seq(1950, 2020, 5) %>% paste0("-01-01") %>% as.Date,
               labels = date_format("%Y")) +
  scale_y_continuous(breaks = 0.01*seq(-60, 400, 20),
                     labels = scales::percent_format(accuracy = 1))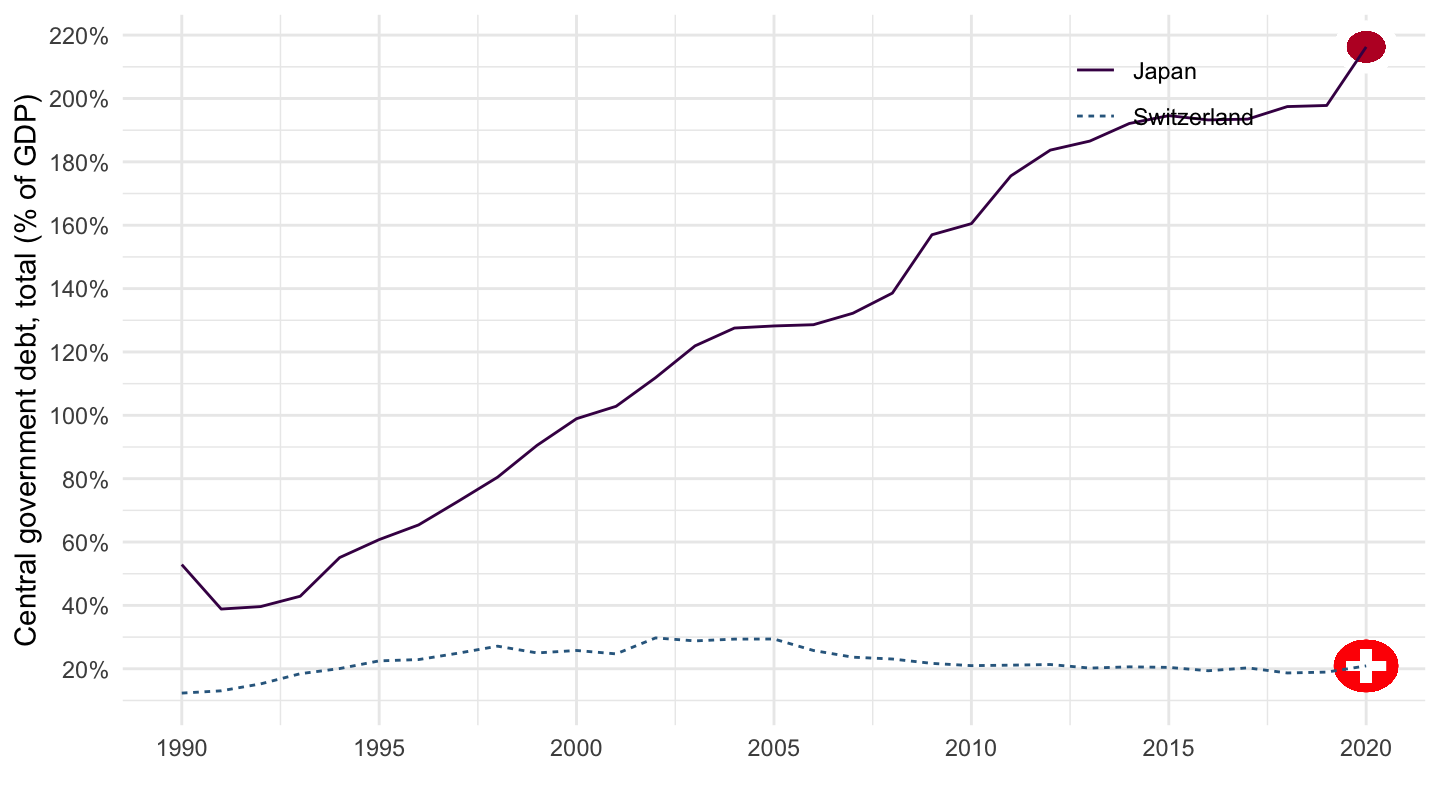
China, United States
GC.DOD.TOTL.GD.ZS %>%
  filter(iso2c %in% c("EU", "US", "FR", "IT")) %>%
  left_join(iso2c, by = "iso2c") %>%
  year_to_date %>%
  mutate(value = value/100) %>%
  ggplot(.) + theme_minimal() + add_2flags +
  geom_line(aes(x = date, y = value, color = Iso2c, linetype = Iso2c)) +
  xlab("") + ylab("Central government debt, total (% of GDP)") +
  scale_color_manual(values = viridis(5)[1:4]) +
  theme(legend.title = element_blank(),
        legend.position = c(0.2, 0.9)) +
  scale_x_date(breaks = seq(1950, 2020, 5) %>% paste0("-01-01") %>% as.Date,
               labels = date_format("%Y")) +
  scale_y_continuous(breaks = 0.01*seq(-60, 400, 20),
                     labels = scales::percent_format(accuracy = 1))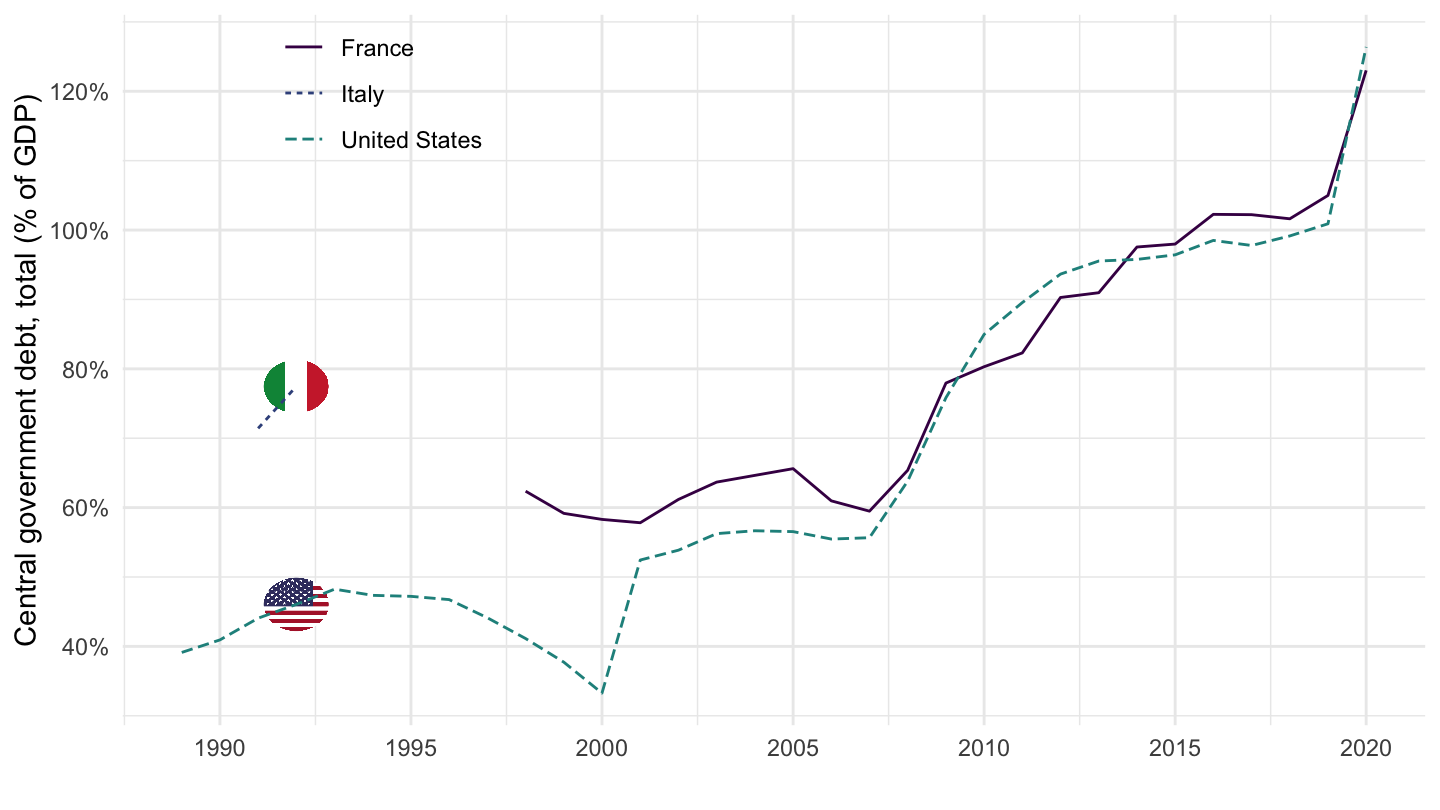
China, France, Germany
GC.DOD.TOTL.GD.ZS %>%
  filter(iso2c %in% c("CN", "FR", "DE")) %>%
  left_join(iso2c, by = "iso2c") %>%
  year_to_date %>%
  mutate(value = value/100) %>%
  ggplot(.) + theme_minimal() + add_2flags +
  geom_line(aes(x = date, y = value, color = Iso2c, linetype = Iso2c)) +
  xlab("") + ylab("Central government debt, total (% of GDP)") +
  scale_color_manual(values = viridis(4)[1:3]) +
  theme(legend.title = element_blank(),
        legend.position = c(0.15, 0.9)) +
  scale_x_date(breaks = seq(1950, 2020, 5) %>% paste0("-01-01") %>% as.Date,
               labels = date_format("%Y")) +
  scale_y_continuous(breaks = 0.01*seq(-60, 400, 10),
                     labels = scales::percent_format(accuracy = 1))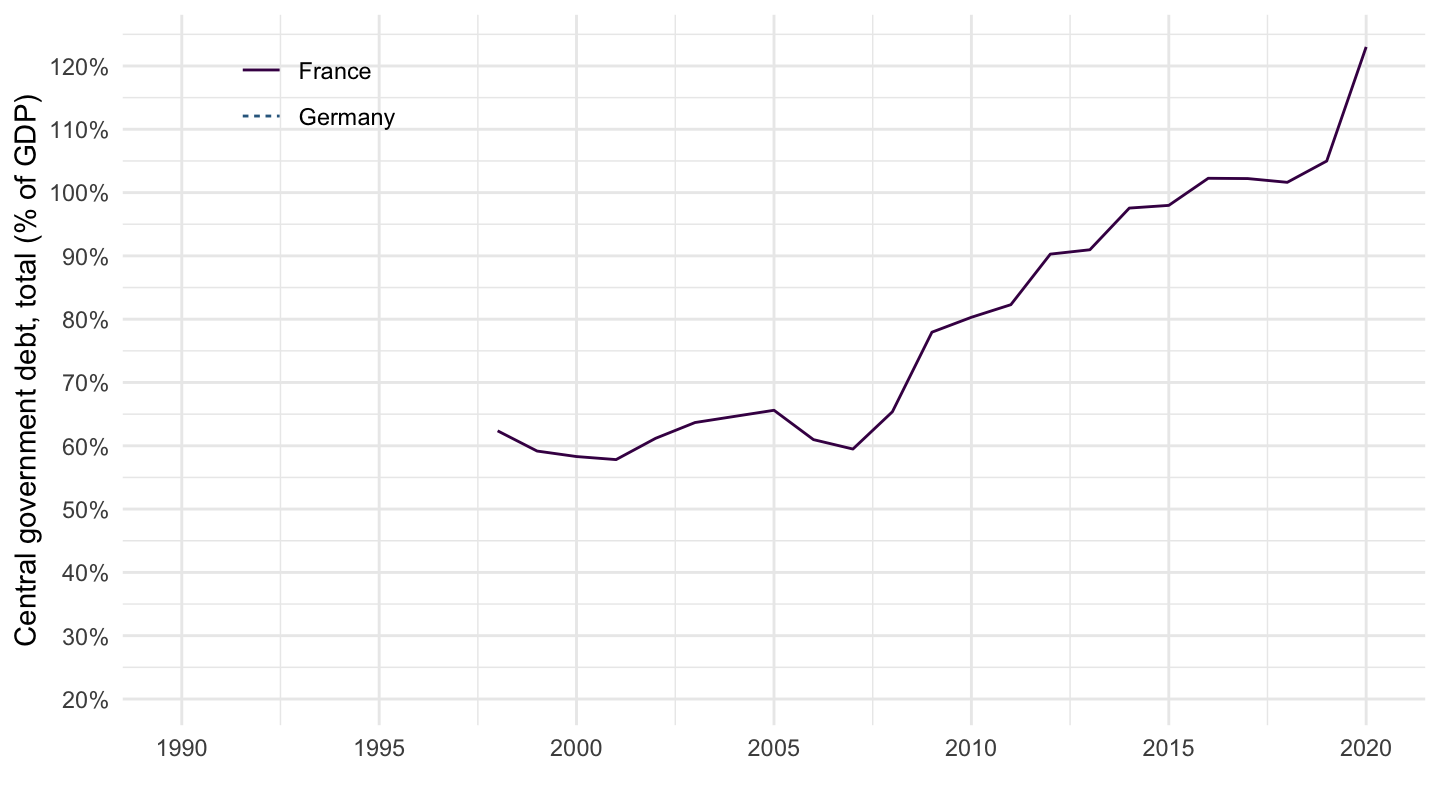
Spain, United Kingdom, United States
GC.DOD.TOTL.GD.ZS %>%
  filter(iso2c %in% c("US", "GB", "ES")) %>%
  left_join(iso2c, by = "iso2c") %>%
  year_to_date %>%
  mutate(value = value/100) %>%
  ggplot(.) + theme_minimal() + add_3flags +
  geom_line(aes(x = date, y = value, color = Iso2c, linetype = Iso2c)) +
  xlab("") + ylab("Central government debt, total (% of GDP)") +
  scale_color_manual(values = viridis(4)[1:3]) +
  theme(legend.title = element_blank(),
        legend.position = c(0.4, 0.9)) +
  scale_x_date(breaks = seq(1950, 2020, 5) %>% paste0("-01-01") %>% as.Date,
               labels = date_format("%Y")) +
  scale_y_continuous(breaks = 0.01*seq(-60, 400, 20),
                     labels = scales::percent_format(accuracy = 1))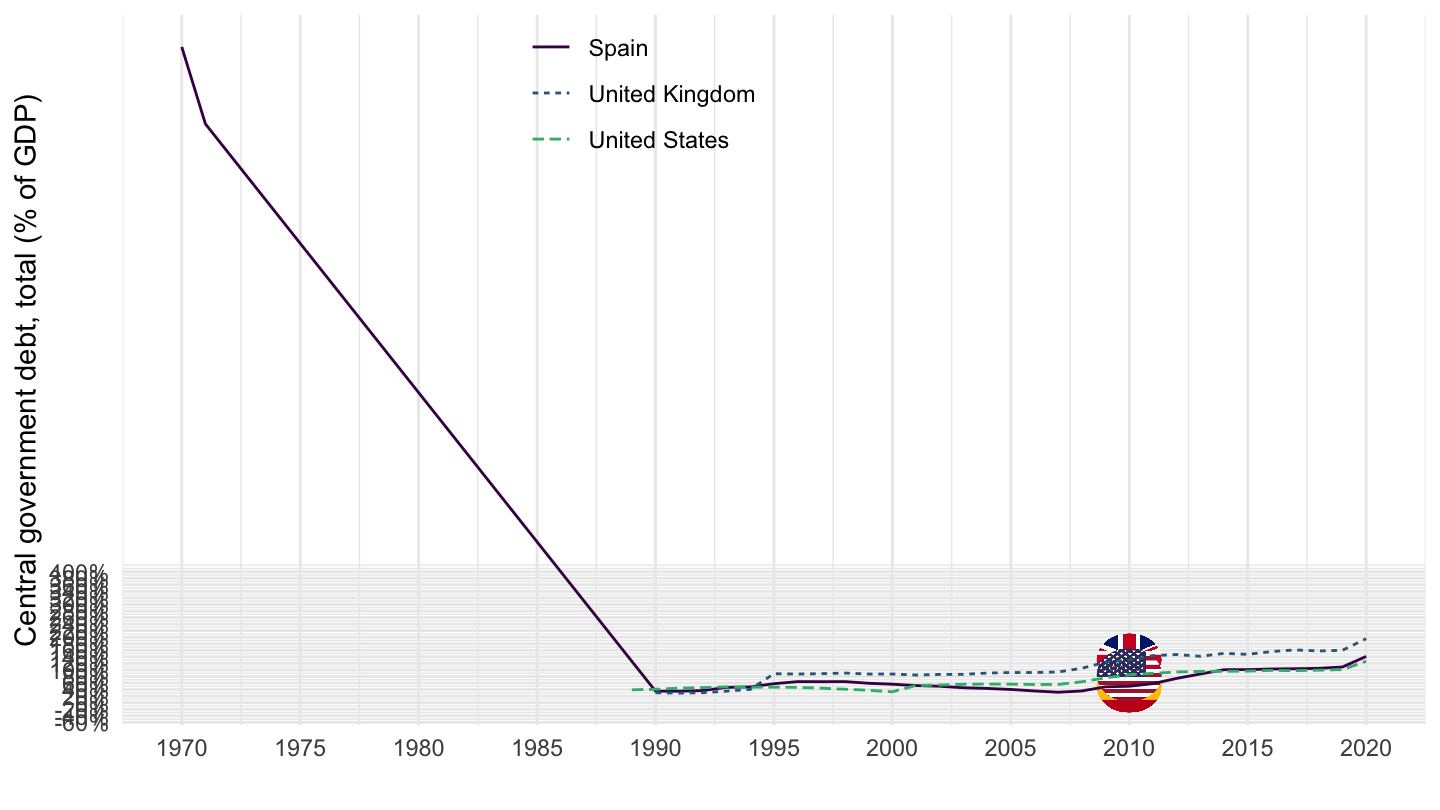
Greece, Hong Kong, Mexico
GC.DOD.TOTL.GD.ZS %>%
  filter(iso2c %in% c("GR", "HK", "MX")) %>%
  left_join(iso2c, by = "iso2c") %>%
  year_to_date %>%
  mutate(value = value/100) %>%
  ggplot(.) + theme_minimal() + geom_line() + add_2flags +
  aes(x = date, y = value, color = Iso2c, linetype = Iso2c) +
  xlab("") + ylab("Central government debt, total (% of GDP)") +
  scale_color_manual(values = viridis(4)[1:3]) +
  theme(legend.title = element_blank(),
        legend.position = c(0.8, 0.9)) +
  scale_x_date(breaks = seq(1950, 2020, 1) %>% paste0("-01-01") %>% as.Date,
               labels = date_format("%Y")) +
  scale_y_continuous(breaks = 0.01*seq(0, 2000, 10),
                     labels = scales::percent_format(accuracy = 1))