Residential Property Price Indices (RPPIs) and related housing indicators
Data - OECD
Info
Data on housing
| source | dataset | Title | .html | .rData |
|---|---|---|---|---|
| bdf | RPP | Prix de l'immobilier | 2026-07-24 | 2026-07-24 |
| bis | LONG_PP | Residential property prices - detailed series | 2026-07-25 | 2026-07-25 |
| bis | SELECTED_PP | Property prices, selected series | 2026-07-25 | 2026-07-25 |
| ecb | RPP | Residential Property Price Index Statistics | 2026-07-24 | 2026-07-24 |
| eurostat | ei_hppi_q | House price index (2015 = 100) - quarterly data | 2026-07-23 | 2026-07-23 |
| eurostat | hbs_str_t223 | Mean consumption expenditure by income quintile | 2025-10-11 | 2026-07-23 |
| eurostat | prc_hicp_midx | HICP (2015 = 100) - monthly data (index) | 2026-07-25 | 2026-07-23 |
| eurostat | prc_hpi_q | House price index (2015 = 100) - quarterly data | 2026-07-25 | 2026-07-23 |
| fred | housing | House Prices | 2026-07-24 | 2026-07-24 |
| insee | IPLA-IPLNA-2015 | Indices des prix des logements neufs et Indices Notaires-Insee des prix des logements anciens | 2026-07-24 | 2026-07-23 |
| oecd | SNA_TABLE5 | Final consumption expenditure of households | 2026-07-24 | 2023-10-19 |
| oecd | housing | NA | NA | NA |
SUBJECT
Code
HOUSING %>%
  left_join(HOUSING_var$SUBJECT %>%
              setNames(c("SUBJECT", "Subject")),  by = "SUBJECT") %>%
  group_by(SUBJECT, Subject) %>%
  summarise(Nobs = n()) %>%
  arrange(-Nobs) %>%
  {if (is_html_output()) datatable(., filter = 'top', rownames = F) else .}
MEASURE
Code
HOUSING %>%
  left_join(HOUSING_var$MEASURE %>%
              setNames(c("MEASURE", "Measure")),  by = "MEASURE") %>%
  group_by(MEASURE, Measure) %>%
  summarise(Nobs = n()) %>%
  arrange(-Nobs) %>%
{if (is_html_output()) print_table(.) else .}| MEASURE | Measure | Nobs |
|---|---|---|
| IXOB | Index | 132140 |
| GP | Percentage change from previous period | 88461 |
| GY | Percentage change on the same period of the previous year | 85775 |
| IXOBSA | Index, sa | 14691 |
| ST | Transaction | 4257 |
| AL | Per thousand of the National CPI Total | 3207 |
| GPSA | Percentage change from previous period, sa | 820 |
| GYSA | Percentage change on the same period of the previous year, sa | 786 |
GEO_COVERAGE
Code
HOUSING %>%
  left_join(HOUSING_var$GEO_COVERAGE %>%
              setNames(c("GEO_COVERAGE", "Geo_coverage")),  by = "GEO_COVERAGE") %>%
  group_by(GEO_COVERAGE, Geo_coverage) %>%
  summarise(Nobs = n()) %>%
  arrange(-Nobs) %>%
{if (is_html_output()) print_table(.) else .}| GEO_COVERAGE | Geo_coverage | Nobs |
|---|---|---|
| CN | Whole country | 312004 |
| CY | Capital/main city | 15503 |
| UA | Urban areas | 2630 |
FREQUENCY
Code
HOUSING %>%
  left_join(HOUSING_var$FREQUENCY %>%
              setNames(c("FREQUENCY", "Frequency")),  by = "FREQUENCY") %>%
  group_by(FREQUENCY, Frequency) %>%
  summarise(Nobs = n()) %>%
  arrange(-Nobs) %>%
{if (is_html_output()) print_table(.) else .}| FREQUENCY | Frequency | Nobs |
|---|---|---|
| M | Monthly | 197912 |
| Q | Quarterly | 103284 |
| A | Annual | 28941 |
LOCATION
Code
HOUSING %>%
  left_join(HOUSING_var$LOCATION %>%
              setNames(c("LOCATION", "Location")),  by = "LOCATION") %>%
  group_by(LOCATION, Location) %>%
  summarise(Nobs = n()) %>%
  arrange(-Nobs) %>%
  {if (is_html_output()) datatable(., filter = 'top', rownames = F) else .}
France, United States, Germany, Japan
CPI: 04.1 - Actual rentals for housing - CP040100
Code
HOUSING %>%
  filter(LOCATION %in% c("FRA", "USA", "DEU", "JPN"),
         SUBJECT == "CP040100",
         FREQUENCY == "Q",
         MEASURE == "IXOB") %>%
  quarter_to_enddate %>%
  left_join(HOUSING_var$LOCATION %>%
              setNames(c("LOCATION", "Location")), by = "LOCATION") %>%
  ggplot(.) + geom_line() +
  aes(x = date, y = obsValue, color = Location, linetype = Location) +
  theme_minimal() + xlab("") + ylab("CPI: 04.1 - Actual rentals") +
  scale_x_date(breaks = seq(1960, 2100, 5) %>% paste0("-01-01") %>% as.Date,
               labels = date_format("%Y")) +
  scale_y_log10(breaks = seq(0, 200, 10)) +
  scale_color_manual(values = viridis(5)[1:4]) +
  theme(legend.position = c(0.8, 0.20),
        legend.title = element_blank())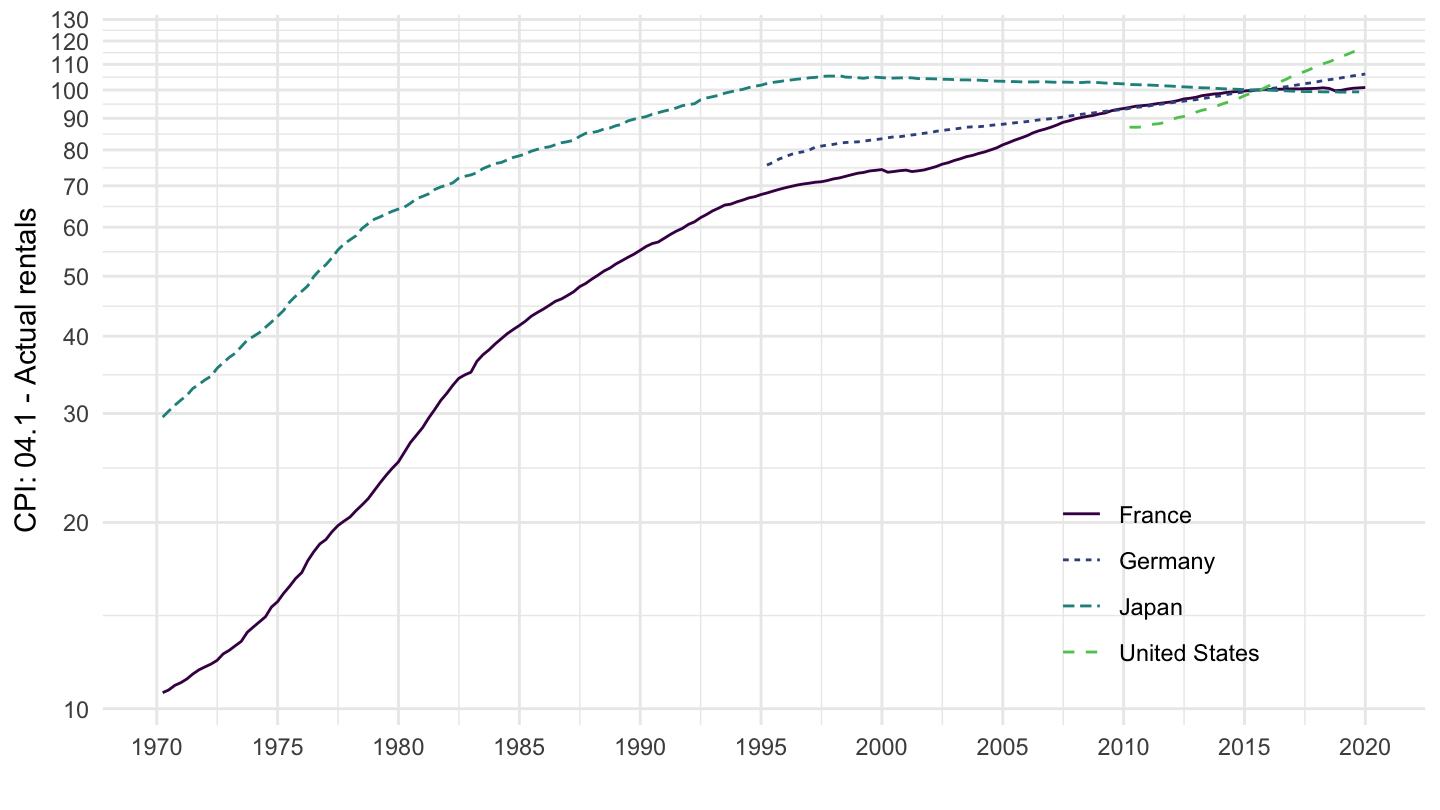
CPI: 04.2 - Imputed rentals for housing - CP040200
Code
HOUSING %>%
  filter(LOCATION %in% c("FRA", "USA", "DEU", "JPN"),
         SUBJECT == "CP040200",
         FREQUENCY == "Q",
         MEASURE == "IXOB") %>%
  quarter_to_enddate %>%
  left_join(HOUSING_var$LOCATION %>%
              setNames(c("LOCATION", "Location")), by = "LOCATION") %>%
  ggplot(.) + geom_line() +
  aes(x = date, y = obsValue, color = Location, linetype = Location) +
  theme_minimal() + xlab("") + ylab("CPI: 04.2 - Imputed rentals") +
  scale_x_date(breaks = seq(1960, 2100, 5) %>% paste0("-01-01") %>% as.Date,
               labels = date_format("%Y")) +
  scale_y_log10(breaks = seq(0, 200, 10)) +
  scale_color_manual(values = viridis(5)[1:4]) +
  theme(legend.position = c(0.8, 0.20),
        legend.title = element_blank())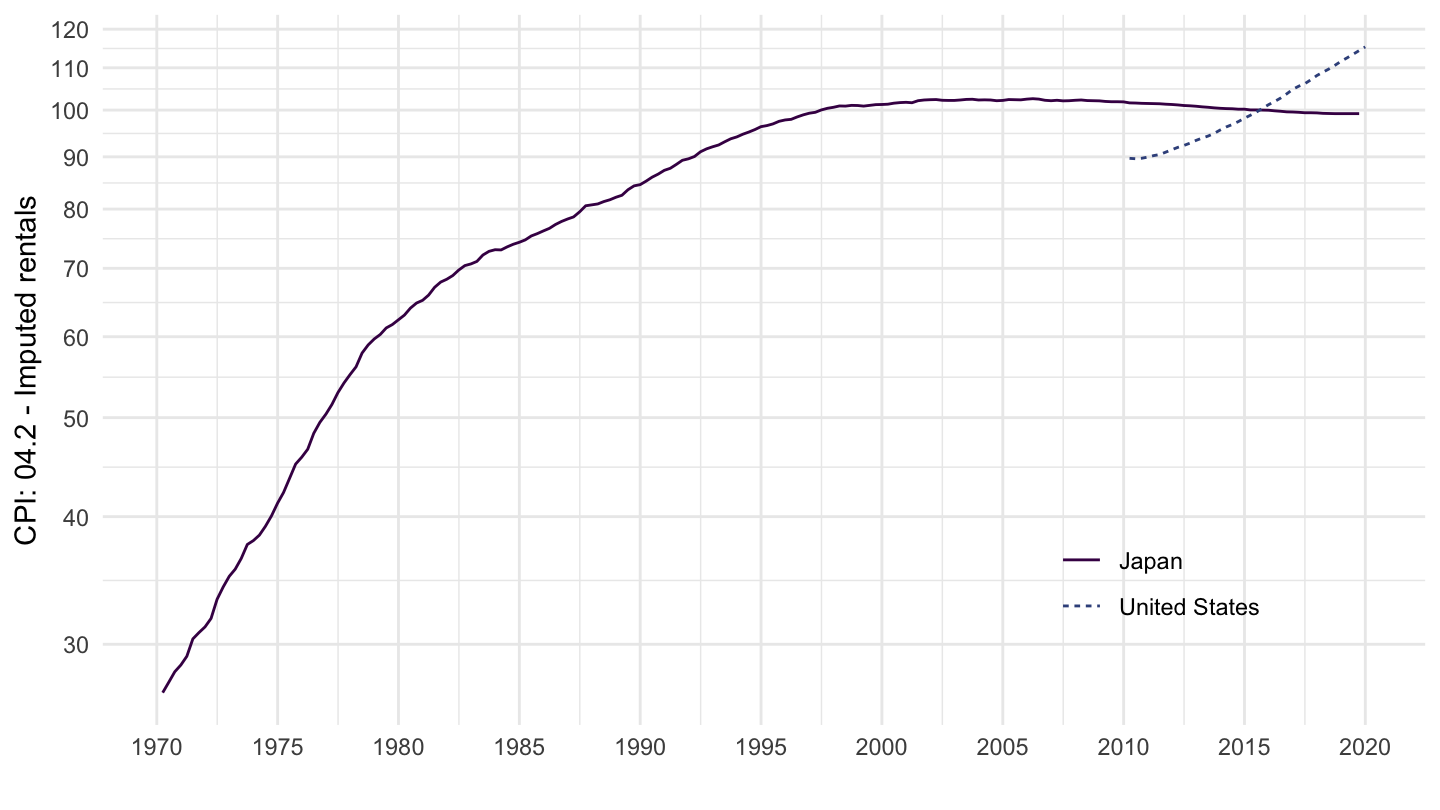
CPI: Housing (04.1, 04.2, 04.3) - CPGRHO01
Code
HOUSING %>%
  filter(LOCATION %in% c("FRA", "USA", "DEU", "JPN"),
         SUBJECT == "CPGRHO01",
         FREQUENCY == "Q",
         MEASURE == "IXOB") %>%
  quarter_to_enddate %>%
  left_join(HOUSING_var$LOCATION %>%
              setNames(c("LOCATION", "Location")), by = "LOCATION") %>%
  ggplot(.) + geom_line() +
  aes(x = date, y = obsValue, color = Location, linetype = Location) +
  theme_minimal() + xlab("") + ylab("CPI: Housing (04.1, 04.2, 04.3)") +
  scale_x_date(breaks = seq(1960, 2100, 5) %>% paste0("-01-01") %>% as.Date,
               labels = date_format("%Y")) +
  scale_y_log10(breaks = seq(0, 200, 10)) +
  scale_color_manual(values = viridis(5)[1:4]) +
  theme(legend.position = c(0.8, 0.20),
        legend.title = element_blank())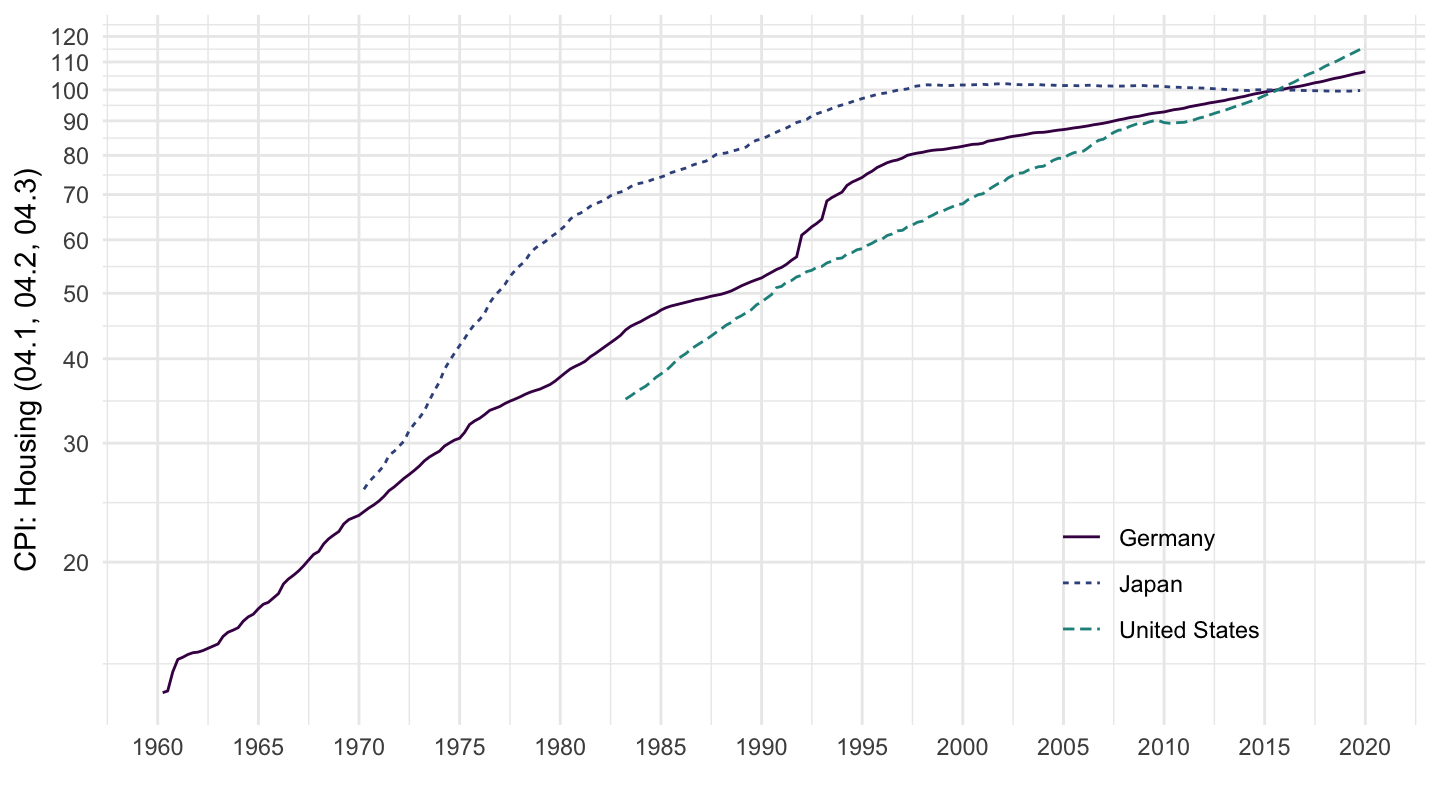
CPI: Housing excluding imputed rentals for housing (04.1, 04.3) - CPGRHO02
Code
HOUSING %>%
  filter(LOCATION %in% c("FRA", "USA", "DEU", "JPN"),
         SUBJECT == "CPGRHO02",
         FREQUENCY == "Q",
         MEASURE == "IXOB") %>%
  quarter_to_enddate %>%
  left_join(HOUSING_var$LOCATION %>%
              setNames(c("LOCATION", "Location")), by = "LOCATION") %>%
  ggplot(.) + geom_line() +
  aes(x = date, y = obsValue, color = Location, linetype = Location) +
  theme_minimal() + xlab("") + ylab("CPI: Housing (04.1, 04.2, 04.3)") +
  scale_x_date(breaks = seq(1960, 2100, 5) %>% paste0("-01-01") %>% as.Date,
               labels = date_format("%Y")) +
  scale_y_log10(breaks = seq(0, 200, 10)) +
  scale_color_manual(values = viridis(5)[1:4]) +
  theme(legend.position = c(0.8, 0.20),
        legend.title = element_blank())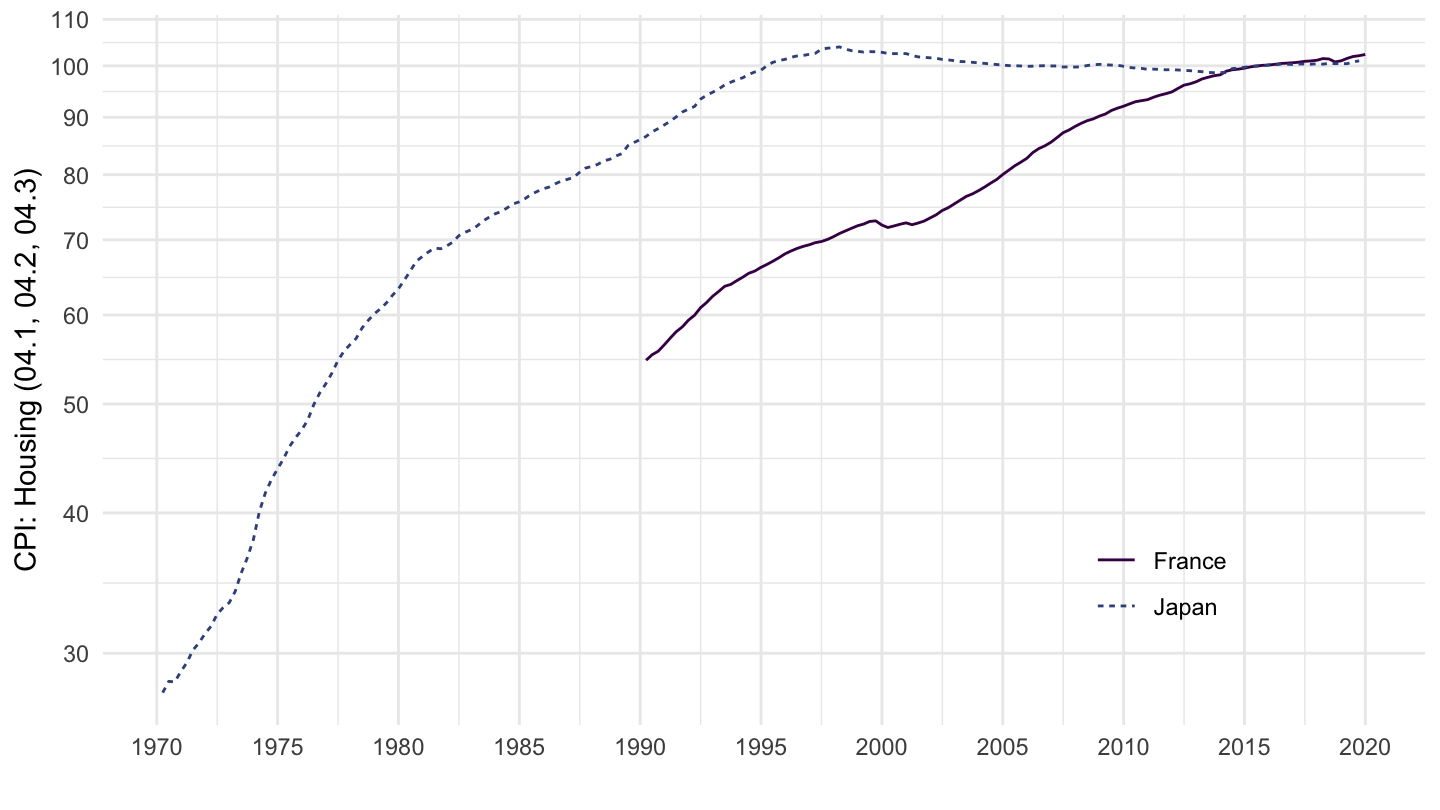
Canada, United Kingdom, Norway, Denmark
CPI: 04.1 - Actual rentals for housing - CP040100
Code
HOUSING %>%
  filter(LOCATION %in% c("CAN", "GBR", "DNK", "NOR"),
         SUBJECT == "CP040100",
         FREQUENCY == "Q",
         MEASURE == "IXOB") %>%
  quarter_to_enddate %>%
  left_join(HOUSING_var$LOCATION %>%
              setNames(c("LOCATION", "Location")), by = "LOCATION") %>%
  ggplot(.) + geom_line() +
  aes(x = date, y = obsValue, color = Location, linetype = Location) +
  theme_minimal() + xlab("") + ylab("CPI: 04.1 - Actual rentals") +
  scale_x_date(breaks = seq(1960, 2100, 5) %>% paste0("-01-01") %>% as.Date,
               labels = date_format("%Y")) +
  scale_y_log10(breaks = seq(0, 200, 10)) +
  scale_color_manual(values = viridis(5)[1:4]) +
  theme(legend.position = c(0.8, 0.20),
        legend.title = element_blank())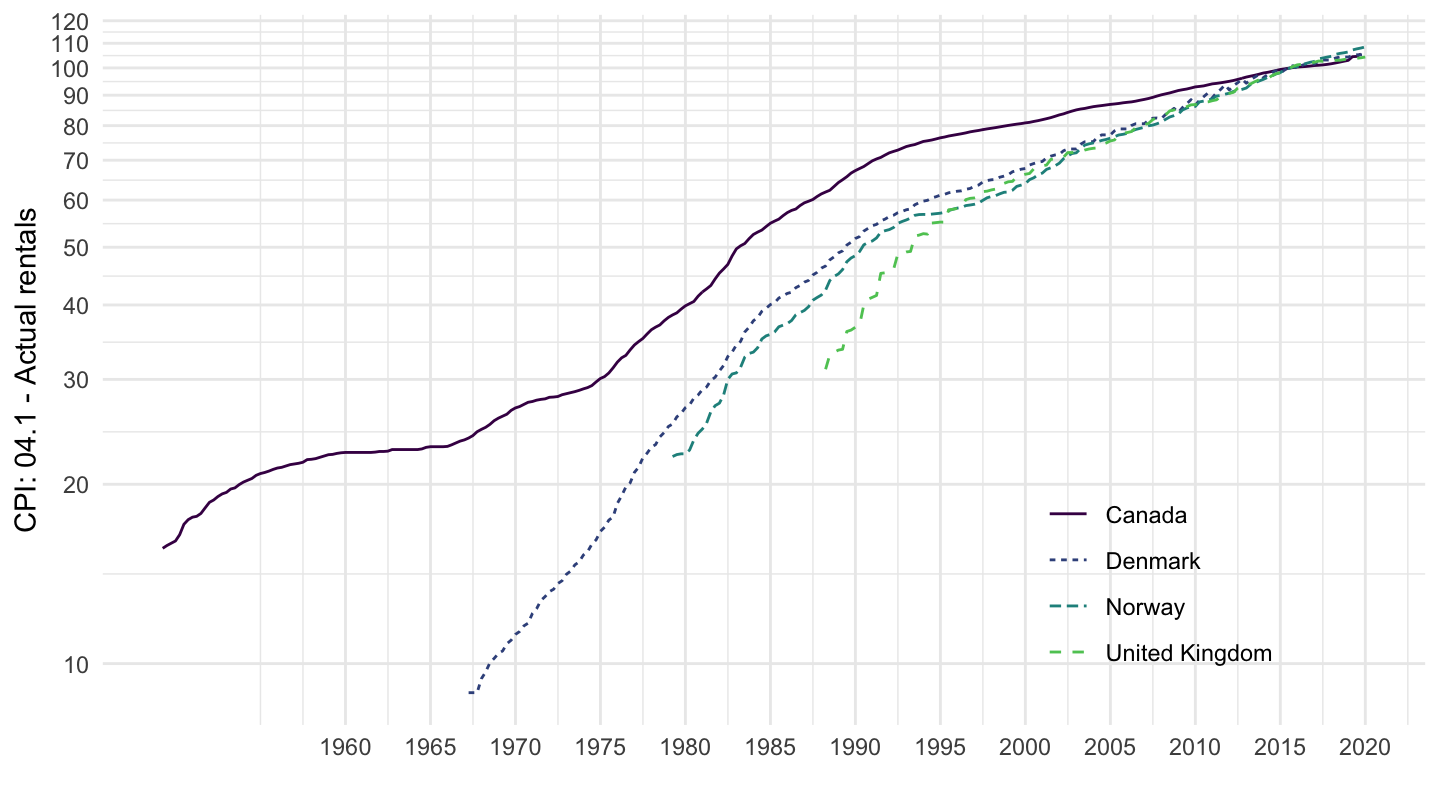
CPI: 04.2 - Imputed rentals for housing - CP040200
Code
HOUSING %>%
  filter(LOCATION %in% c("CAN", "GBR", "DNK", "NOR"),
         SUBJECT == "CP040200",
         FREQUENCY == "Q",
         MEASURE == "IXOB") %>%
  quarter_to_enddate %>%
  left_join(HOUSING_var$LOCATION %>%
              setNames(c("LOCATION", "Location")), by = "LOCATION") %>%
  ggplot(.) + geom_line() +
  aes(x = date, y = obsValue, color = Location, linetype = Location) +
  theme_minimal() + xlab("") + ylab("CPI: 04.2 - Imputed rentals") +
  scale_x_date(breaks = seq(1960, 2100, 5) %>% paste0("-01-01") %>% as.Date,
               labels = date_format("%Y")) +
  scale_y_log10(breaks = seq(0, 200, 10)) +
  scale_color_manual(values = viridis(5)[1:4]) +
  theme(legend.position = c(0.8, 0.20),
        legend.title = element_blank())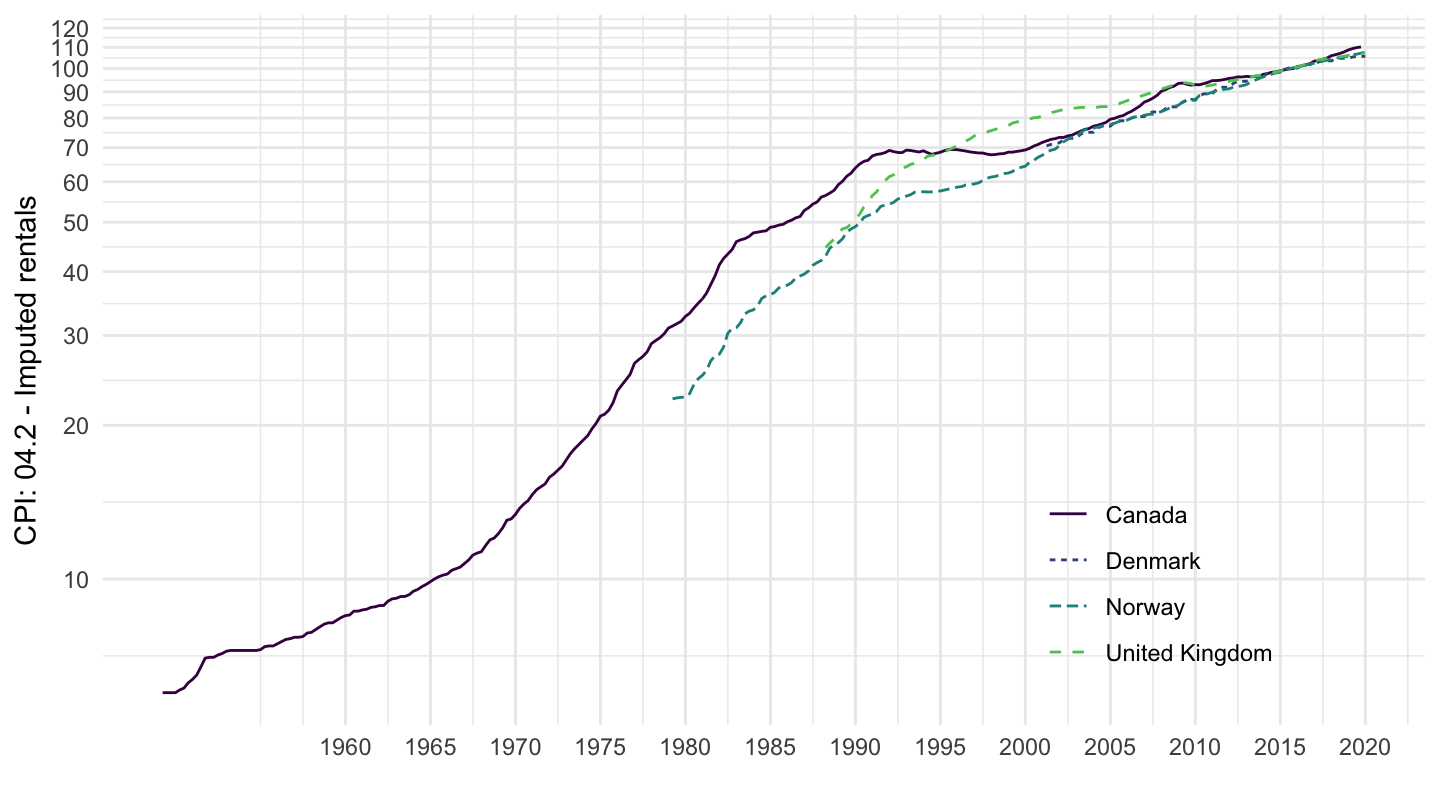
CPI: Housing (04.1, 04.2, 04.3) - CPGRHO01
Code
HOUSING %>%
  filter(LOCATION %in% c("CAN", "GBR", "DNK", "NOR"),
         SUBJECT == "CPGRHO01",
         FREQUENCY == "Q",
         MEASURE == "IXOB") %>%
  quarter_to_enddate %>%
  left_join(HOUSING_var$LOCATION %>%
              setNames(c("LOCATION", "Location")), by = "LOCATION") %>%
  ggplot(.) + geom_line() +
  aes(x = date, y = obsValue, color = Location, linetype = Location) +
  theme_minimal() + xlab("") + ylab("CPI: Housing (04.1, 04.2, 04.3)") +
  scale_x_date(breaks = seq(1960, 2100, 5) %>% paste0("-01-01") %>% as.Date,
               labels = date_format("%Y")) +
  scale_y_log10(breaks = seq(0, 200, 10)) +
  scale_color_manual(values = viridis(5)[1:4]) +
  theme(legend.position = c(0.8, 0.20),
        legend.title = element_blank())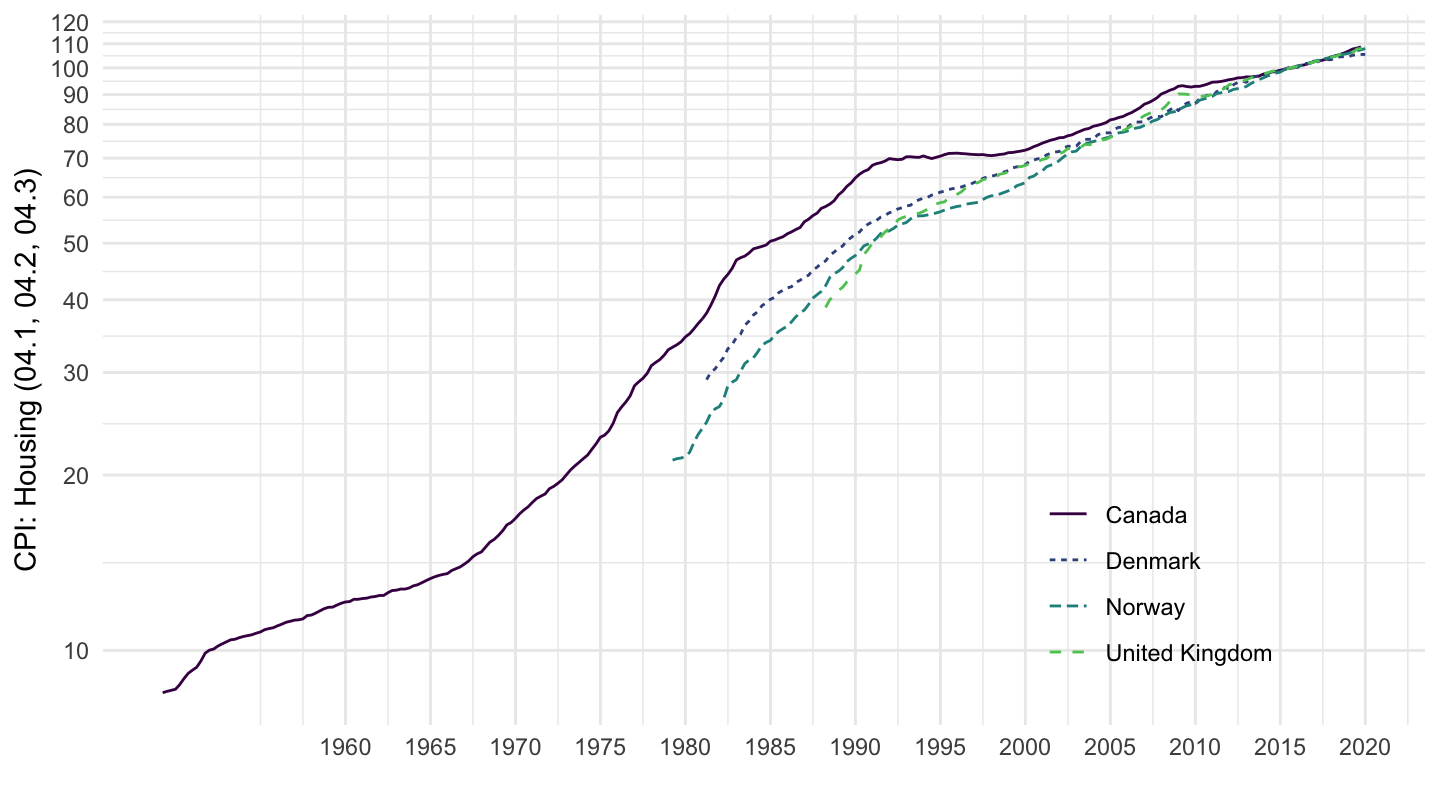
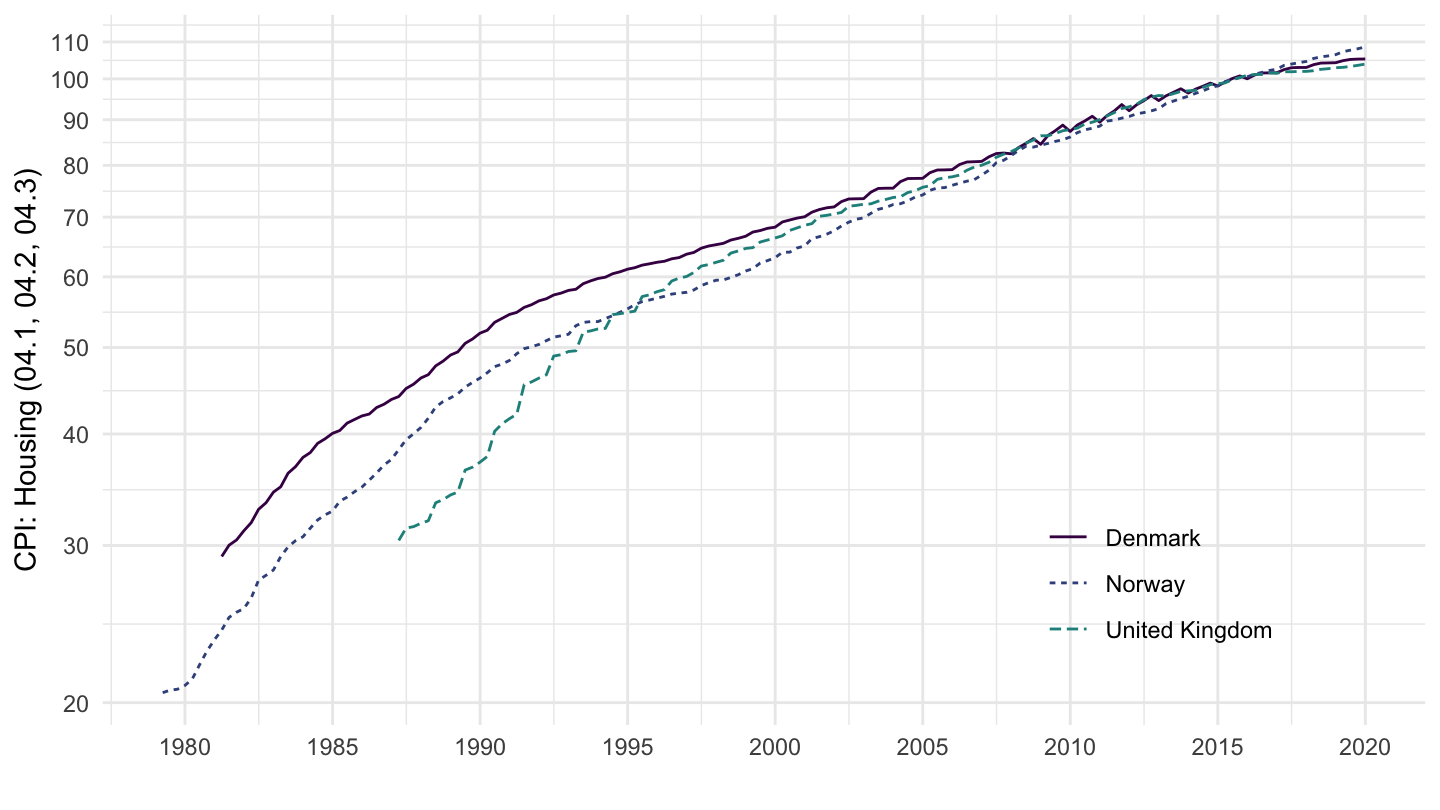
CPI: Housing excluding imputed rentals for housing (04.1, 04.3) - CPGRHO02
Code
HOUSING %>%
  filter(LOCATION %in% c("CAN", "GBR", "DNK", "NOR"),
         SUBJECT == "CPGRHO02",
         FREQUENCY == "Q",
         MEASURE == "IXOB") %>%
  quarter_to_enddate %>%
  left_join(HOUSING_var$LOCATION %>%
              setNames(c("LOCATION", "Location")), by = "LOCATION") %>%
  ggplot(.) + geom_line() +
  aes(x = date, y = obsValue, color = Location, linetype = Location) +
  theme_minimal() + xlab("") + ylab("CPI: Housing (04.1, 04.2, 04.3)") +
  scale_x_date(breaks = seq(1960, 2100, 5) %>% paste0("-01-01") %>% as.Date,
               labels = date_format("%Y")) +
  scale_y_log10(breaks = seq(0, 200, 10)) +
  scale_color_manual(values = viridis(5)[1:4]) +
  theme(legend.position = c(0.8, 0.20),
        legend.title = element_blank())