
Last observation: Q2 2026 (N = 104)
First observation: Q1 1975 (N = 60)
Last data update: 09 oct. 2026, 22:10
Last compile: 10 oct. 2026, 00:45
`CHOMAGE-TRIM-NATIONAL` |>
  filter(IDBANK %in% c("010605056",
                       "010605048",
                       "010605049",
                       "010605050")) |>
  select(AGE, TITLE_FR, TIME_PERIOD, OBS_VALUE) %>%
  mutate(OBS_VALUE = OBS_VALUE |> as.numeric(),
         TITLE_FR = TITLE_FR %>% gsub("\\(en milliers\\) - France hors Mayotte - Données CVS", "", .),
         TITLE_FR = TITLE_FR %>% gsub("Personnes dans le halo autour du chômage - ", "", .)) |>
  quarter_to_date() |>
  ggplot() + geom_line(aes(x = date, y = OBS_VALUE, color = TITLE_FR, linetype = TITLE_FR)) +

  theme_minimal() +
  scale_x_date(breaks = seq(1920, 2100, 2) |> paste0("-01-01") |> as.Date(),
               labels = date_format("%Y")) +
  theme(legend.position = c(0.6, 0.85),
        legend.title = element_blank()) +
  scale_y_continuous(breaks = seq(0, 9000, 500),
                     labels = dollar_format(accuracy = 1, prefix = "", su = " K")) +
  ylab("Halo du Chômage (en milliers)") + xlab("")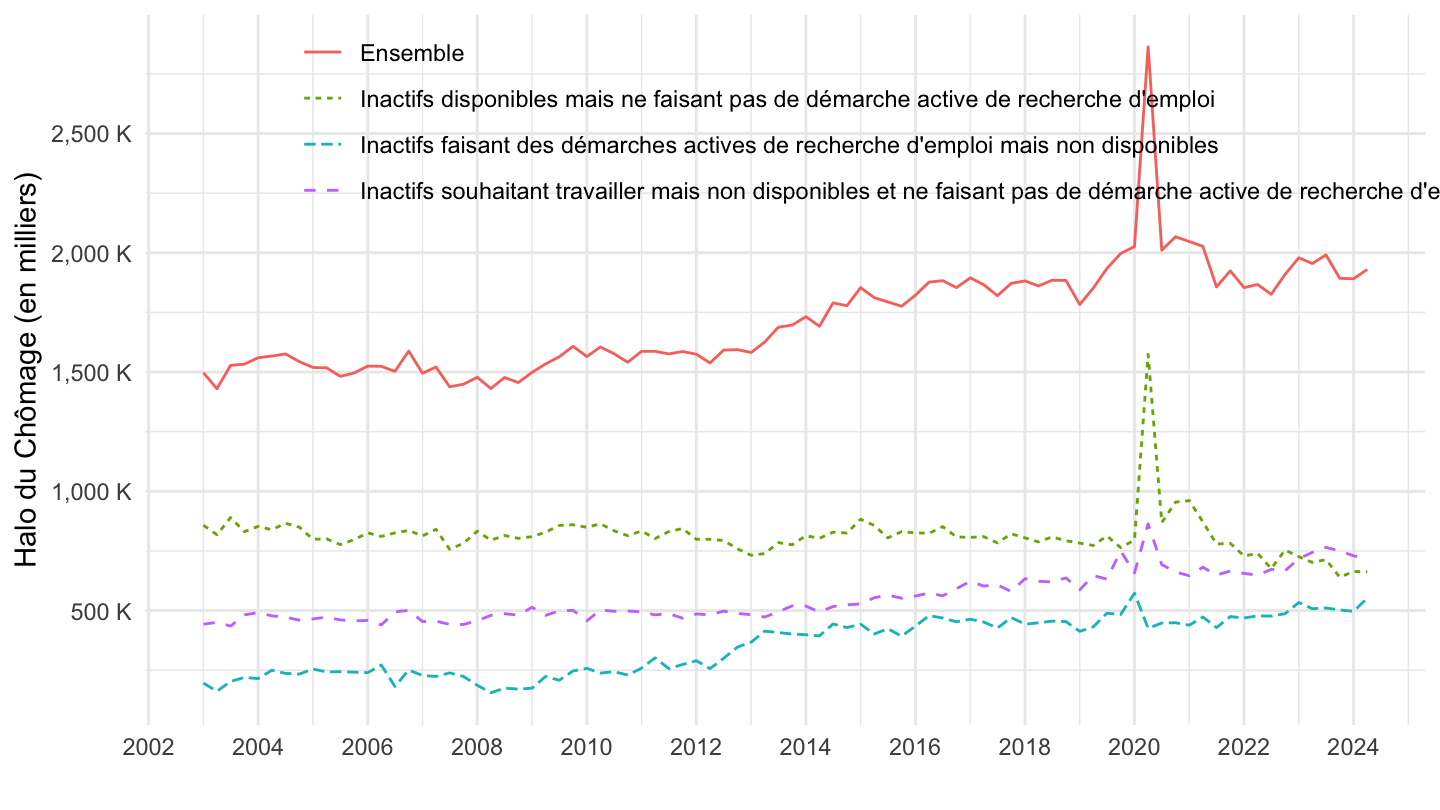
`CHOMAGE-TRIM-NATIONAL` |>
  filter(INDICATEUR %in% c("CHLODU", "HALO_1", "HALO_2", "HALO_3"),
         REF_AREA == "FR-D976") |>
  quarter_to_date() |>

  mutate(INDICATEUR = gsub("Personnes dans le halo autour du chômage : ", "", INDICATEUR)) |>
  arrange(date) |>
  select(date, OBS_VALUE, INDICATEUR, INDICATEUR) |>
  ggplot() + ylab("Halo du Chômage (en milliers)") + xlab("") + theme_minimal() +
  geom_line(aes(x = date, y = OBS_VALUE, color = INDICATEUR, linetype = INDICATEUR)) +

  scale_x_date(breaks = seq(1920, 2100, 2) |> paste0("-01-01") |> as.Date(),
               labels = date_format("%Y")) +
  theme(legend.position = c(0.55, 0.85),
        legend.title = element_blank()) +
  scale_y_continuous(breaks = seq(0, 9000, 200),
                     labels = dollar_format(accuracy = 1, prefix = ""),
                     limits = c(0, 2000))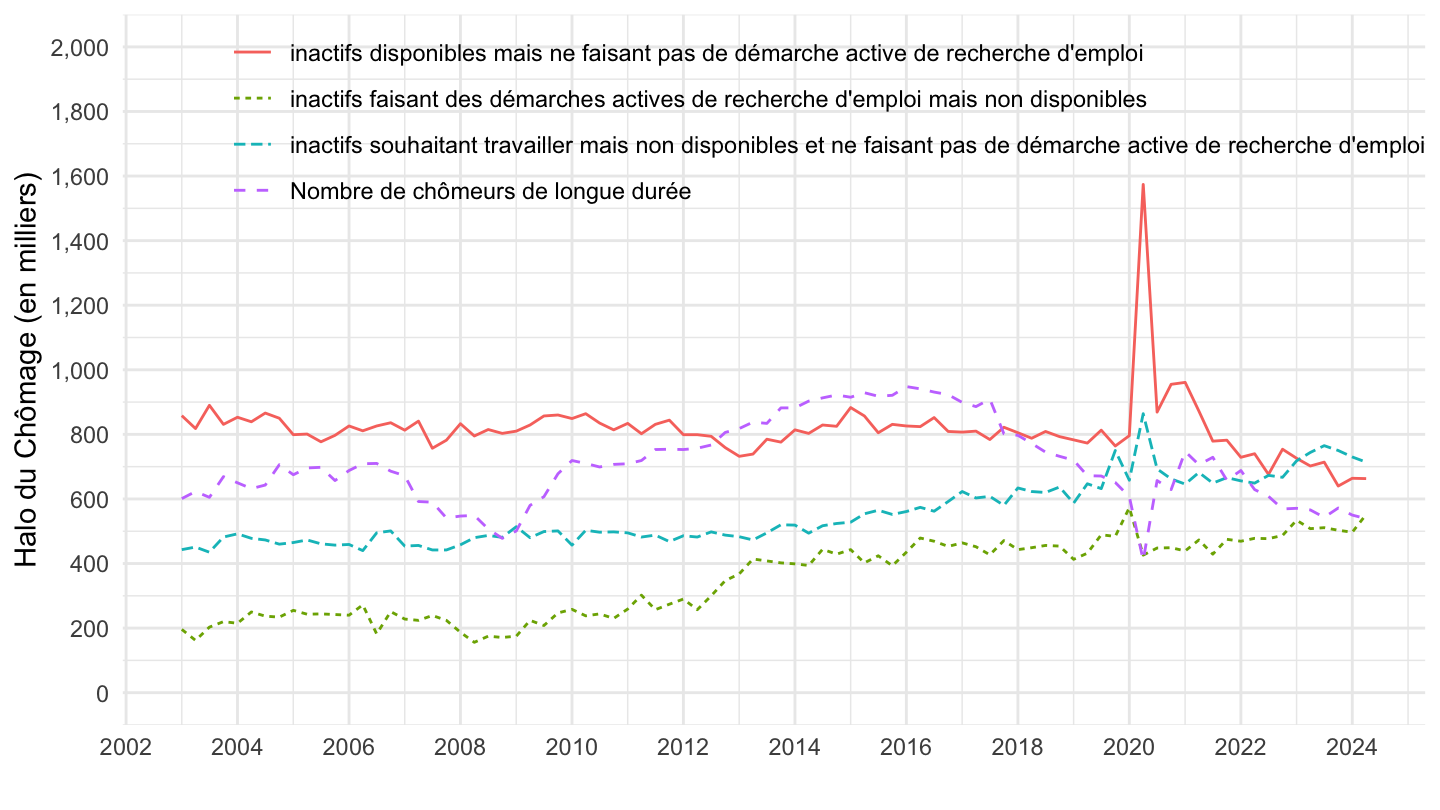
`CHOMAGE-TRIM-NATIONAL` |>
  filter(INDICATEUR == "CTCHC",
         AGE == "00-",
         SEXE == "0") |>
  quarter_to_date() |>

  ggplot() + theme_minimal() + ylab("Nombre de chômeurs") + xlab("") +
  geom_line(aes(x = date, y = OBS_VALUE, color = REF_AREA)) +
  scale_x_date(breaks = seq(1920, 2100, 5) |> paste0("-01-01") |> as.Date(),
               labels = date_format("%Y")) +
  theme(legend.position = c(0.8, 0.15),
        legend.title = element_blank()) +
  scale_y_continuous(breaks = seq(0, 3000, 500),
                     labels = dollar_format(accuracy = 1, pre = "", su = " K"))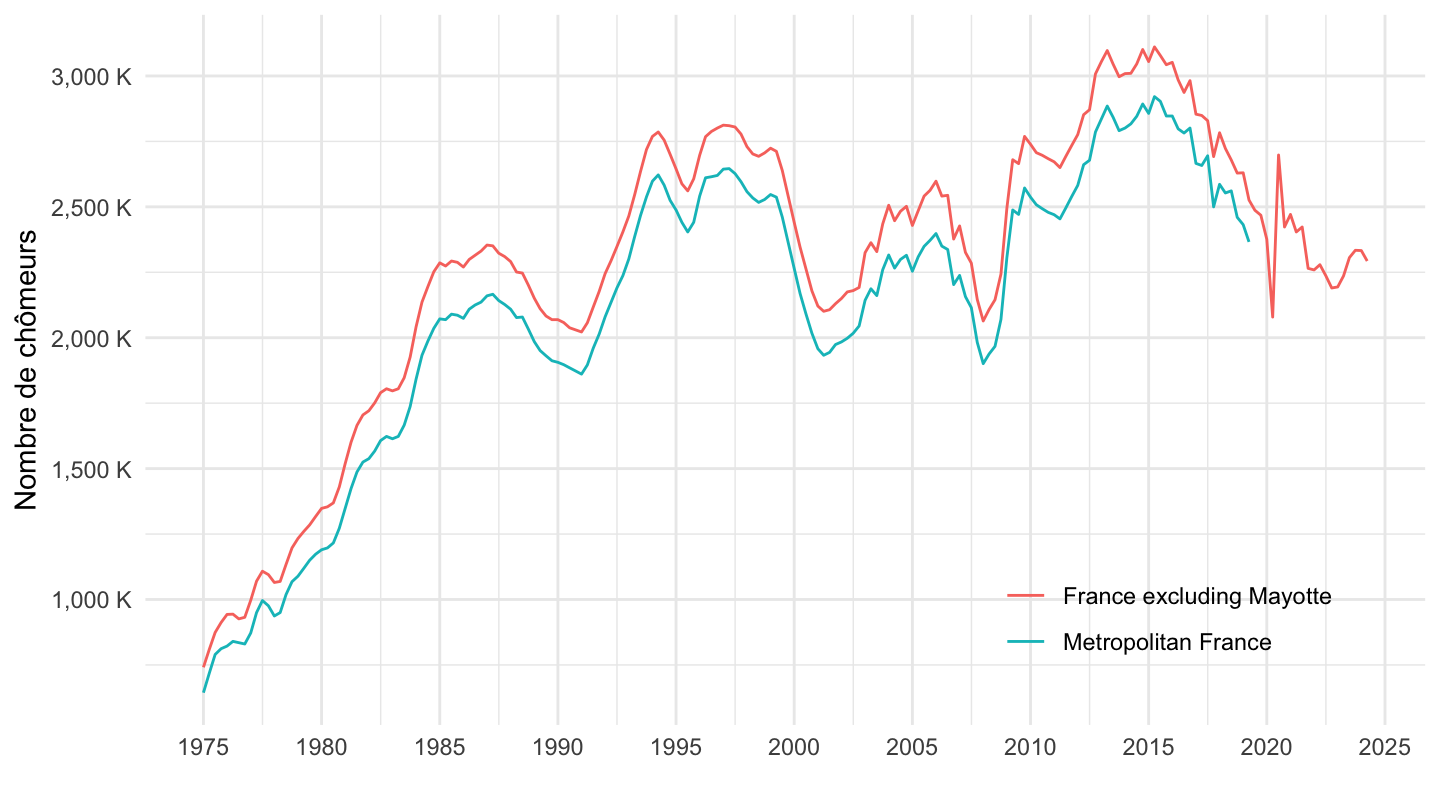
`CHOMAGE-TRIM-NATIONAL` |>
  filter(INDICATEUR == "CTTXC",
         AGE == "00-",
         SEXE == "0") |>
  quarter_to_date() |>

  mutate(OBS_VALUE = OBS_VALUE/100) |>
  ggplot() + theme_minimal() + ylab("Taux de chômage (%)") + xlab("") +
  geom_line(aes(x = date, y = OBS_VALUE, color = REF_AREA)) +
  scale_x_date(breaks = seq(1920, 2100, 5) |> paste0("-01-01") |> as.Date(),
               labels = date_format("%Y")) +
  theme(legend.position = c(0.8, 0.15),
        legend.title = element_blank()) +
  scale_y_continuous(breaks = 0.01*seq(0, 20, 1),
                     labels = percent_format(accuracy = 1)) +
  geom_hline(yintercept = 0.05, linetype = "dashed")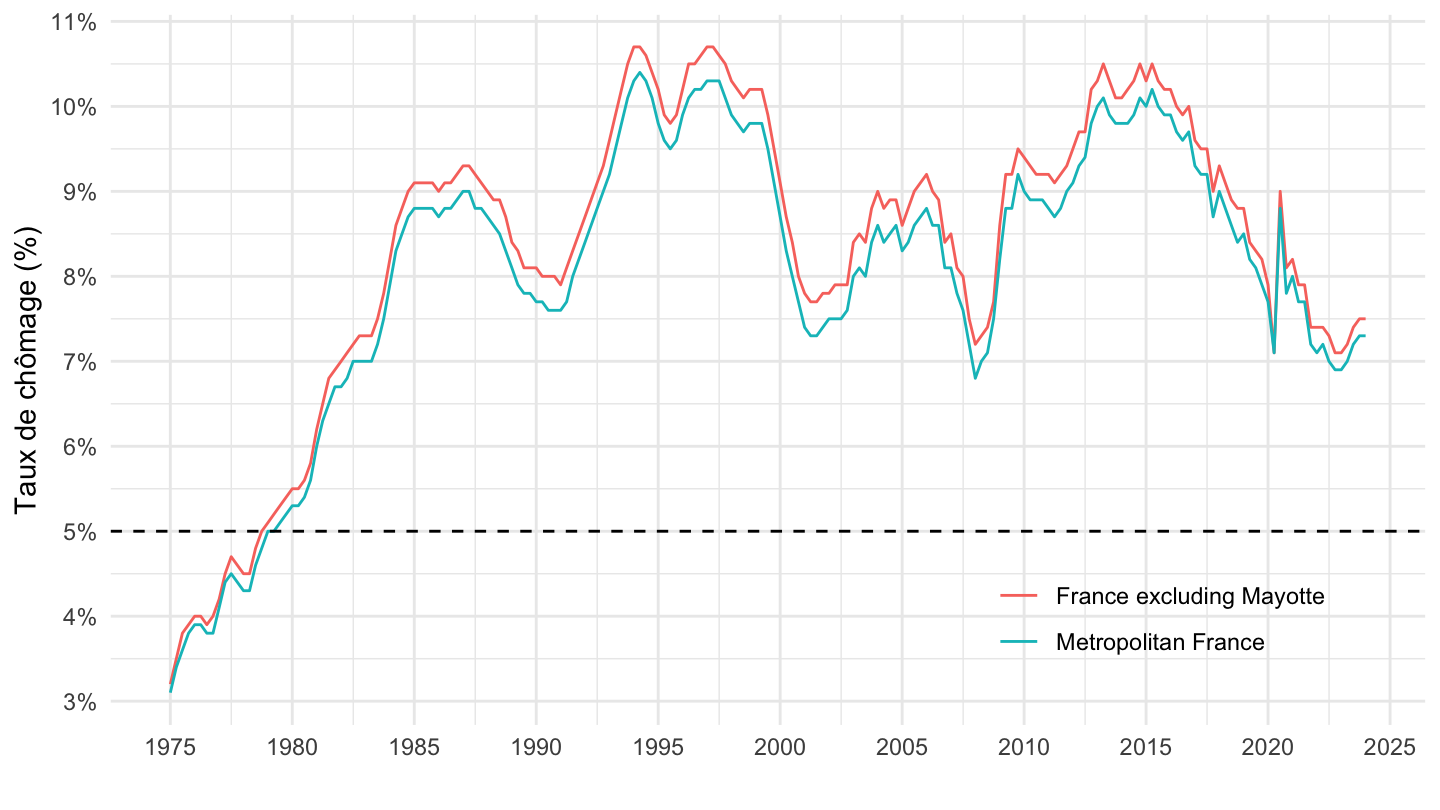
`CHOMAGE-TRIM-NATIONAL` |>
  filter(INDICATEUR == "CTTXC",
         AGE == "00-",
         SEXE == "0") |>
  quarter_to_date() |>
  filter(date >= as.Date("1990-01-01")) |>

  mutate(OBS_VALUE = OBS_VALUE/100) |>
  ggplot() + theme_minimal() + ylab("Taux de chômage (%)") + xlab("") +
  geom_line(aes(x = date, y = OBS_VALUE, color = REF_AREA)) +
  scale_x_date(breaks = seq(1920, 2100, 5) |> paste0("-01-01") |> as.Date(),
               labels = date_format("%Y")) +
  theme(legend.position = c(0.8, 0.15),
        legend.title = element_blank()) +
  scale_y_continuous(breaks = 0.01*seq(0, 20, 1),
                     labels = percent_format(accuracy = 1))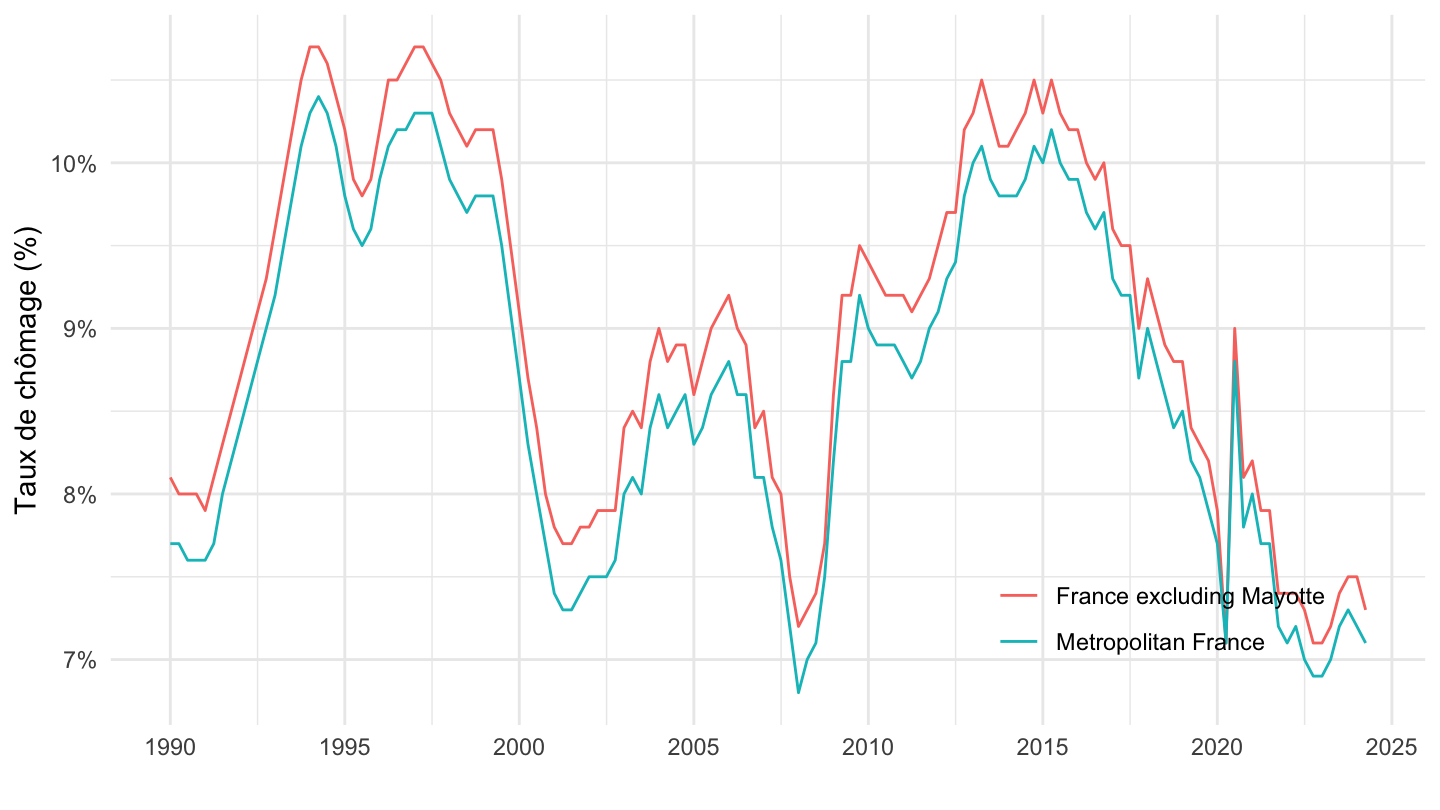
`CHOMAGE-TRIM-NATIONAL` |>
  filter(INDICATEUR == "CTTXC",
         REF_AREA == "FR-D976",
         AGE == "00-") |>
  quarter_to_date() |>

  ggplot() + theme_minimal() + ylab("Taux de chômage (%)") + xlab("") +
  geom_line(aes(x = date, y = OBS_VALUE/100, color = SEXE, linetype = SEXE)) +
  scale_color_manual(values = c("black", "red", "blue")) +
  scale_x_date(breaks = seq(1920, 2100, 5) |> paste0("-01-01") |> as.Date(),
               labels = date_format("%Y")) +
  theme(legend.position = c(0.8, 0.3),
        legend.title = element_blank()) +
  scale_y_continuous(breaks = 0.01*seq(0, 20, 1),
                     labels = percent_format(accuracy = 1))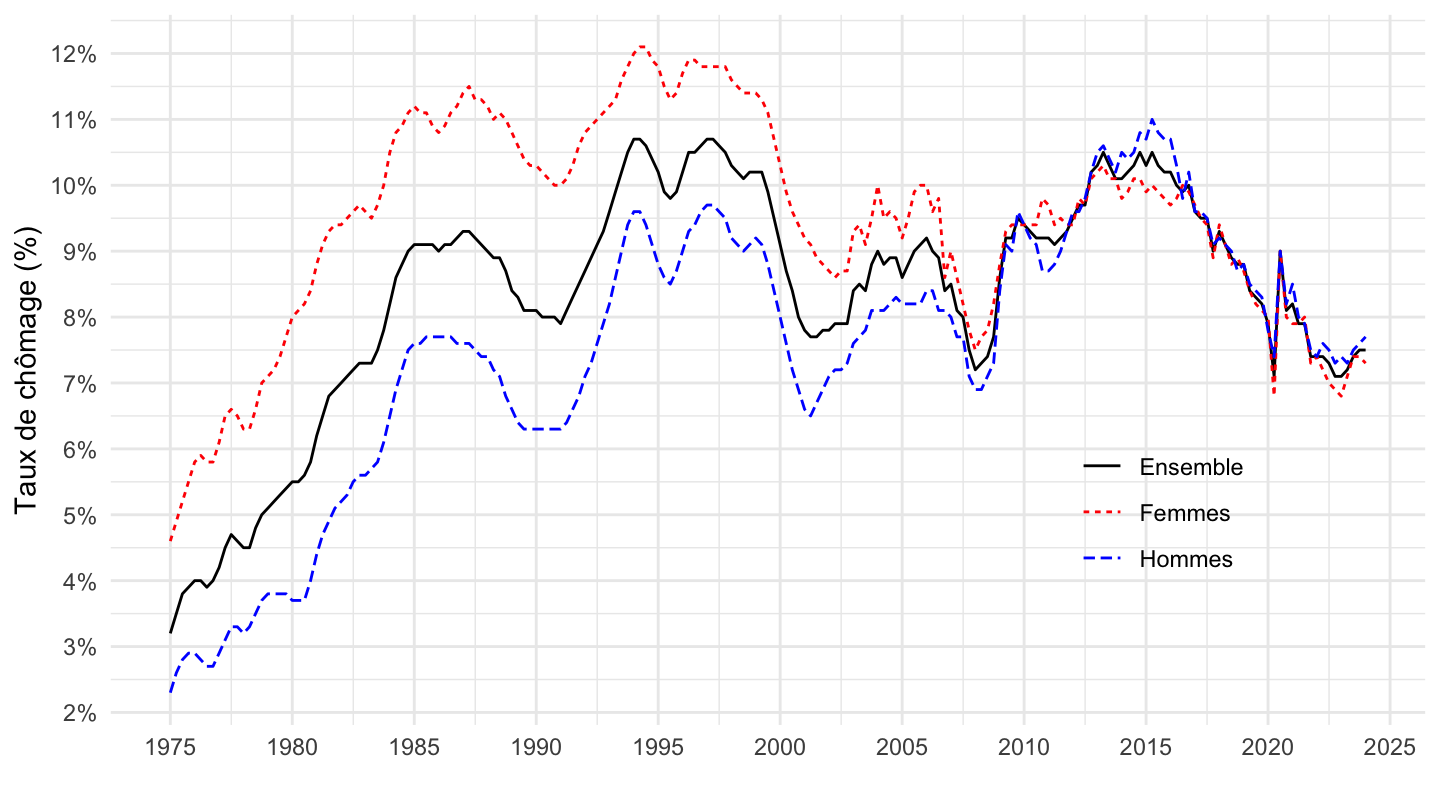
`CHOMAGE-TRIM-NATIONAL` |>
  filter(INDICATEUR == "CTTXC",
         REF_AREA == "FR-D976",
         AGE == "00-") |>
  quarter_to_date() |>
  filter(date >= as.Date("2005-01-01")) |>

  ggplot() + theme_minimal() + ylab("Taux de chômage (%)") + xlab("") +
  geom_line(aes(x = date, y = OBS_VALUE/100, color = SEXE, linetype = SEXE)) +
  scale_color_manual(values = c("black", "red", "blue")) +
  scale_x_date(breaks = seq(1920, 2100, 1) |> paste0("-01-01") |> as.Date(),
               labels = date_format("%Y")) +
  theme(legend.position = c(0.85, 0.9),
        legend.title = element_blank()) +
  scale_y_continuous(breaks = 0.01*seq(0, 20, .5),
                     labels = percent_format(accuracy = .1))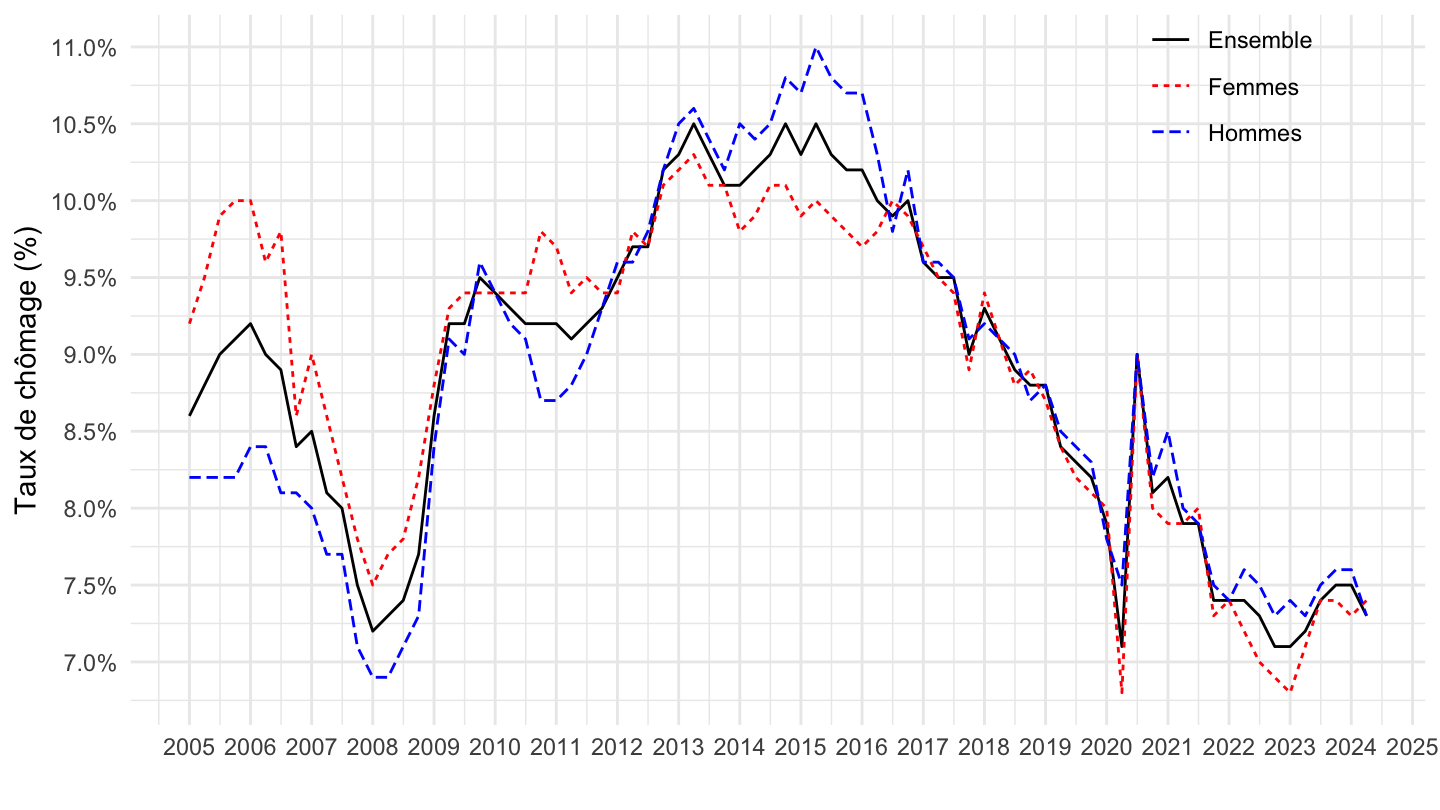
`CHOMAGE-TRIM-NATIONAL` |>
  filter(INDICATEUR == "CTTXC",
         REF_AREA == "FR-D976",
         AGE == "00-") |>
  quarter_to_date() |>
  filter(date >= as.Date("2010-01-01")) |>

  ggplot() + theme_minimal() + ylab("Taux de chômage (%)") + xlab("") +
  geom_line(aes(x = date, y = OBS_VALUE/100, color = SEXE, linetype = SEXE)) +
  scale_color_manual(values = c("black", "red", "blue")) +
  scale_x_date(breaks = seq(1920, 2100, 1) |> paste0("-01-01") |> as.Date(),
               labels = date_format("%Y")) +
  theme(legend.position = c(0.8, 0.9),
        legend.title = element_blank()) +
  scale_y_continuous(breaks = 0.01*seq(0, 20, .5),
                     labels = percent_format(accuracy = .1))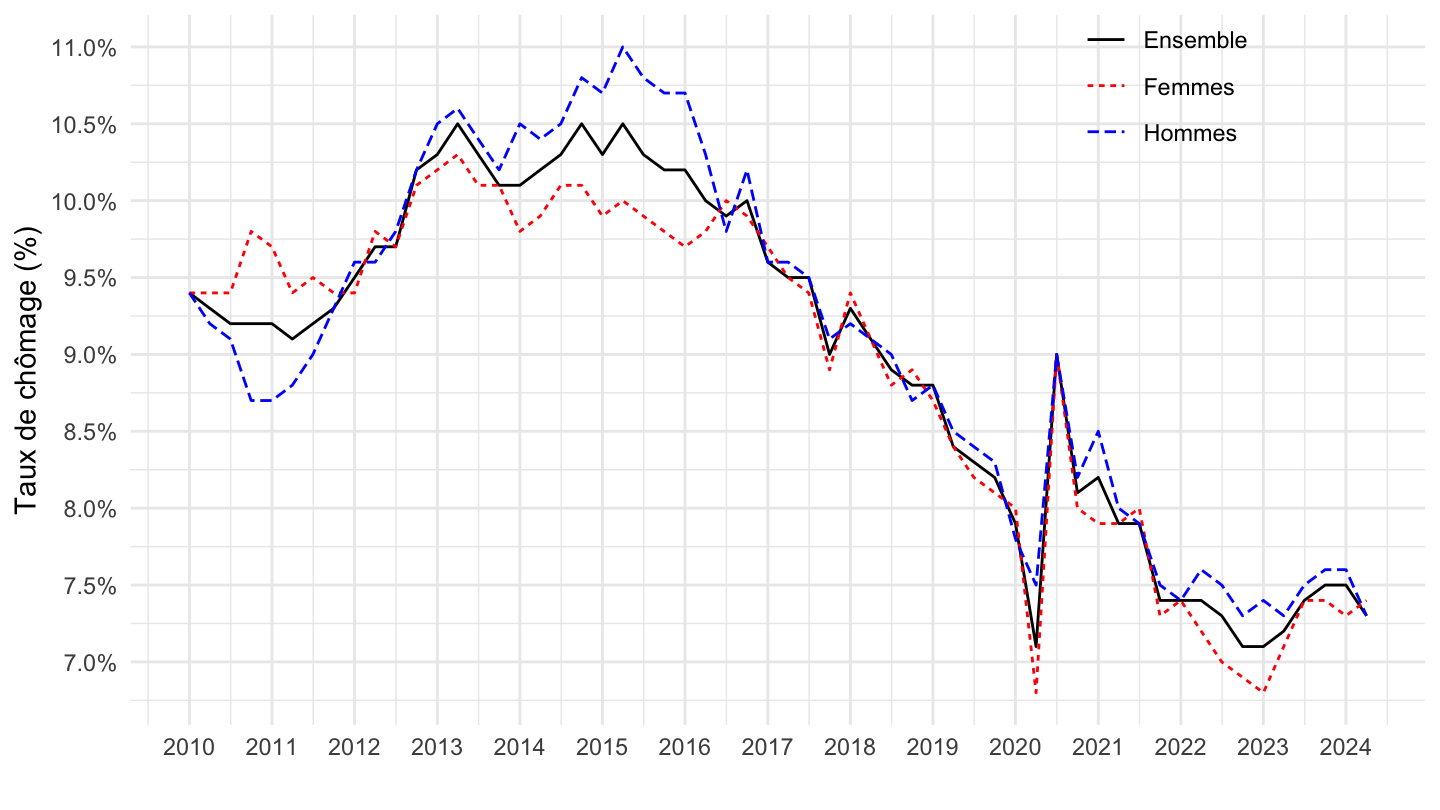
`CHOMAGE-TRIM-NATIONAL` |>
  filter(INDICATEUR %in% c("CTCHC", "CHLODU"),
         SEXE == "0",
         AGE == "00-24") |>
  quarter_to_date() |>

  ggplot() + theme_minimal() + ylab("Nombre de chômeurs") + xlab("") +
  geom_line(aes(x = date, y = OBS_VALUE*1000, color = REF_AREA)) +

  scale_x_date(breaks = seq(1920, 2100, 5) |> paste0("-01-01") |> as.Date(),
               labels = date_format("%Y")) +
  theme(legend.position = c(0.8, 0.88),
        legend.title = element_blank()) +
  scale_y_continuous(breaks = 1000*seq(100, 1100, 50),
                     labels = dollar_format(pre = ""))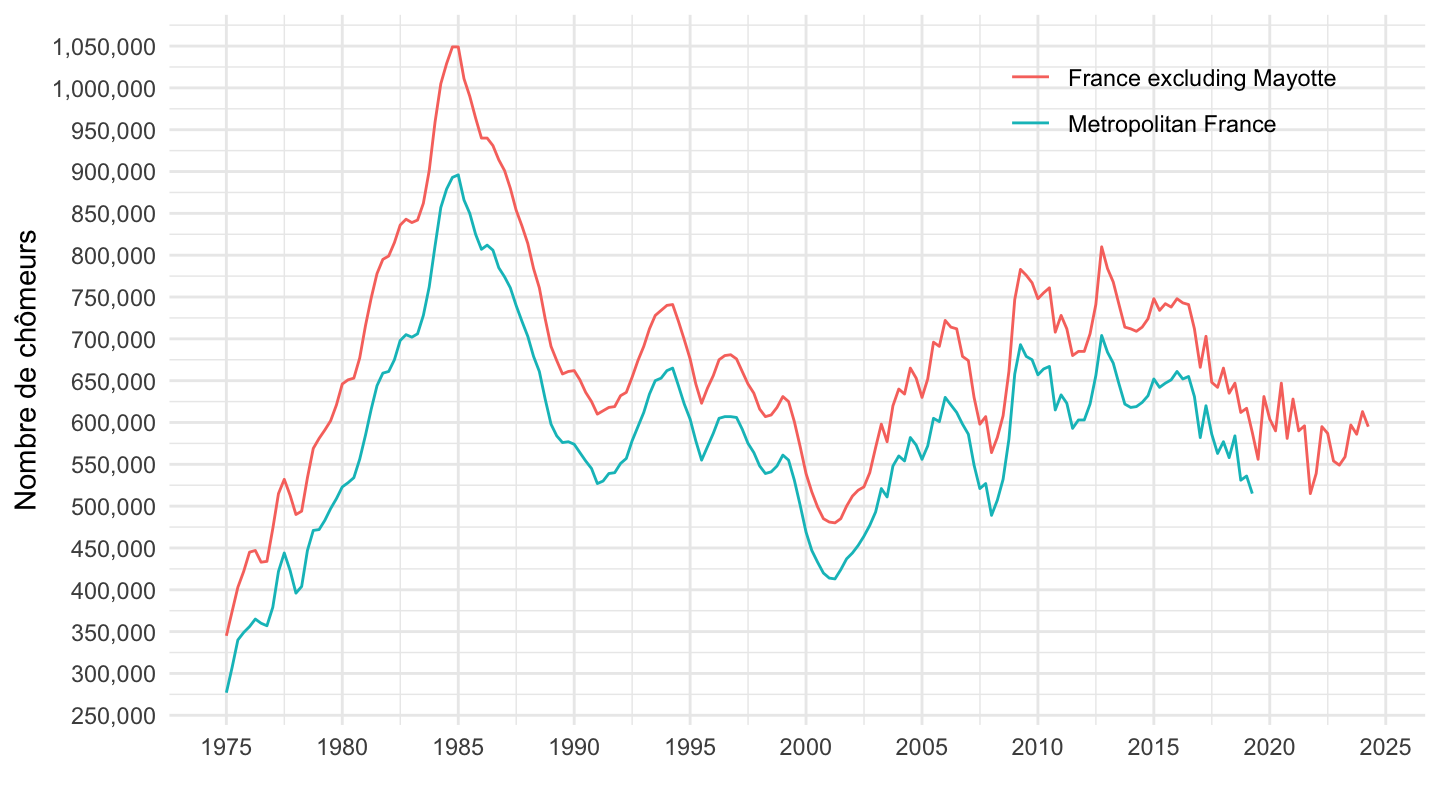
`CHOMAGE-TRIM-NATIONAL` |>
  filter(INDICATEUR == "CTCHC",
         SEXE == "0",
         AGE == "00-24") |>
  quarter_to_date() |>
  filter(date >= as.Date("1990-01-01")) |>

  ggplot() + theme_minimal() + ylab("Nombre de chômeurs") + xlab("") +
  geom_line(aes(x = date, y = OBS_VALUE*1000, color = REF_AREA)) +

  scale_x_date(breaks = seq(1920, 2100, 5) |> paste0("-01-01") |> as.Date(),
               labels = date_format("%Y")) +
  theme(legend.position = c(0.4, 0.88),
        legend.title = element_blank()) +
  scale_y_continuous(breaks = 1000*seq(100, 1100, 50),
                     labels = dollar_format(pre = ""))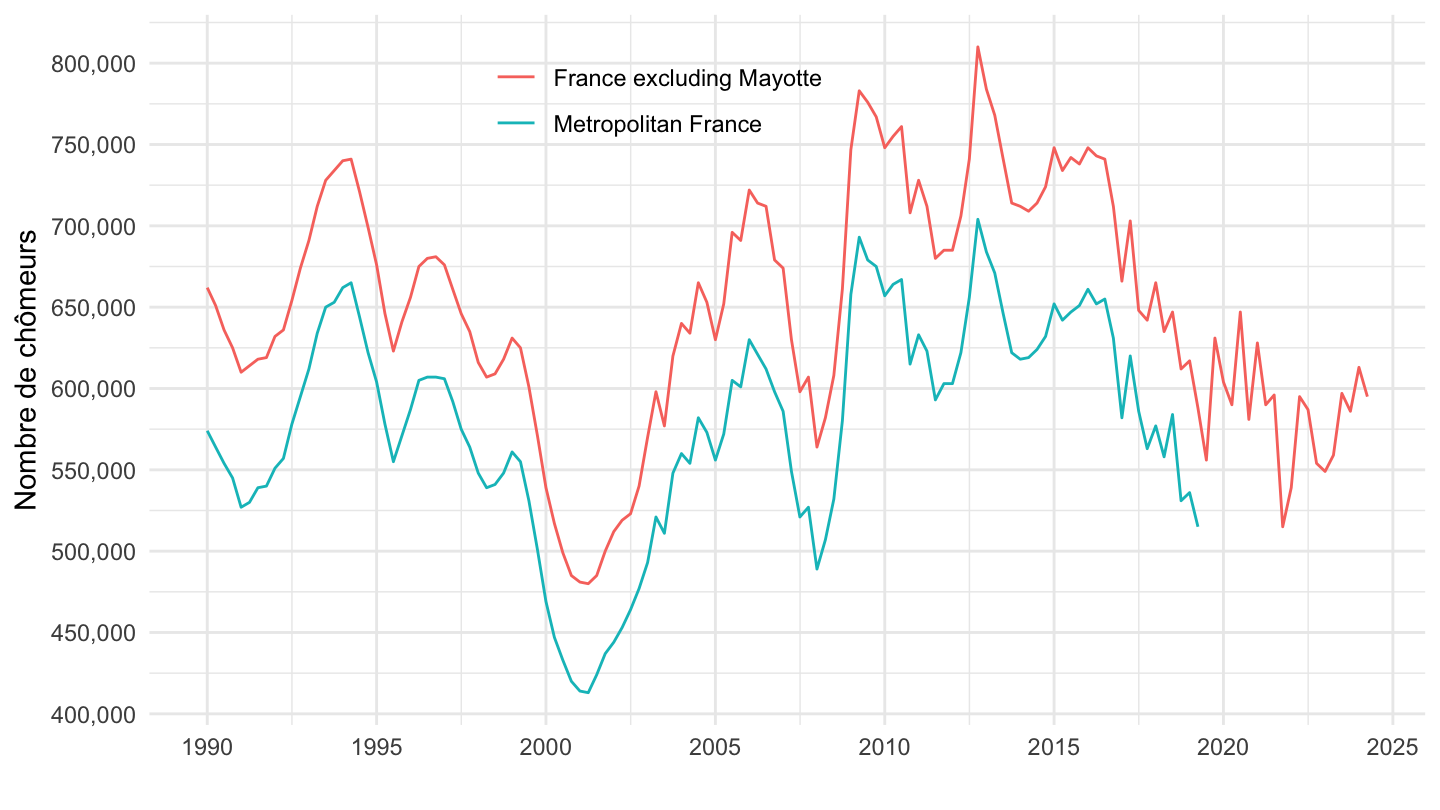
`CHOMAGE-TRIM-NATIONAL` |>
  filter(INDICATEUR == "CTTXC",
         REF_AREA == "FR-D976",
         SEXE == "0") |>
  quarter_to_date() |>

  ggplot() + theme_minimal() + ylab("Taux de chômage (%)") + xlab("") +
  geom_line(aes(x = date, y = OBS_VALUE/100, color = AGE)) +
  scale_x_date(breaks = seq(1920, 2100, 5) |> paste0("-01-01") |> as.Date(),
               labels = date_format("%Y")) +
  theme(legend.position = c(0.12, 0.88),
        legend.title = element_blank()) +
  scale_y_continuous(breaks = 0.01*seq(0, 40, 5),
                     labels = percent_format(accuracy = 1))
`CHOMAGE-TRIM-NATIONAL` |>
  filter(INDICATEUR == "CTTXC",
         REF_AREA == "FR-D976",
         SEXE == "0") |>
  quarter_to_date() |>
  filter(date >= as.Date("2005-01-01")) |>

  ggplot() + theme_minimal() + ylab("Taux de chômage (%)") + xlab("") +
  geom_line(aes(x = date, y = OBS_VALUE/100, color = AGE)) +

  scale_x_date(breaks = seq(1920, 2100, 1) |> paste0("-01-01") |> as.Date(),
               labels = date_format("%Y")) +
  theme(legend.position = c(0.9, 0.9),
        legend.title = element_blank()) +
  scale_y_continuous(breaks = 0.01*seq(0, 40, 2),
                     labels = percent_format(accuracy = 1))
`CHOMAGE-TRIM-NATIONAL` |>
  filter(INDICATEUR == "CTTXC",
         REF_AREA == "FR-D976",
         SEXE == "0") |>
  quarter_to_date() |>
  filter(date >= as.Date("2005-01-01")) |>

  ggplot() + theme_minimal() + ylab("Taux de chômage (%)") + xlab("") +
  geom_line(aes(x = date, y = OBS_VALUE/100, color = AGE)) +

  scale_x_date(breaks = seq(1920, 2100, 1) |> paste0("-01-01") |> as.Date(),
               labels = date_format("%Y")) +
  theme(legend.position = c(0.9, 0.9),
        legend.title = element_blank()) +
  scale_y_continuous(breaks = 0.01*seq(0, 40, 2),
                     labels = percent_format(accuracy = 1))
`CHOMAGE-TRIM-NATIONAL` |>
  filter(INDICATEUR == "CTTXC",
         REF_AREA == "FR-D976",
         SEXE == "0") |>
  quarter_to_date() |>
  filter(date >= as.Date("2017-01-01")) |>

  ggplot() + theme_minimal() + ylab("Taux de chômage (%)") + xlab("") +
  geom_line(aes(x = date, y = OBS_VALUE/100, color = AGE)) +

  scale_x_date(breaks = "6 months",
               labels = date_format("%b %Y")) +
  theme(legend.position = c(0.9, 0.9),
        legend.title = element_blank()) +
  scale_y_continuous(breaks = 0.01*seq(0, 40, 2),
                     labels = percent_format(accuracy = 1))
`CHOMAGE-TRIM-NATIONAL` |>
  filter(INDICATEUR == "CTTXC",
         REF_AREA == "FR-D976",
         SEXE == "0",
         AGE != "00-24") |>
  quarter_to_date() |>

  ggplot() + theme_minimal() + ylab("Taux de chômage (%)") + xlab("") +
  geom_line(aes(x = date, y = OBS_VALUE/100, color = AGE)) +

  scale_x_date(breaks = seq(1920, 2100, 5) |> paste0("-01-01") |> as.Date(),
               labels = date_format("%Y")) +
  theme(legend.position = c(0.15, 0.9),
        legend.title = element_blank()) +
  scale_y_continuous(breaks = 0.01*seq(0, 40, 1),
                     labels = percent_format(accuracy = 1),
                     limits = c(0, 0.13))
`CHOMAGE-TRIM-NATIONAL` |>
  filter(INDICATEUR == "CTTXC",
         REF_AREA == "FR-D976",
         SEXE == "0",
         AGE != "00-24") |>
  quarter_to_date() |>
  filter(date >= as.Date("2005-01-01")) |>

  ggplot() + theme_minimal() + ylab("Taux de chômage (%)") + xlab("") +
  geom_line(aes(x = date, y = OBS_VALUE/100, color = AGE)) +

  scale_x_date(breaks = seq(1920, 2100, 1) |> paste0("-01-01") |> as.Date(),
               labels = date_format("%Y")) +
  theme(legend.position = c(0.9, 0.9),
        legend.title = element_blank()) +
  scale_y_continuous(breaks = 0.01*seq(0, 40, 1),
                     labels = percent_format(accuracy = 1))
`CHOMAGE-TRIM-NATIONAL` |>
  filter(INDICATEUR == "CTTXC",
         REF_AREA == "FR-D976",
         SEXE == "0",
         AGE != "00-24") |>
  quarter_to_date() |>
  filter(date >= as.Date("2005-01-01")) |>

  ggplot() + theme_minimal() + ylab("Taux de chômage (%)") + xlab("") +
  geom_line(aes(x = date, y = OBS_VALUE/100, color = AGE)) +

  scale_x_date(breaks = seq(1920, 2100, 1) |> paste0("-01-01") |> as.Date(),
               labels = date_format("%Y")) +
  theme(legend.position = c(0.9, 0.9),
        legend.title = element_blank()) +
  scale_y_continuous(breaks = 0.01*seq(0, 40, 1),
                     labels = percent_format(accuracy = 1))
`CHOMAGE-TRIM-NATIONAL` |>
  filter(INDICATEUR == "CTTXC",
         REF_AREA == "FR-D976",
         SEXE == "0",
         AGE != "00-24") |>
  quarter_to_date() |>
  filter(date >= as.Date("2017-04-01")) |>

  ggplot() + theme_minimal() + ylab("Taux de chômage (%)") + xlab("") +
  geom_line(aes(x = date, y = OBS_VALUE/100, color = AGE)) +

  scale_x_date(breaks = seq(1920, 2100, 1) |> paste0("-01-01") |> as.Date(),
               labels = date_format("%Y")) +
  theme(legend.position = c(0.9, 0.9),
        legend.title = element_blank()) +
  scale_y_continuous(breaks = 0.01*seq(0, 40, 1),
                     labels = percent_format(accuracy = 1))
| source | dataset | Title | Updated |
|---|---|---|---|
| source | dataset | Title | Updated |
|---|---|---|---|
| source | dataset | Title | Updated |
|---|---|---|---|


