| source | dataset | Title | .html | .rData |
|---|---|---|---|---|
| insee | TAUX-CHOMAGE | Taux de chômage localisé | 2026-07-24 | 2026-07-24 |
Taux de chômage localisé
Données - INSEE
Info
Données sur l’emploi
| source | dataset | Title | .html | .rData |
|---|---|---|---|---|
| insee | TAUX-CHOMAGE | Taux de chômage localisé | 2026-07-24 | 2026-07-24 |
| insee | CHOMAGE-TRIM-NATIONAL | Chômage, taux de chômage par sexe et âge (sens BIT) (1975-) | 2026-07-24 | 2026-07-24 |
| insee | CNA-2014-EMPLOI | Emploi intérieur, durée effective travaillée et productivité horaire | 2026-07-24 | 2026-07-24 |
| insee | DEMANDES-EMPLOIS-NATIONALES | Demandeurs d'emploi inscrits à Pôle Emploi | 2026-07-24 | 2026-07-24 |
| insee | EMPLOI-BIT-TRIM | Emploi, activité, sous-emploi par secteur d’activité (sens BIT) | 2026-07-24 | 2026-07-24 |
| insee | EMPLOI-SALARIE-TRIM-NATIONAL | Estimations d'emploi salarié par secteur d'activité | 2026-07-24 | 2026-07-24 |
| insee | TCRED-EMPLOI-SALARIE-TRIM | Estimations d'emploi salarié par secteur d'activité et par département | 2026-07-24 | 2026-07-24 |
LAST_UPDATE
Code
`TAUX-CHOMAGE` %>%
  group_by(LAST_UPDATE) %>%
  summarise(Nobs = n()) %>%
  arrange(-Nobs) %>%
print_table_conditional()| LAST_UPDATE | Nobs |
|---|---|
| 2026-06-19 | 19715 |
TITLE_FR
Code
`TAUX-CHOMAGE` %>%
  group_by(IDBANK, TITLE_FR) %>%
  summarise(Nobs = n()) %>%
  arrange(-Nobs) %>%
  print_table_conditional()
REF_AREA
Code
`TAUX-CHOMAGE` %>%
  group_by(REF_AREA) %>%
  summarise(Nobs = n()) %>%
  arrange(-Nobs) %>%
  print_table_conditional()
TIME_PERIOD
Code
`TAUX-CHOMAGE` %>%
  group_by(TIME_PERIOD) %>%
  summarise(Nobs = n()) %>%
  arrange(desc(TIME_PERIOD)) %>%
  print_table_conditional()
Taux de chômage localisé
Code
`TAUX-CHOMAGE` %>%
  quarter_to_date %>%
  filter(date == as.Date("2019-07-01")) %>%
  mutate(OBS_VALUE = OBS_VALUE %>% as.numeric) %>%
  select(REF_AREA, TITLE_FR, OBS_VALUE) %>%
  arrange(-OBS_VALUE) %>%
  {if (is_html_output()) datatable(., filter = 'top', rownames = F) else .}
Carte
2019
Code
`TAUX-CHOMAGE` %>%
  quarter_to_date() %>%
  filter(date == as.Date("2019-10-01"),
         grepl("D", REF_AREA)) %>%
  mutate(value = as.numeric(OBS_VALUE),
         depts_code = substr(REF_AREA, 2, 3)) %>%
  select(depts_code, value) %>%
  right_join(france, by = "depts_code") %>%
  ggplot(aes(long, lat, group = group, fill = value/100)) +
  geom_polygon() + coord_map() +
  scale_fill_viridis_c(na.value = "white",
                       labels = scales::percent_format(accuracy = 1),
                       breaks = 0.01*seq(0, 20, 2),
                       name = "Chômage") +
  labs(x = "", y = "", title = "") +
  theme_minimal() + theme(axis.text.x = element_blank(),
                          axis.text.y = element_blank())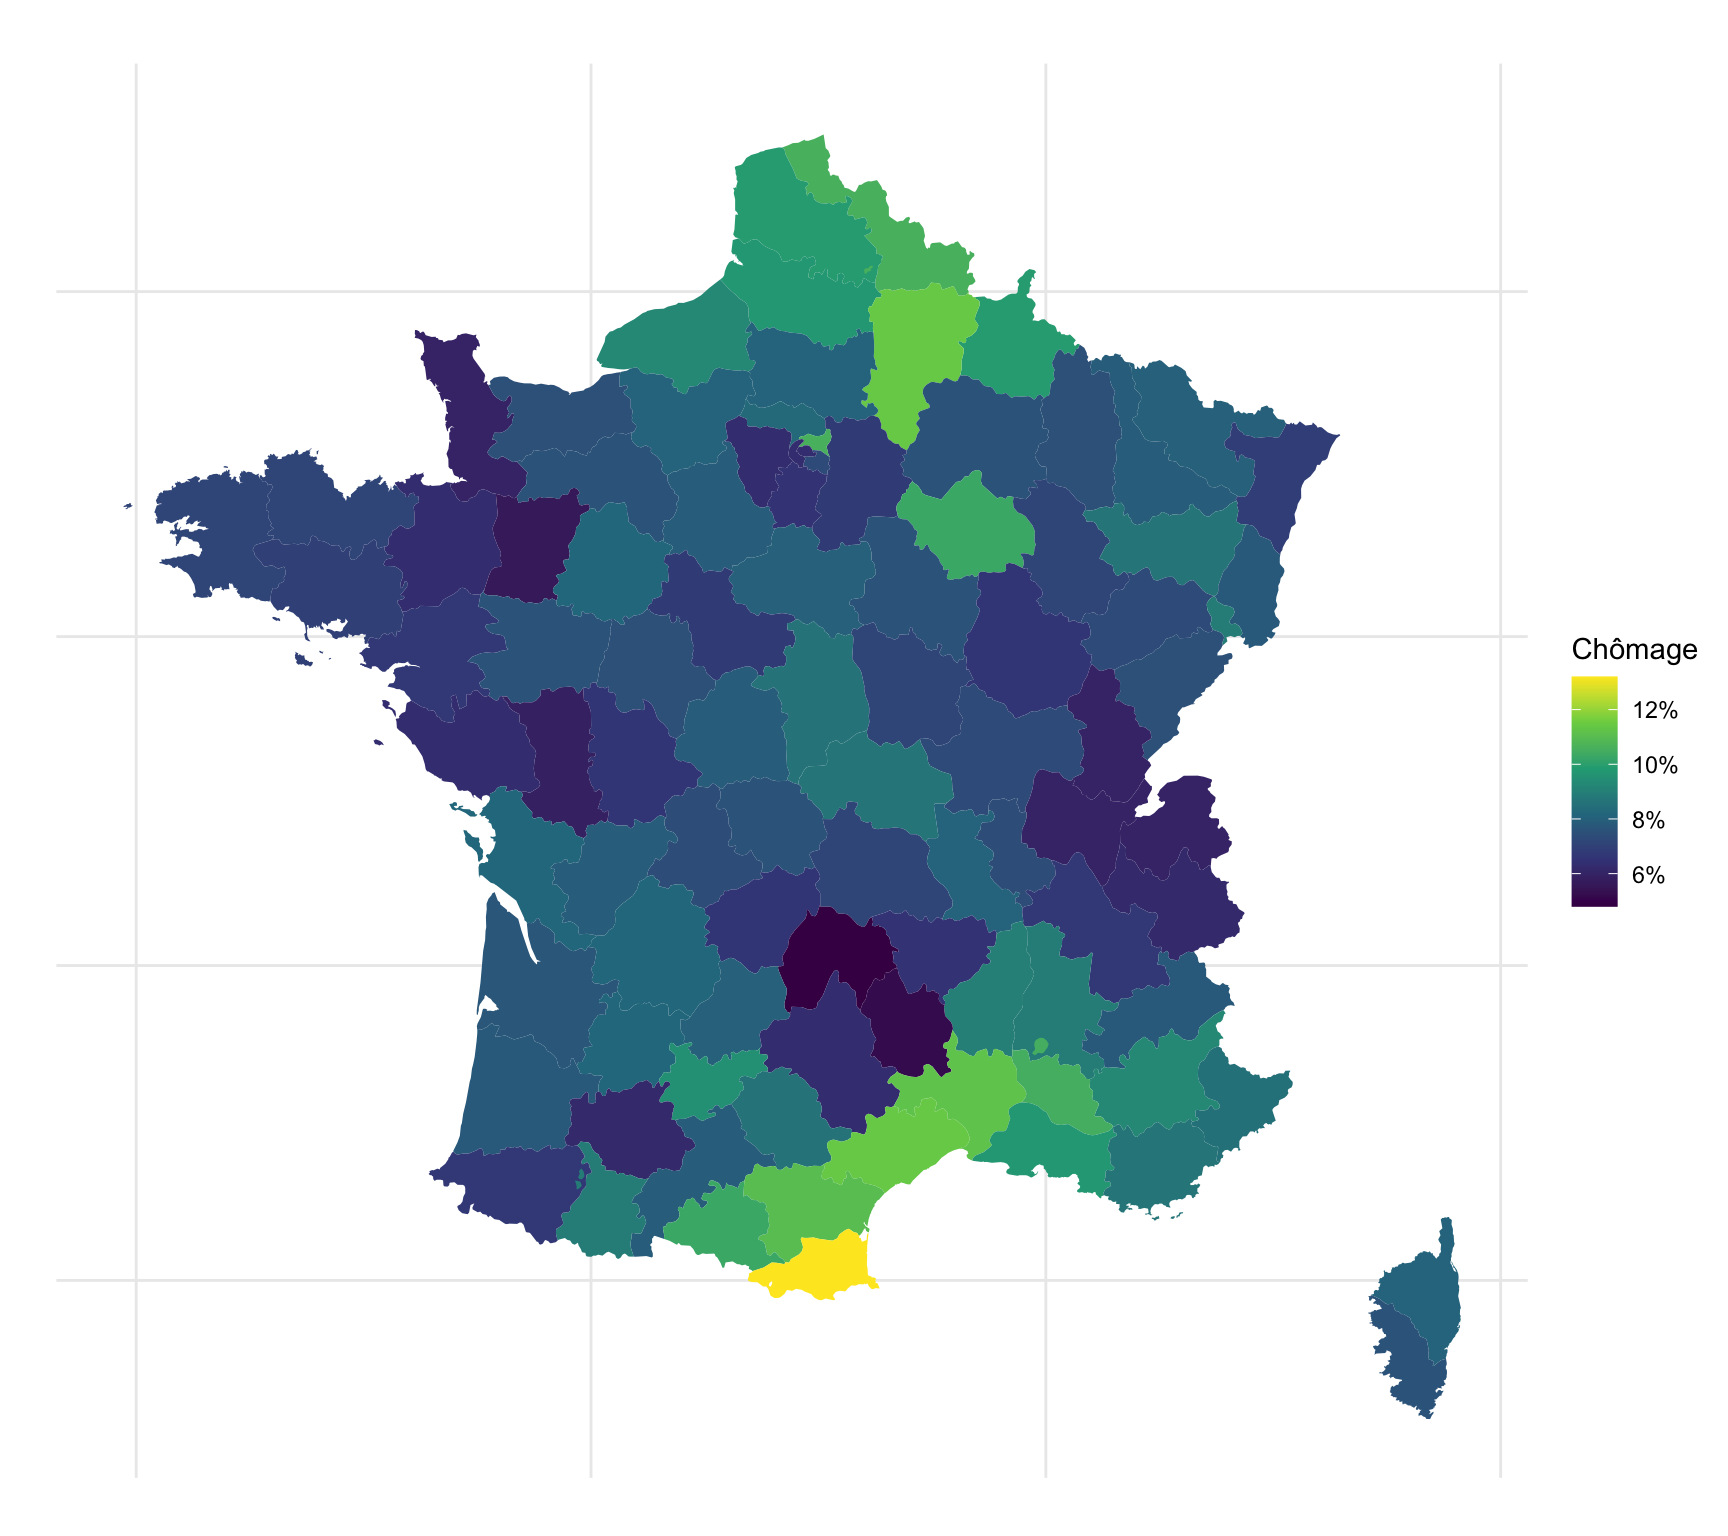
2010
Code
`TAUX-CHOMAGE` %>%
  quarter_to_date() %>%
  filter(date == as.Date("2010-01-01"),
         grepl("D", REF_AREA)) %>%
  mutate(value = as.numeric(OBS_VALUE),
         depts_code = substr(REF_AREA, 2, 3)) %>%
  select(depts_code, value) %>%
  right_join(france, by = "depts_code") %>%
  ggplot(aes(long, lat, group = group, fill = value/100)) +
  geom_polygon() + coord_map() +
  scale_fill_viridis_c(na.value = "white",
                       labels = scales::percent_format(accuracy = 1),
                       breaks = 0.01*seq(0, 20, 2),
                       name = "Chômage") +
  labs(x = "", y = "", title = "") +
  theme_minimal() + theme(axis.text.x = element_blank(),
                          axis.text.y = element_blank())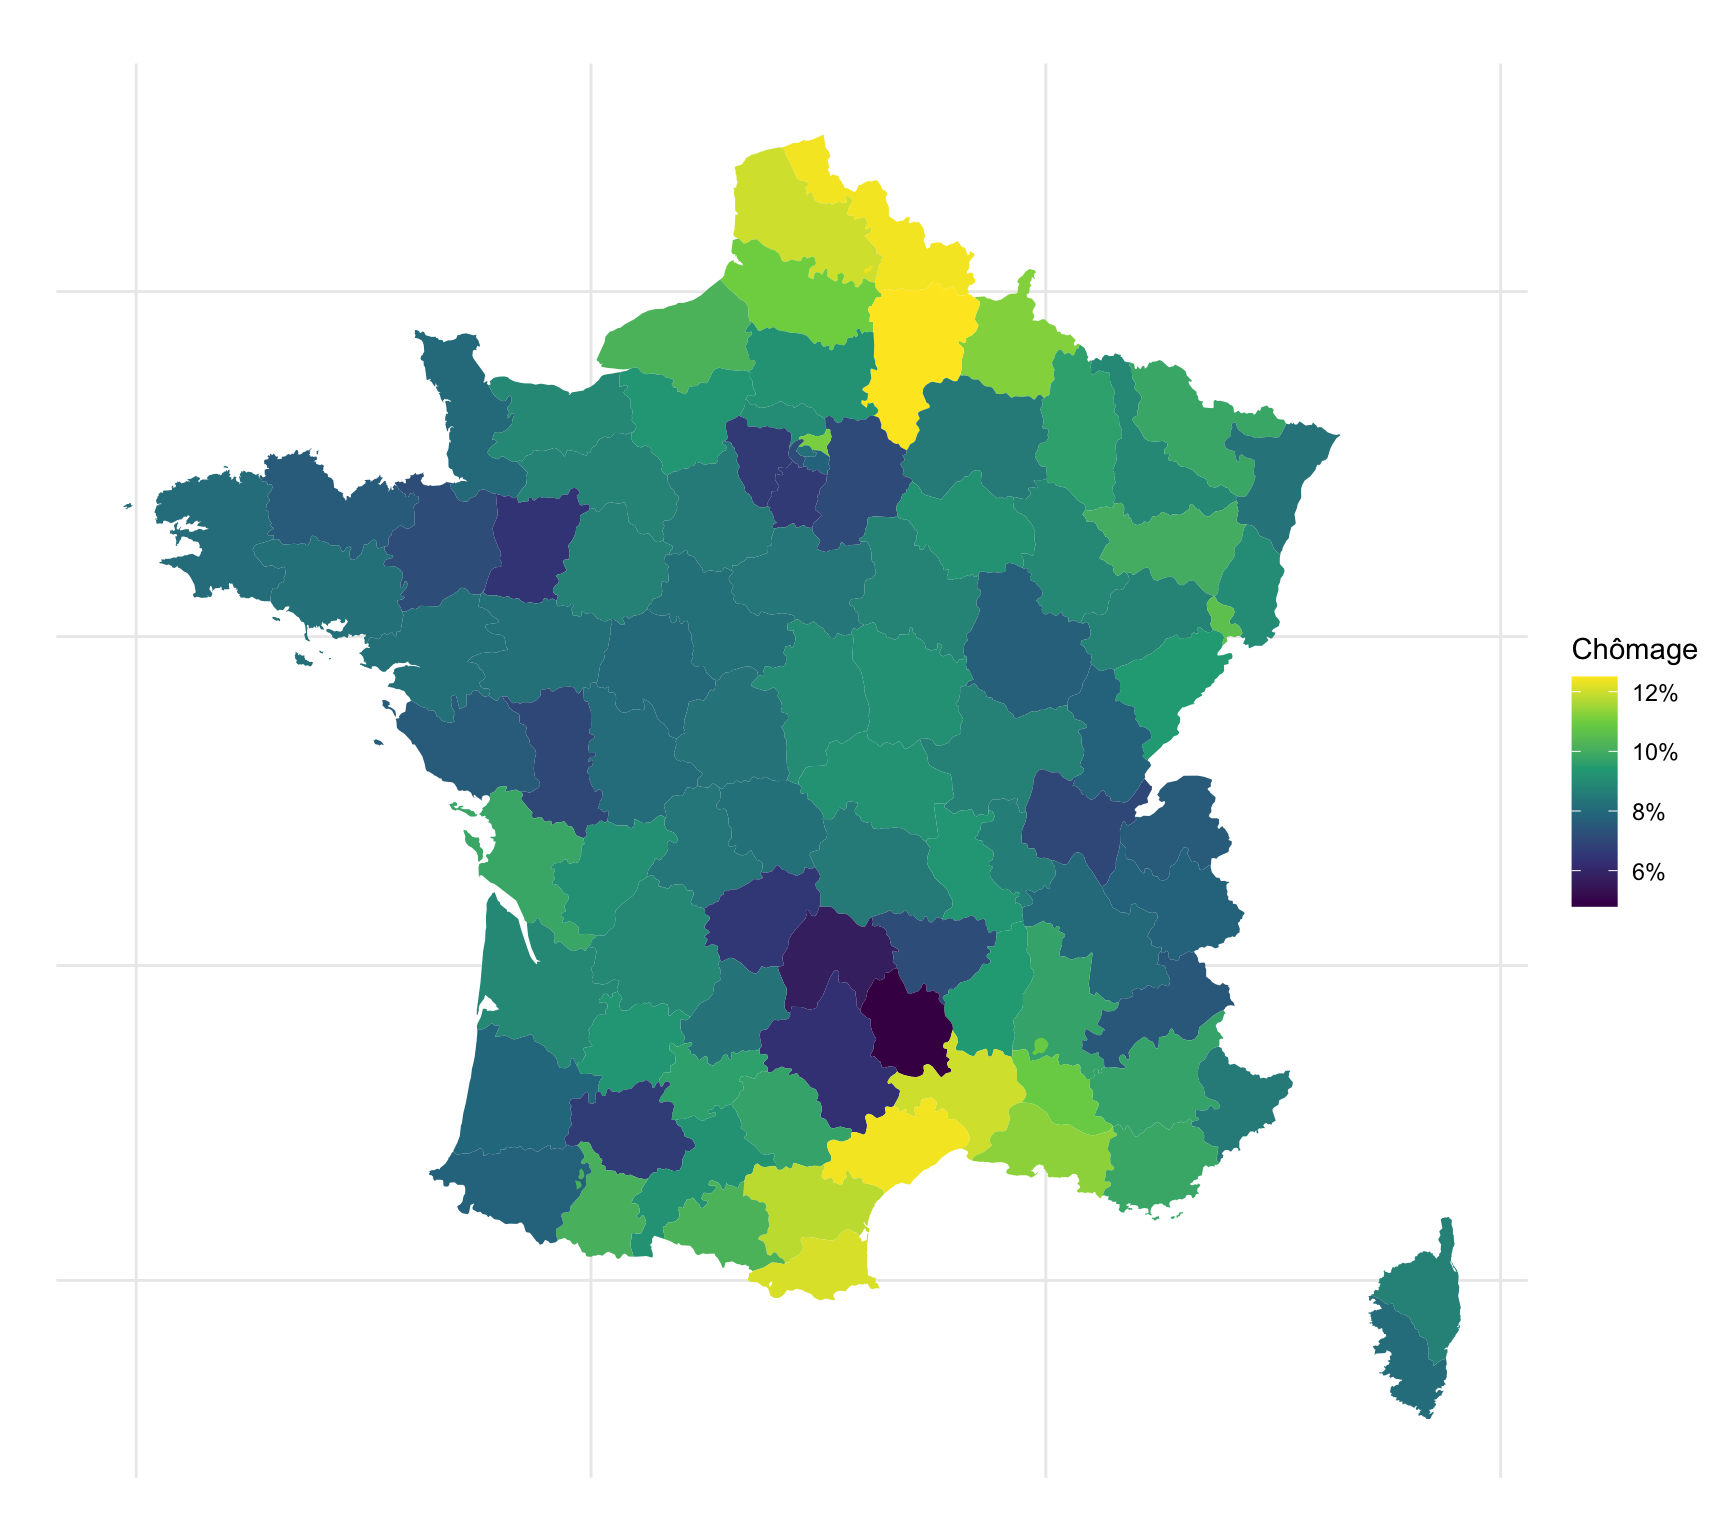
2000
Code
`TAUX-CHOMAGE` %>%
  quarter_to_date() %>%
  filter(date == as.Date("2000-01-01"),
         grepl("D", REF_AREA)) %>%
  mutate(value = as.numeric(OBS_VALUE),
         depts_code = substr(REF_AREA, 2, 3)) %>%
  select(depts_code, value) %>%
  right_join(france, by = "depts_code") %>%
  ggplot(aes(long, lat, group = group, fill = value/100)) +
  geom_polygon() + coord_map() +
  scale_fill_viridis_c(na.value = "white",
                       labels = scales::percent_format(accuracy = 1),
                       breaks = 0.01*seq(0, 20, 2),
                       name = "Chômage") +
  labs(x = "", y = "", title = "") +
  theme_minimal() + theme(axis.text.x = element_blank(),
                          axis.text.y = element_blank())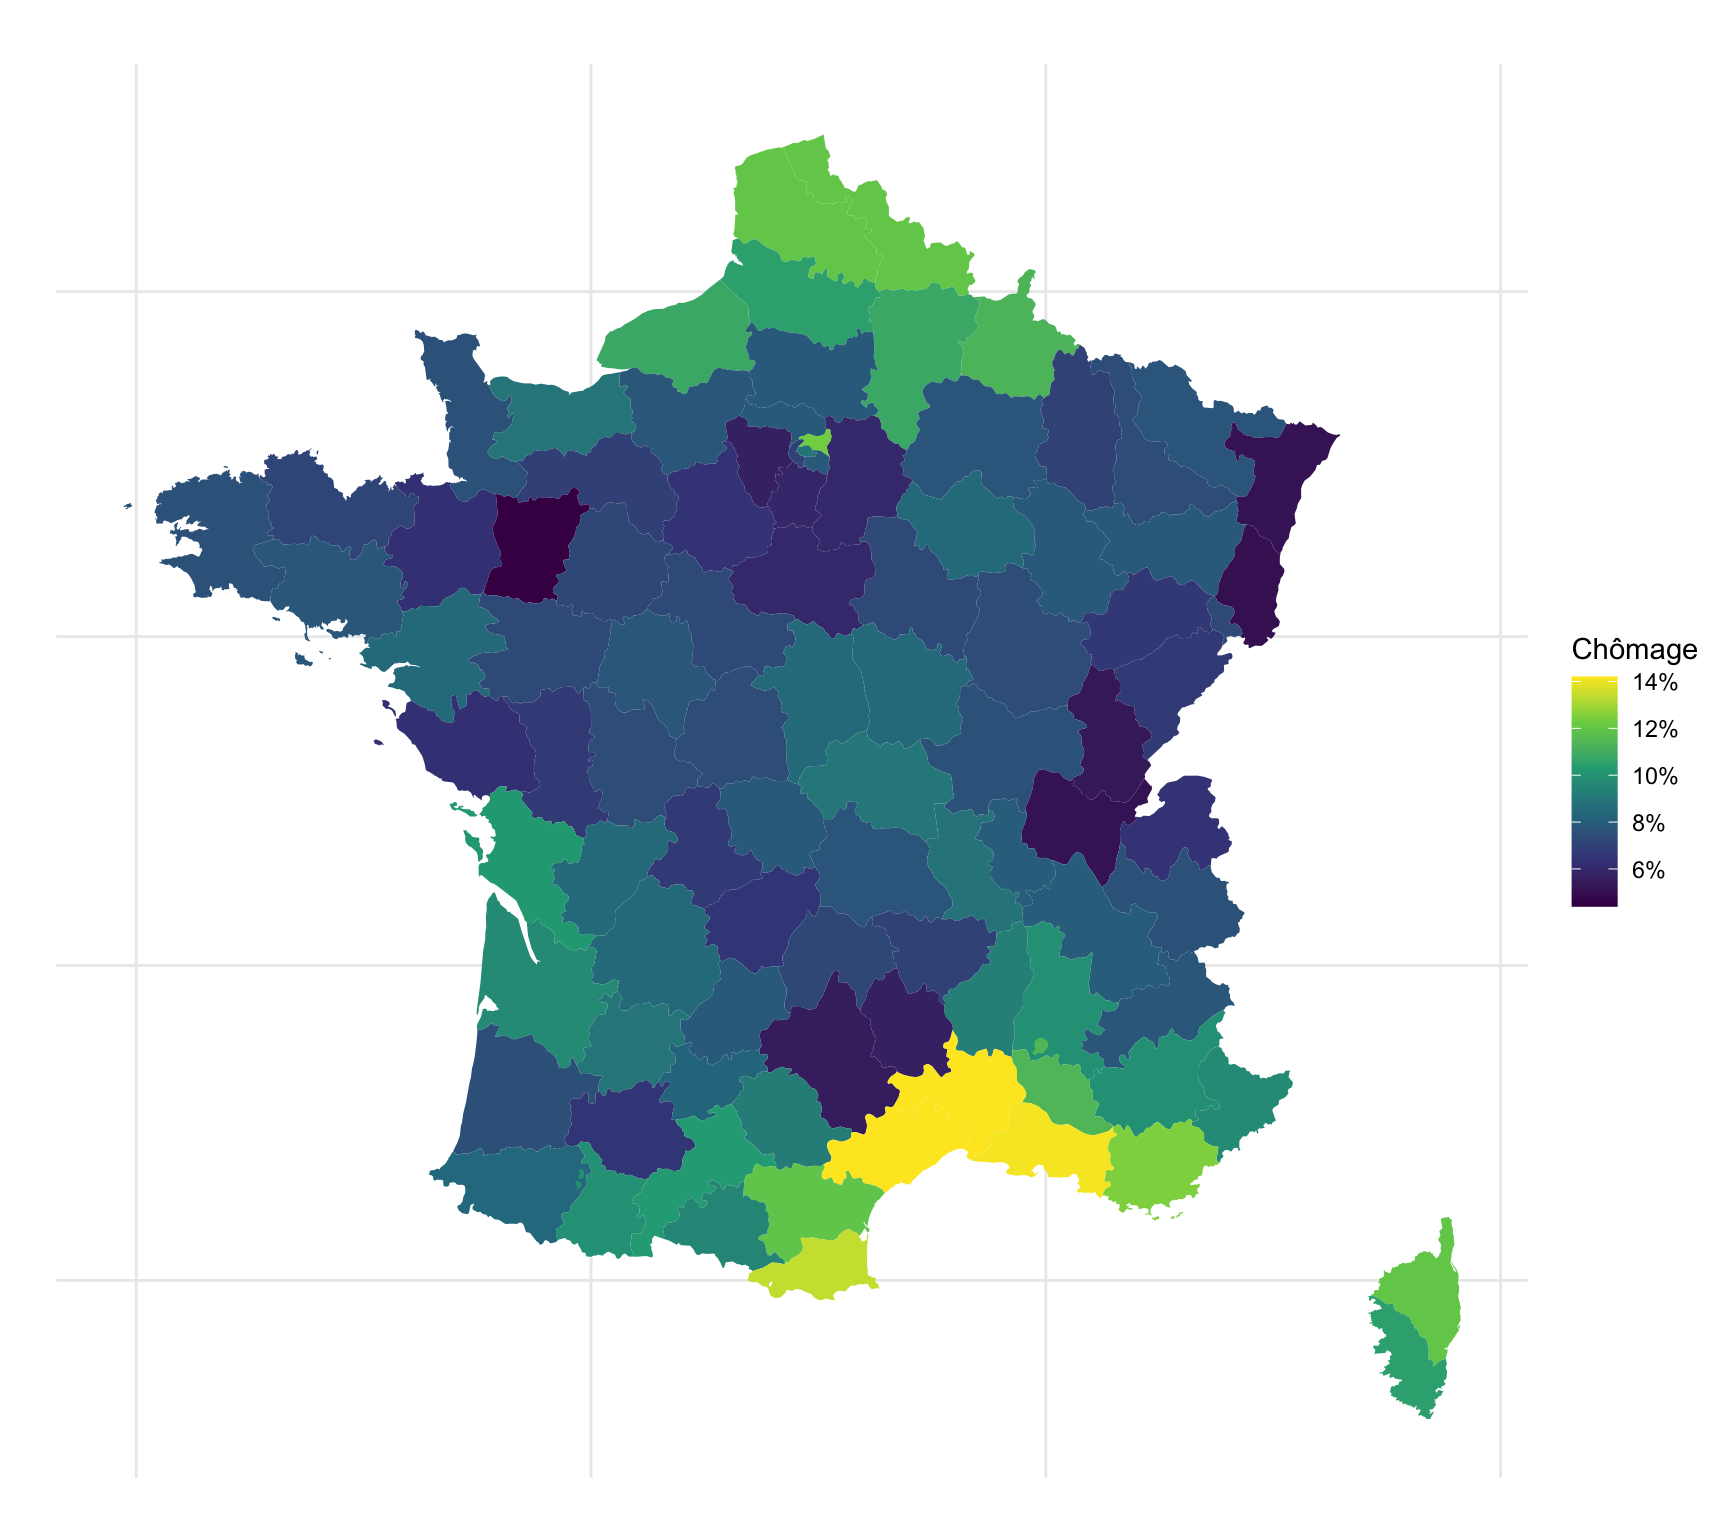
1990
Code
`TAUX-CHOMAGE` %>%
  quarter_to_date() %>%
  filter(date == as.Date("1990-01-01"),
         grepl("D", REF_AREA)) %>%
  mutate(value = as.numeric(OBS_VALUE),
         depts_code = substr(REF_AREA, 2, 3)) %>%
  select(depts_code, value) %>%
  right_join(france, by = "depts_code") %>%
  ggplot(aes(long, lat, group = group, fill = value/100)) +
  geom_polygon() + coord_map() +
  scale_fill_viridis_c(na.value = "white",
                       labels = scales::percent_format(accuracy = 1),
                       breaks = 0.01*seq(0, 20, 2),
                       name = "Chômage") +
  labs(x = "", y = "", title = "") +
  theme_minimal() + theme(axis.text.x = element_blank(),
                          axis.text.y = element_blank())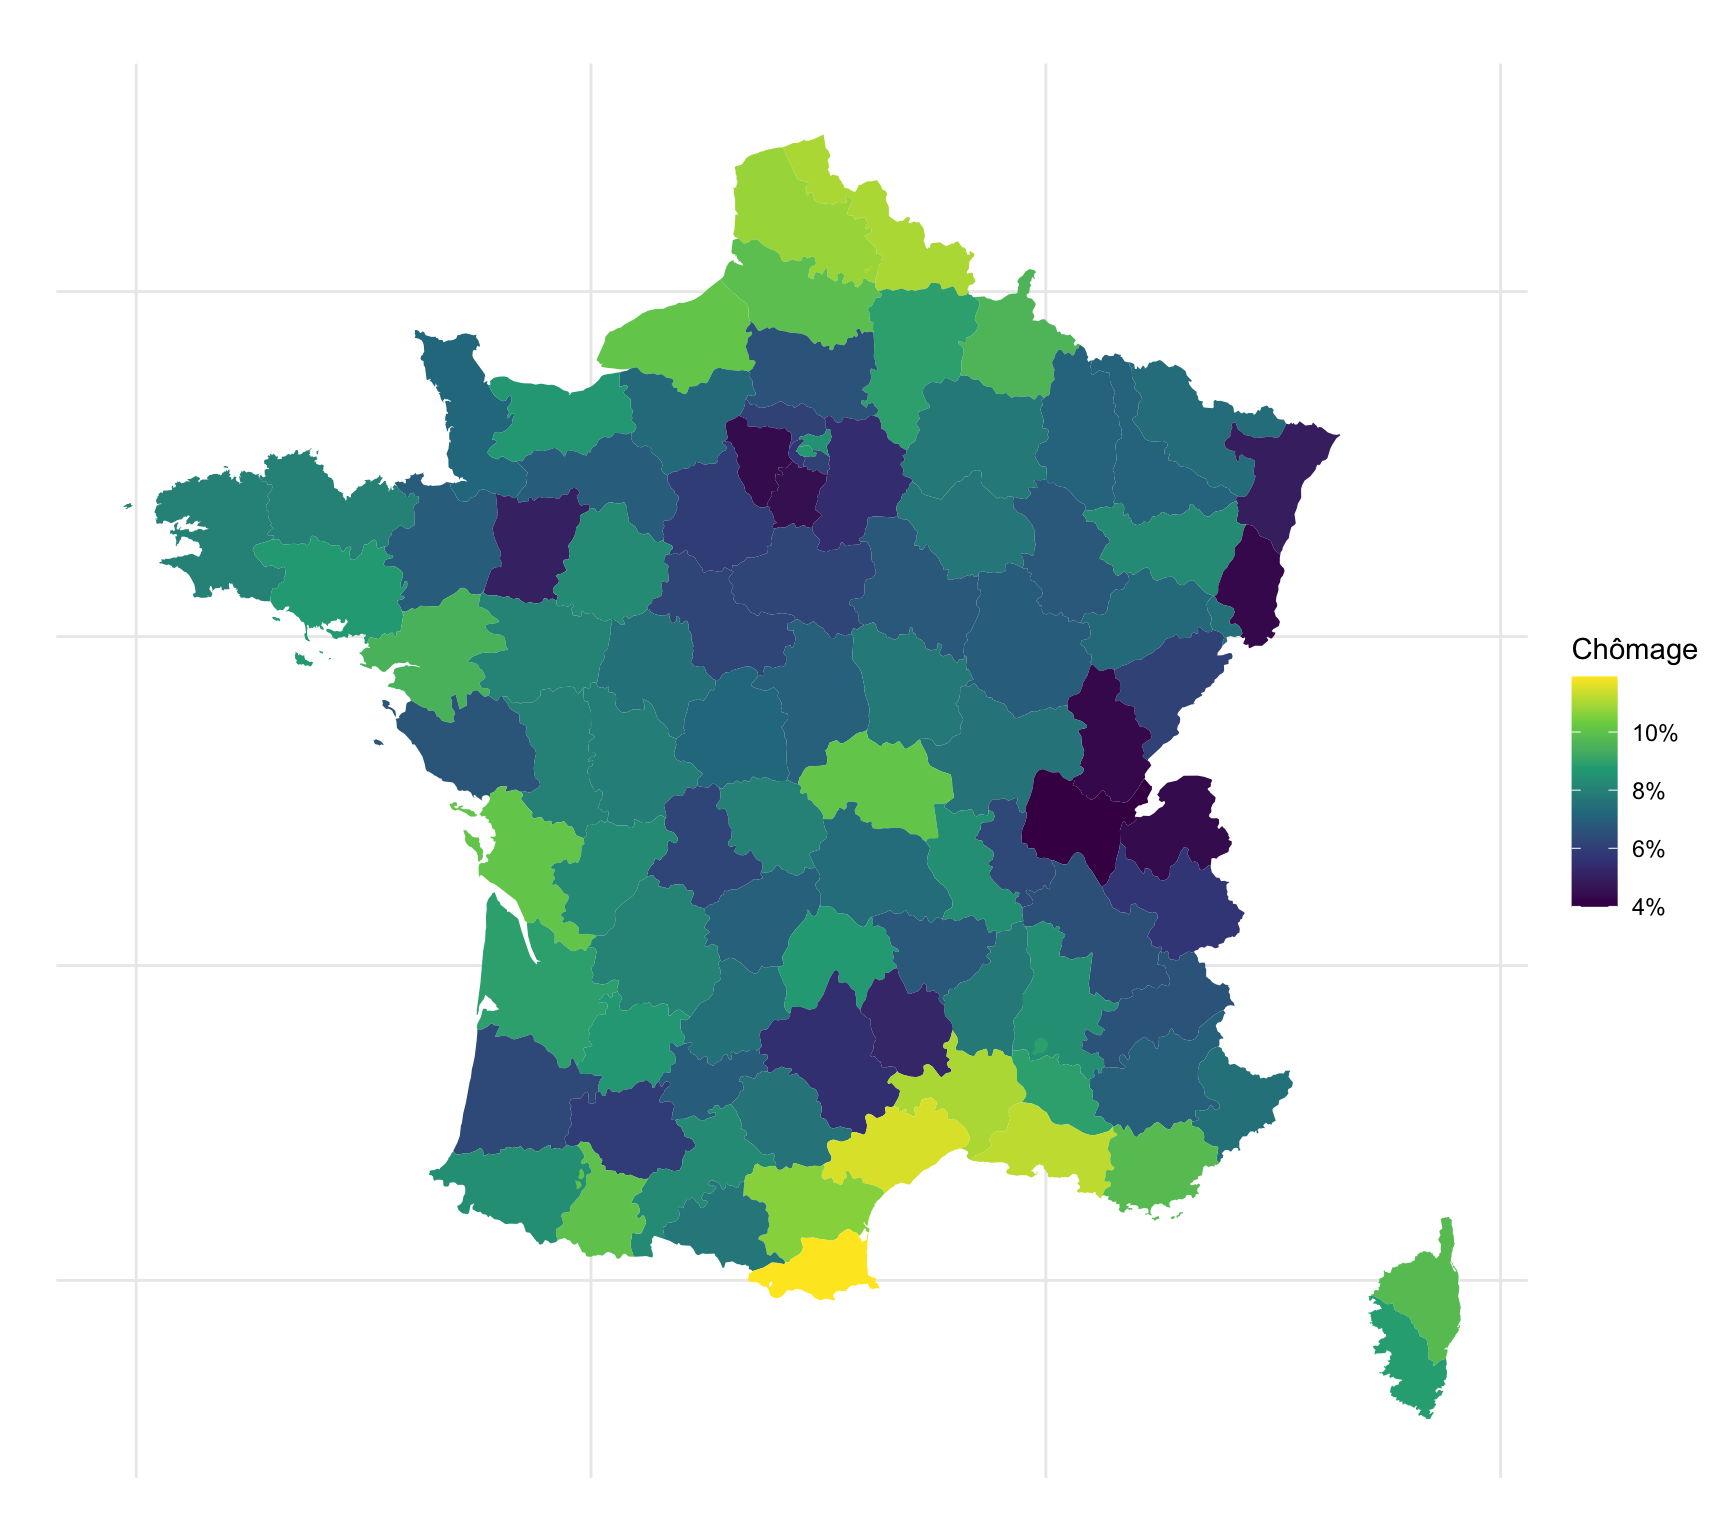
1982
Code
`TAUX-CHOMAGE` %>%
  quarter_to_date() %>%
  filter(date == as.Date("1982-01-01"),
         grepl("D", REF_AREA)) %>%
  mutate(value = as.numeric(OBS_VALUE),
         depts_code = substr(REF_AREA, 2, 3)) %>%
  select(depts_code, value) %>%
  right_join(france, by = "depts_code") %>%
  ggplot(aes(long, lat, group = group, fill = value/100)) +
  geom_polygon() + coord_map() +
  scale_fill_viridis_c(na.value = "white",
                       labels = scales::percent_format(accuracy = 1),
                       breaks = 0.01*seq(0, 20, 2),
                       name = "Chômage") +
  labs(x = "", y = "", title = "") +
  theme_minimal() + theme(axis.text.x = element_blank(),
                          axis.text.y = element_blank())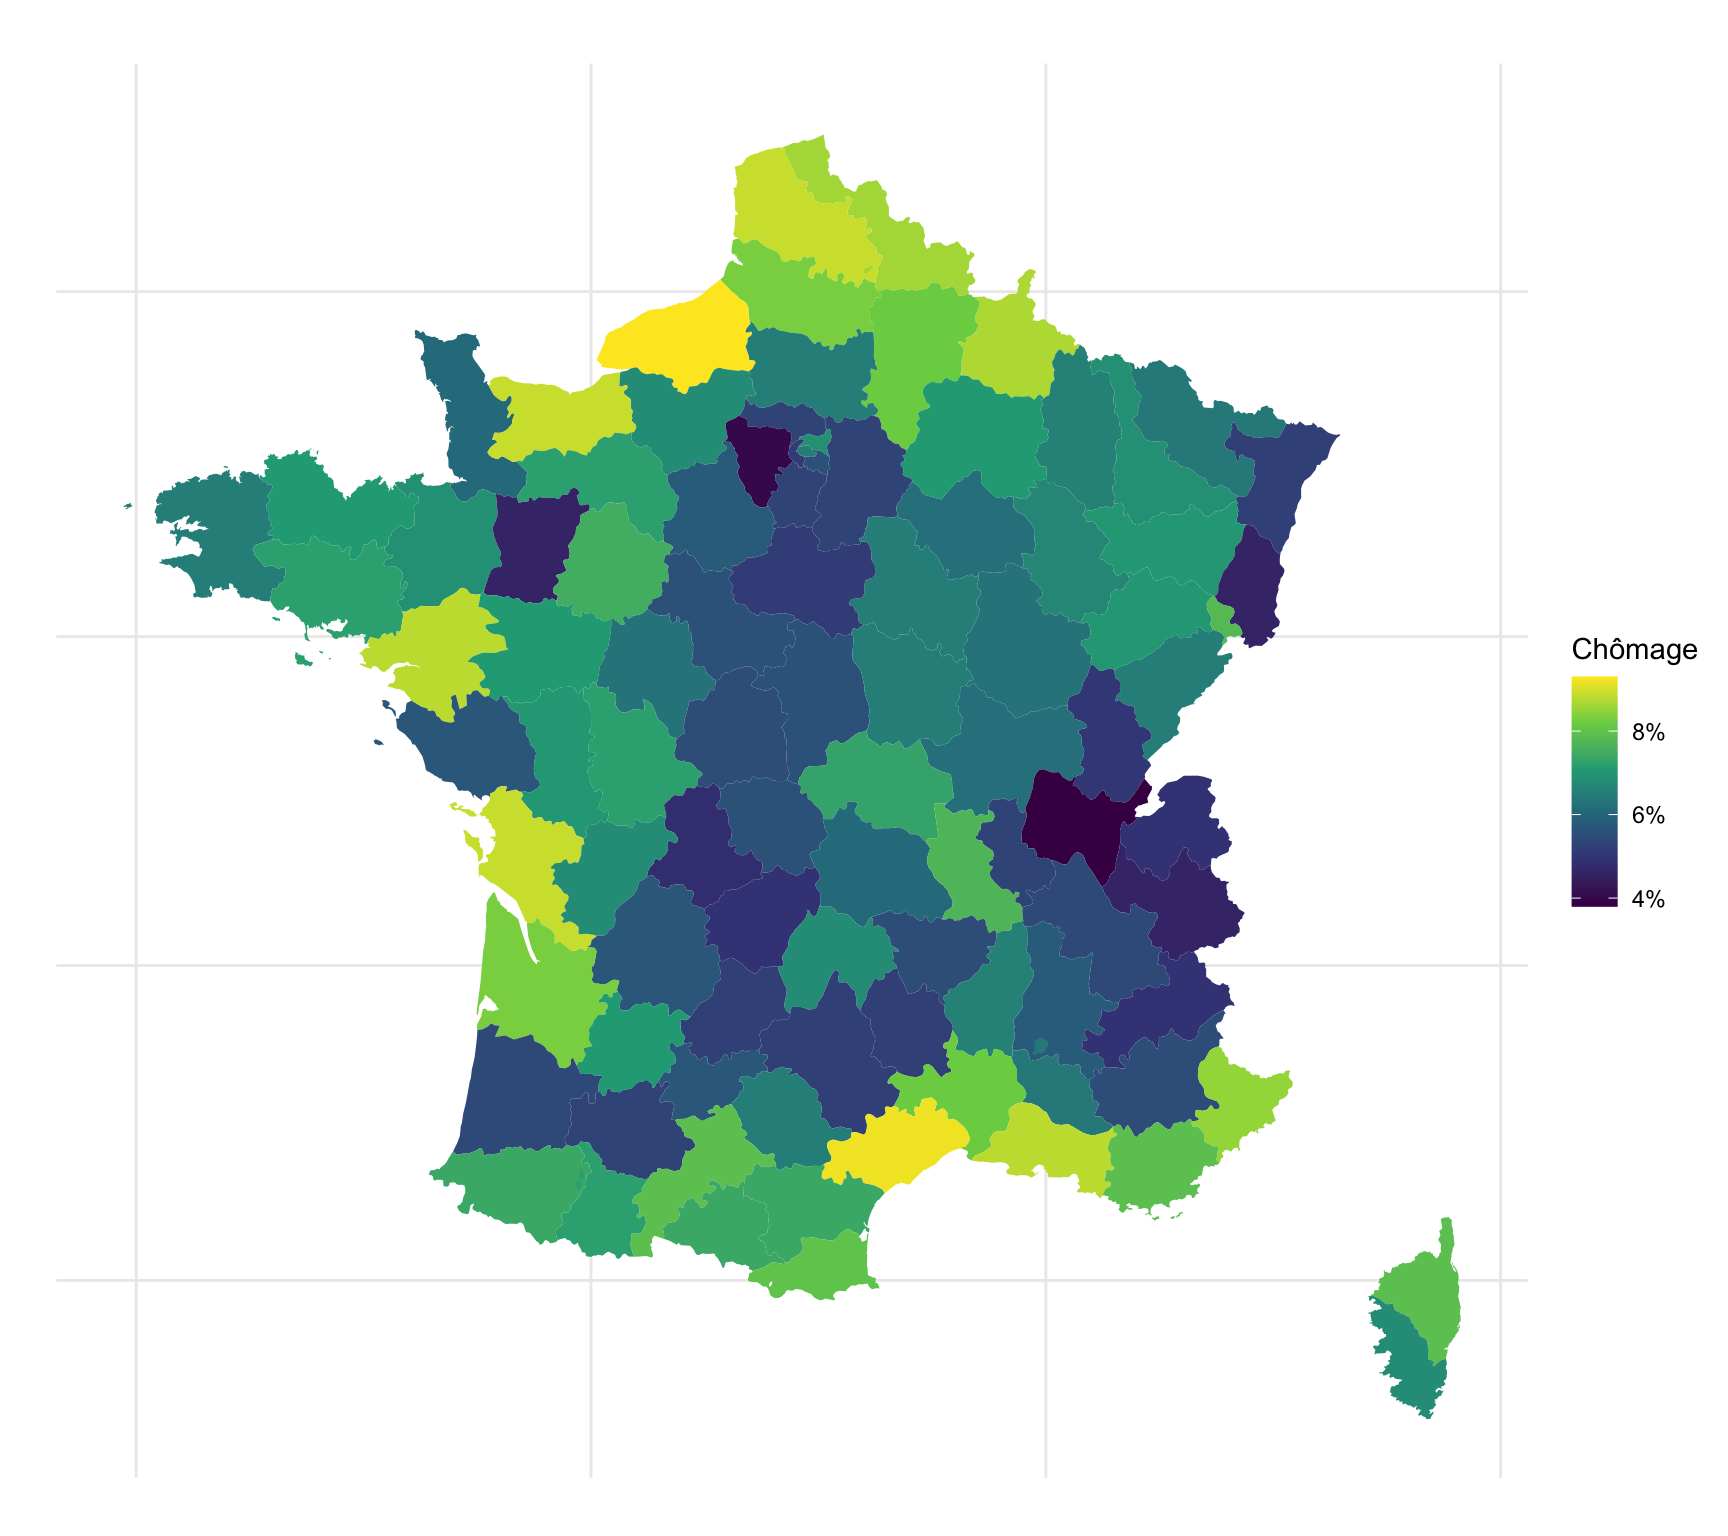
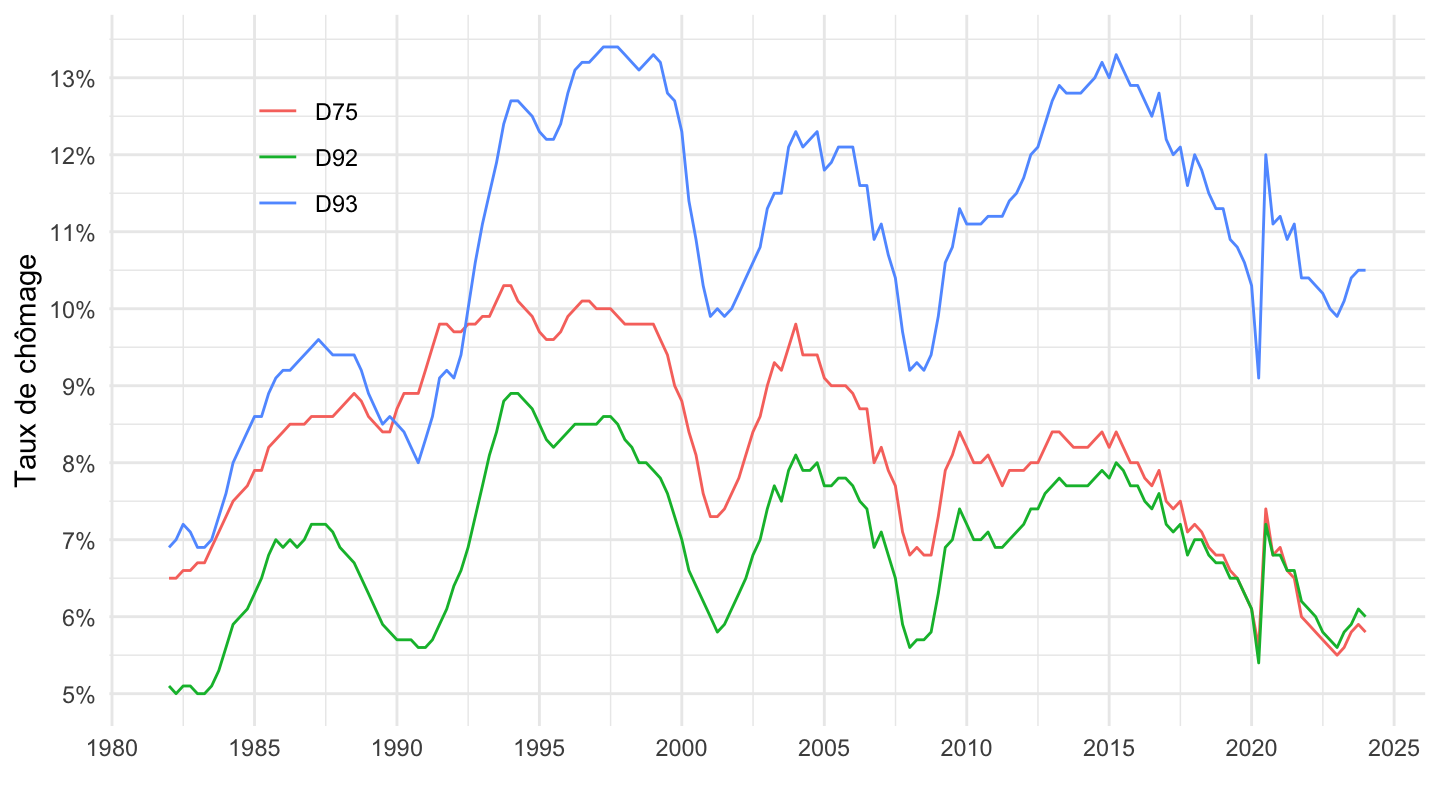
Seine-Saint-Denis, Hauts-de-Seine, Paris
Code
`TAUX-CHOMAGE` %>%
  quarter_to_date() %>%
  filter(REF_AREA %in% c("D92", "D93", "D75")) %>%
  ggplot + geom_line(aes(x = date, y = OBS_VALUE/100, color = REF_AREA)) +
  theme_minimal() + xlab("") + ylab("Taux de chômage") +
  scale_x_date(breaks = seq(1960, 2100, 5) %>% paste0("-01-01") %>% as.Date,
               labels = date_format("%Y")) +
  scale_y_continuous(breaks = 0.01*seq(0, 500, 1),
                labels = percent_format(accuracy = 1)) +
  theme(legend.position = c(0.15, 0.8),
        legend.title = element_blank())