Unemployment - unr
Data - Fred
Info
LAST_COMPILE
| LAST_COMPILE |
|---|
| 2026-02-21 |
Last
| date | Nobs |
|---|---|
| 2026-01-01 | 4 |
variable
| variable | Variable | Nobs |
|---|---|---|
| A08170USA175NNBR | Nonagricultural Employment for United States | 44 |
| A0871AUSA175NNBR | Total Employment for United States | 30 |
| LNS14027659 | Unemployment Rate - Less Than a High School Diploma, 25 Yrs. & over | 409 |
| LNS14027660 | Unemployment Rate - High School Graduates, No College, 25 Yrs. & over | 409 |
| LNS14027662 | Unemployment Rate - Bachelor's Degree and Higher, 25 Yrs. & over | 409 |
| M0892AUSM156SNBR | Unemployment Rate for United States | 159 |
| M08K4BUSM148NNBR | Unemployment for United States | 214 |
| UNRATE | Unemployment Rate | 937 |
Unemployment
1945-
(ref:UNRATE) U.S. Unemployment Rate (Source: FRED).
Code
unr %>%
  filter(variable == "UNRATE") %>%
  mutate(value = value/100) %>%
  ggplot(.) +
  theme_minimal() +
  geom_line(aes(date, value)) +
  geom_rect(data = nber_recessions %>%
              filter(Peak > as.Date("1946-01-01")),
            aes(xmin = Peak, xmax = Trough, ymin = -Inf, ymax = +Inf),
            fill = 'grey', alpha = 0.5) +
  scale_fill_manual(values = c("blue", "red")) +
  scale_y_continuous(breaks = 0.01*seq(-50, 50, 1),
                     labels = scales::percent_format(accuracy = 1)) +
  scale_x_date(breaks = nber_recessions$Peak,
               labels = date_format("%Y")) +
  theme(legend.position = "none") +
  labs(x = "", y = "Unemployment Rate")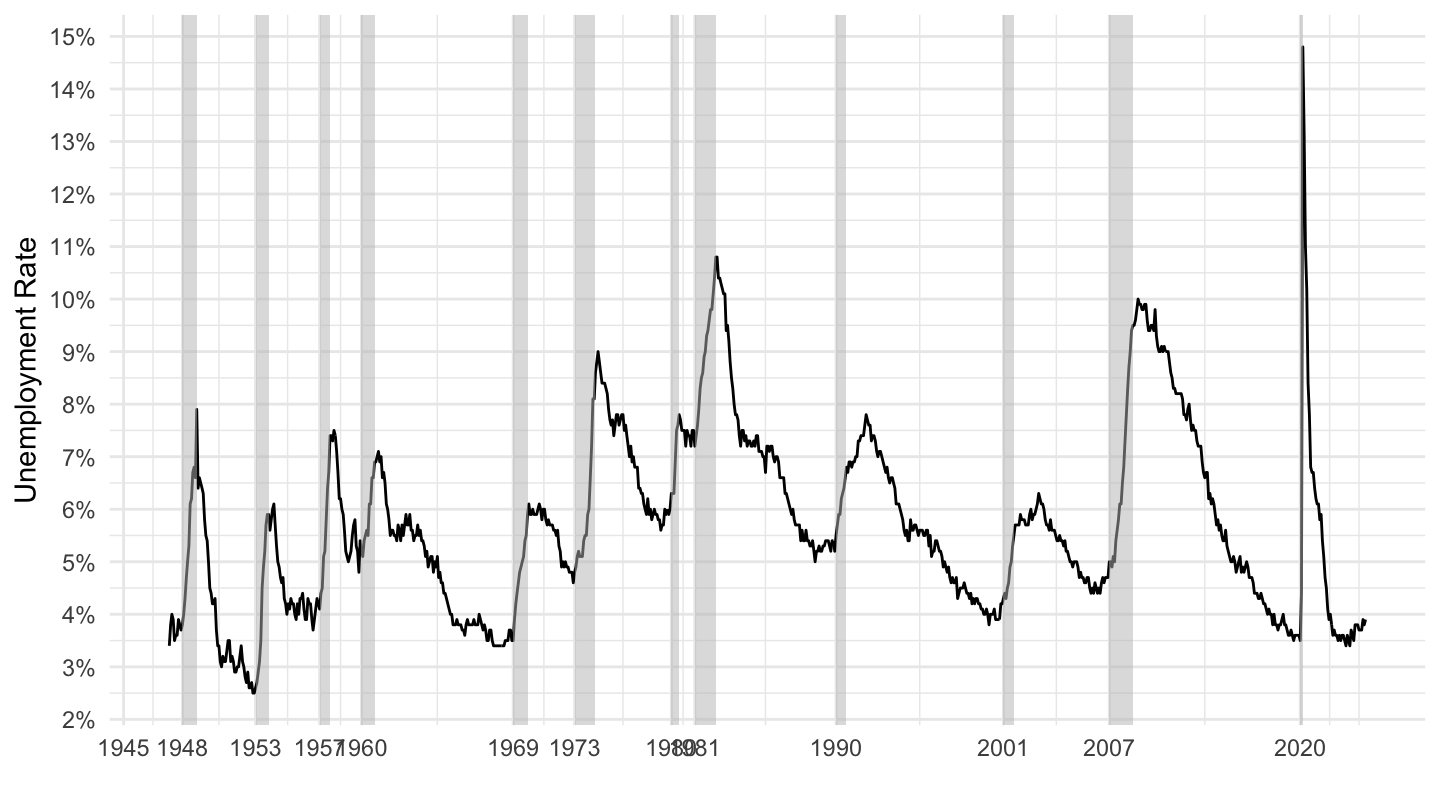
1990-
Code
unr %>%
  filter(variable %in% c("UNRATE"),
         date >= as.Date("1990-01-01")) %>%
  mutate(value = value / 100) %>%
  ggplot(.) + geom_line(aes(x = date, y = value)) + theme_minimal() +
  scale_x_date(breaks = seq(1870, 2100, 5) %>% paste0("-01-01") %>% as.Date,
               labels = date_format("%Y")) +
  scale_y_continuous(breaks = 0.01*seq(3, 15, 0.5),
                     labels = scales::percent_format(accuracy = 0.5)) +
  xlab("") + ylab("Unemployment Rate") +
  geom_vline(xintercept = as.Date("2017-01-20"), linetype = "dashed", color = viridis(3)[2])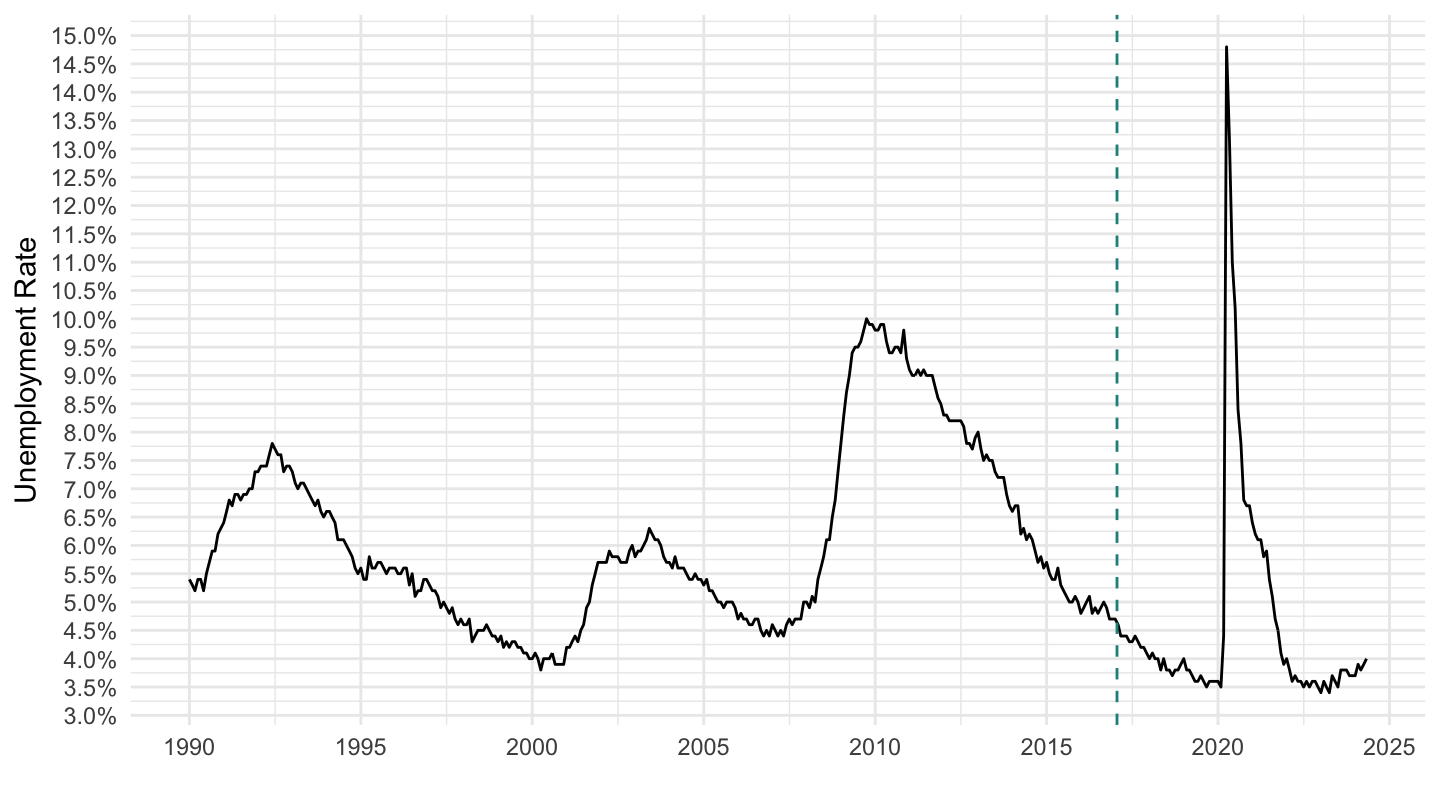
2017-
Code
unr %>%
  filter(variable %in% c("UNRATE"),
         date >= as.Date("2017-01-01")) %>%
  mutate(value = value / 100) %>%
  ggplot(.) + geom_line(aes(x = date, y = value)) + theme_minimal() +
  scale_x_date(breaks = seq(1870, 2100, 1) %>% paste0("-01-01") %>% as.Date,
               labels = date_format("%Y")) +
  scale_y_continuous(breaks = 0.01*seq(3, 15, 0.5),
                     labels = scales::percent_format(accuracy = 0.5)) +
  xlab("") + ylab("Unemployment Rate") +
  geom_vline(xintercept = as.Date("2017-01-20"), linetype = "dashed", color = viridis(3)[2])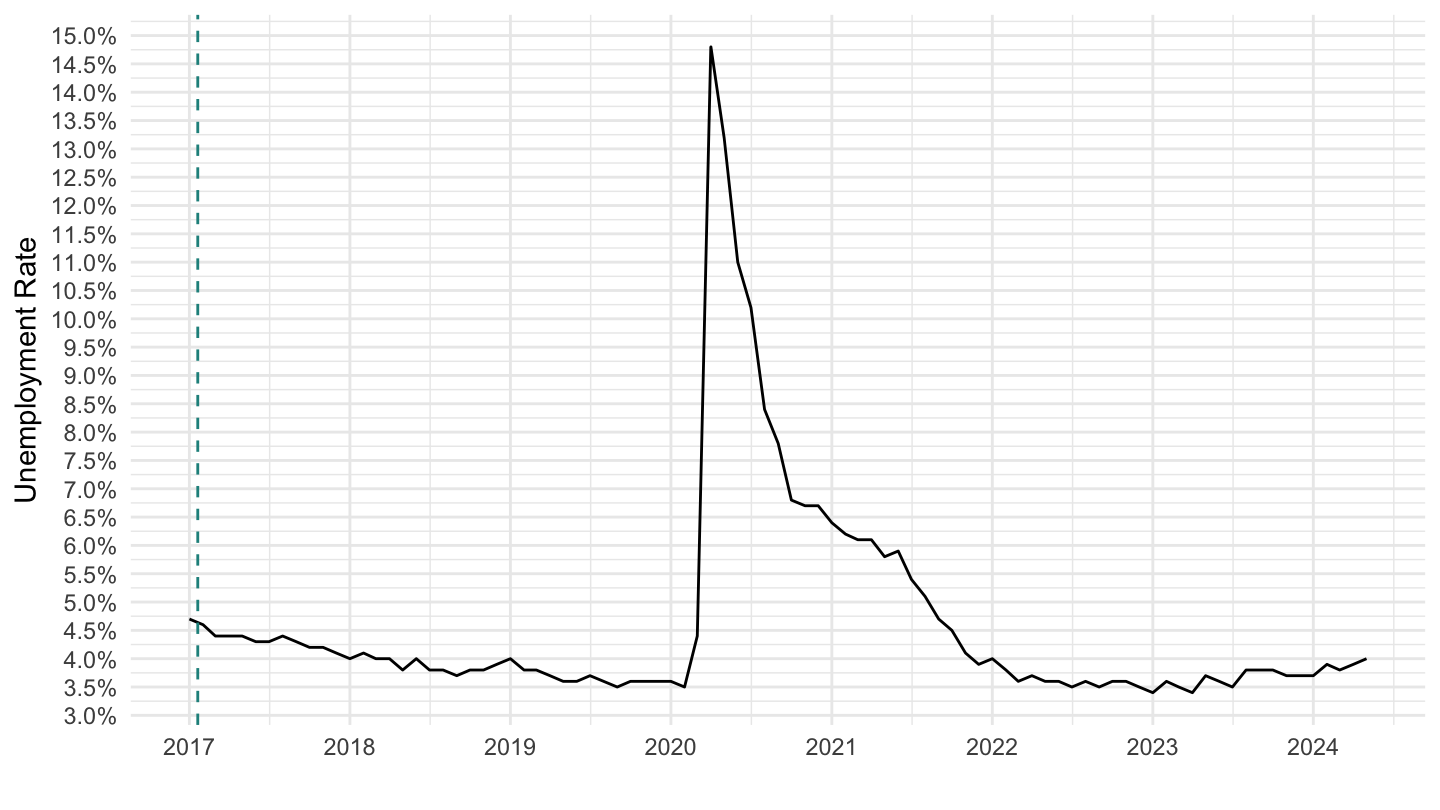
1929 - 1942
(ref:us-unemp-1929-1942) U.S. Unemployment (1929-1942)
Code
unr %>%
  filter(variable == "M0892AUSM156SNBR") %>%
  ggplot(.) +
  geom_line(aes(x = date, y = value / 100)) +
  ylab("Unemployment Rate") + xlab("") +
  geom_rect(data = nber_recessions,
            aes(xmin = Peak, xmax = Trough, ymin = -Inf, ymax = +Inf),
            fill = 'grey', alpha = 0.5) +
  scale_y_continuous(breaks =  0.01*seq(0, 26, 2),
                     labels = scales::percent_format(accuracy = 1)) +
  scale_x_date(breaks = as.Date(paste0(seq(1929, 1942, 1), "-01-01")),
               labels = date_format("%Y"),
               limits = c(as.Date("1929-04-01"), as.Date("1942-06-01"))) +
  theme_minimal() +
  geom_vline(xintercept = as.Date("1929-10-29"), linetype = "dashed", color = "red")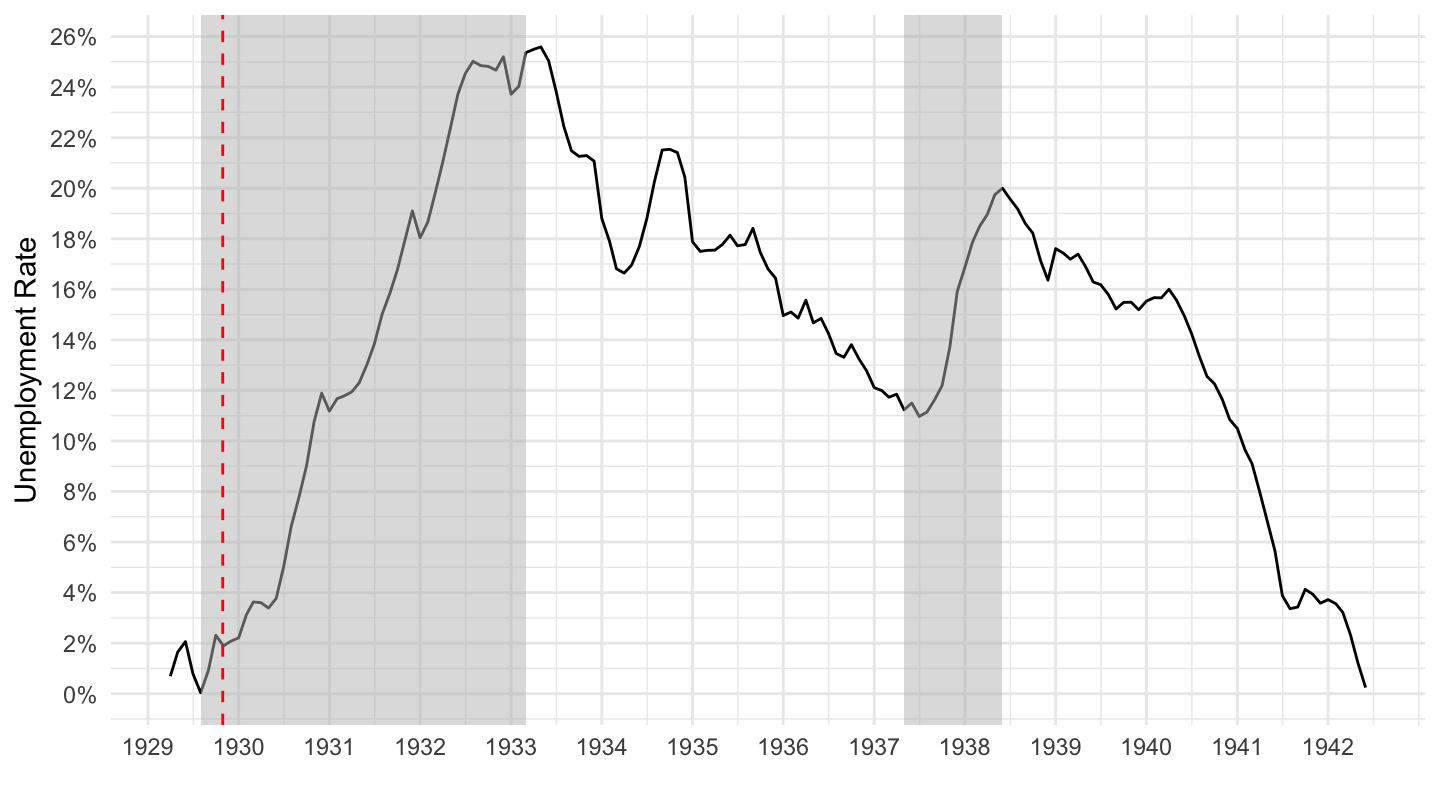
1940 - 1957
(ref:us-unemployment-1940-1957) U.S. Unemployment (1940-1957)
Code
unr %>%
  filter(variable %in% c("M08K4BUSM148NNBR"),
         date >= as.Date("1940-01-01"),
         date <= as.Date("1957-01-01")) %>%
  ggplot(.) +
  geom_line(aes(x = date, y = value)) +
  ylab("Unemployment (Millions)") + xlab("") +
  geom_rect(data = nber_recessions,
            aes(xmin = Peak, xmax = Trough, ymin = -Inf, ymax = +Inf),
            fill = 'grey', alpha = 0.5) +
  scale_y_continuous(breaks = seq(0, 10, 1)) +
  scale_x_date(breaks = as.Date(paste0(seq(1940, 1957, 2), "-01-01")),
               labels = date_format("%Y"),
               limits = c(1940, 1957) %>% paste0("-01-01") %>% as.Date) +
  theme_minimal() +
  geom_vline(xintercept = as.Date("1929-10-29"), linetype = "dashed", color = "red")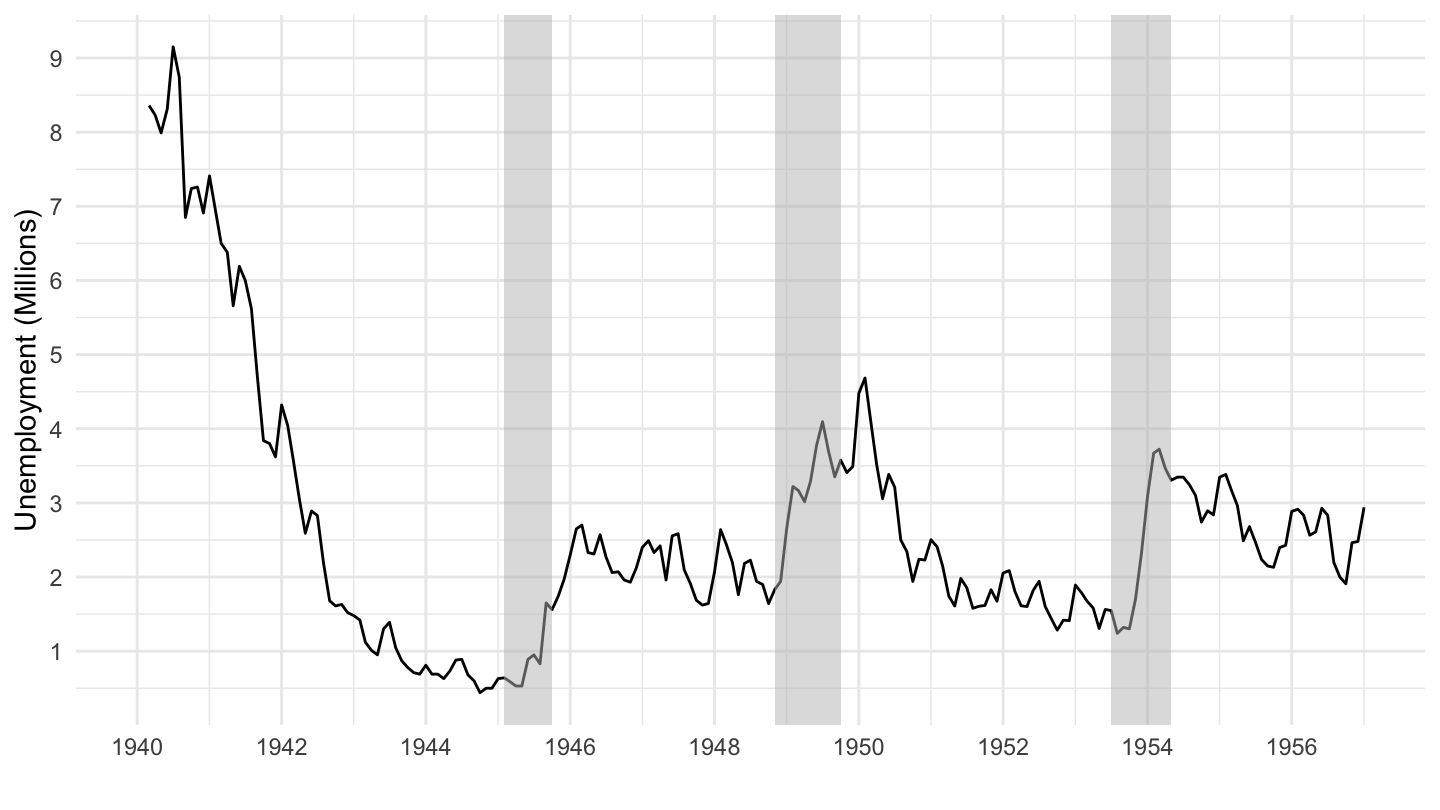
2017 - 2020
Code
unr %>%
  filter(variable %in% c("UNRATE"),
         date >= as.Date("2017-01-01"),
         date <= as.Date("2020-01-01")) %>%
  mutate(value = value / 100) %>%
  ggplot(.) + geom_line(aes(x = date, y = value)) + theme_minimal() +
  scale_x_date(breaks = seq(1870, 2100, 1) %>% paste0("-01-01") %>% as.Date,
               labels = date_format("%Y")) +
  scale_y_continuous(breaks = 0.01*seq(3, 15, 0.5),
                     labels = scales::percent_format(accuracy = 0.5)) +
  xlab("") + ylab("Unemployment Rate") +
  geom_vline(xintercept = as.Date("2017-01-20"), linetype = "dashed", color = viridis(3)[2])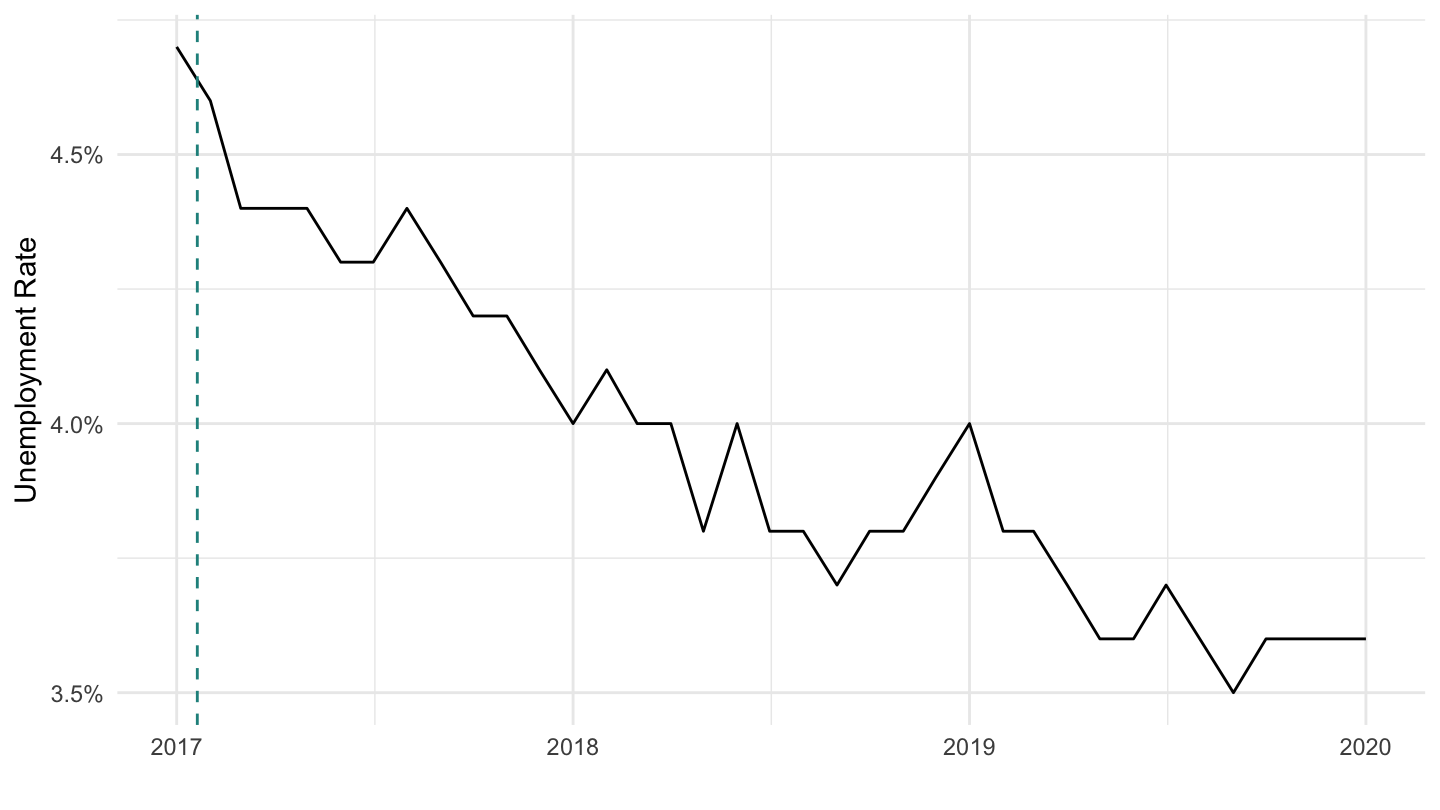
2004-2012
Code
unr %>%
  filter(variable %in% c("UNRATE")) %>%
  filter(date >= as.Date("2004-01-01"),
         date <= as.Date("2012-01-01")) %>%
  mutate(value = value / 100) %>%
  ggplot(.) + geom_line(aes(x = date, y = value)) + theme_minimal() +
  scale_x_date(breaks = seq(1870, 2100, 1) %>% paste0("-01-01") %>% as.Date,
               labels = date_format("%Y")) +
  scale_y_continuous(breaks = 0.01*seq(3, 15, 0.5),
                     labels = scales::percent_format(accuracy = 0.5)) +
  xlab("") + ylab("Unemployment Rate") +
  geom_vline(xintercept = as.Date("2008-09-15"), linetype = "dashed", color = viridis(3)[2]) +
    geom_rect(data = data_frame(start = as.Date("2004-06-01"),
                                end = as.Date("2007-08-01")),
              aes(xmin = start, xmax = end, ymin = -Inf, ymax = +Inf),
              fill = viridis(4)[4], alpha = 0.2) +
    geom_vline(xintercept = as.Date("2004-06-01"), linetype = "dashed", color = viridis(4)[4]) +
    geom_vline(xintercept = as.Date("2007-08-01"), linetype = "dashed", color = viridis(4)[4])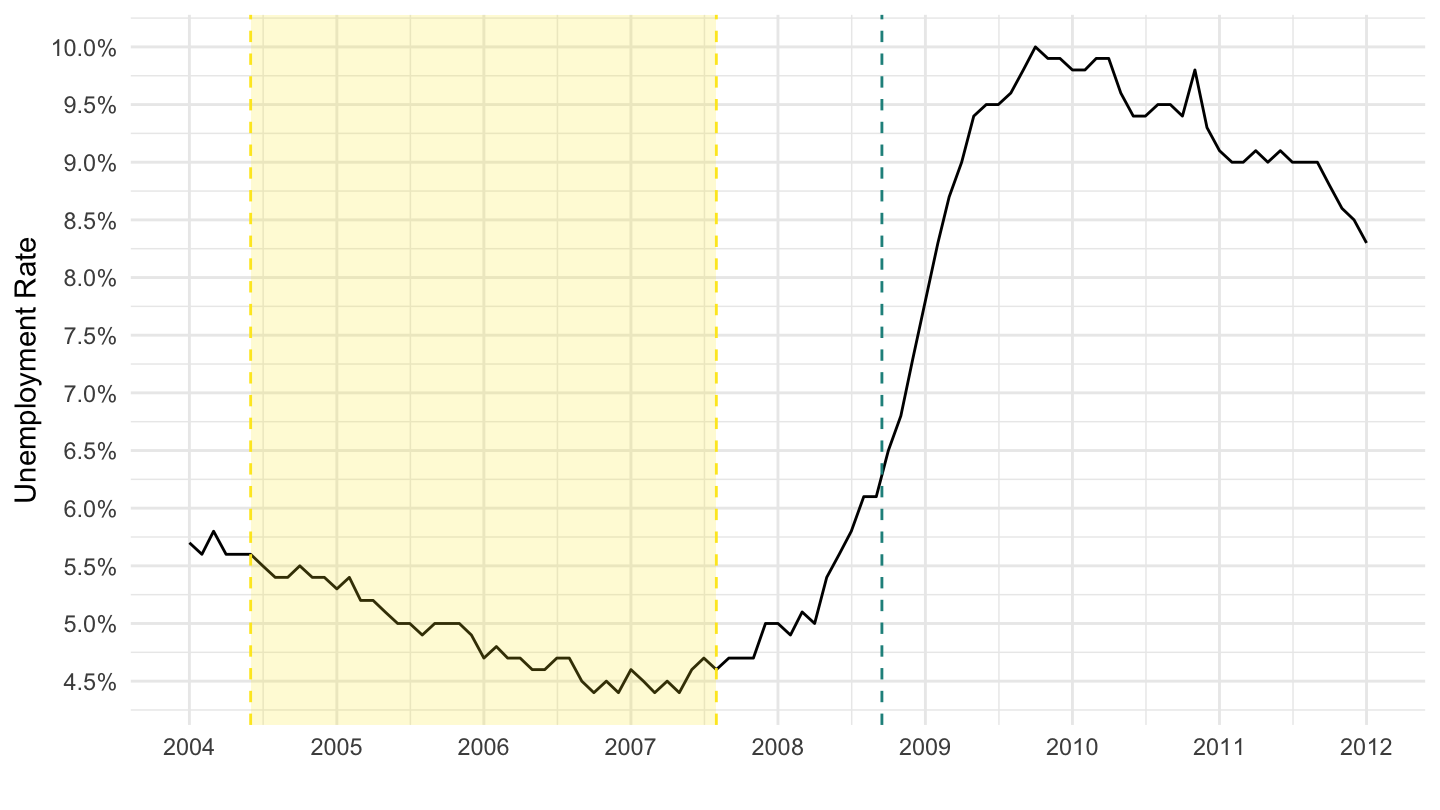
2004 - 2012
Code
unr %>%
  filter(date >= as.Date("2014-01-01"),
         date <= as.Date("2020-02-01"),
         variable != "UNRATE") %>%
  mutate(value = value / 100) %>%
  left_join(variable, by = "variable") %>%
  ggplot(.) + geom_line(aes(x = date, y = value, color = Variable)) + theme_minimal() +
  scale_x_date(breaks = seq(1870, 2100, 1) %>% paste0("-01-01") %>% as.Date,
               labels = date_format("%Y")) +
  scale_y_continuous(breaks = 0.01*seq(0, 15, 1),
                     labels = scales::percent_format(accuracy = 1)) +
  xlab("") + ylab("Unemployment Rate") +

  theme(legend.title = element_blank(),
        legend.position = c(0.6, 0.9)) +
  geom_vline(xintercept = as.Date("2017-01-20"), linetype = "dashed", color = "black")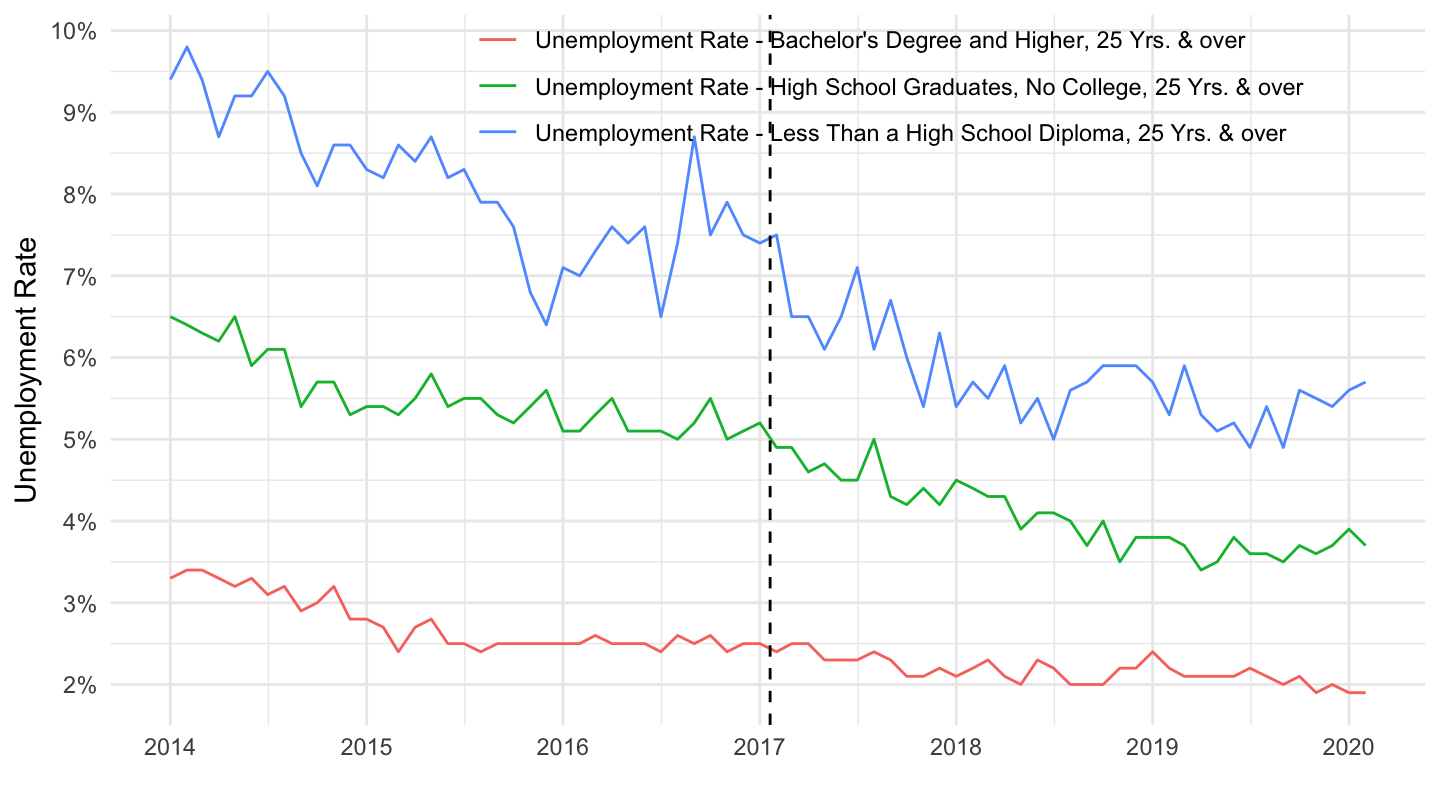
1987-1993
Code
unr %>%
  filter(variable %in% c("UNRATE")) %>%
  filter(date >= as.Date("1987-01-01"),
         date <= as.Date("1993-01-01")) %>%
  mutate(value = value / 100) %>%
  ggplot(.) + geom_line(aes(x = date, y = value)) + theme_minimal() +
  scale_x_date(breaks = seq(1870, 2100, 1) %>% paste0("-01-01") %>% as.Date,
               labels = date_format("%Y")) +
  scale_y_continuous(breaks = 0.01*seq(3, 15, 0.5),
                     labels = scales::percent_format(accuracy = 0.5)) +
  xlab("") + ylab("Unemployment Rate") +
  geom_vline(xintercept = as.Date("2008-09-15"), linetype = "dashed", color = viridis(3)[2])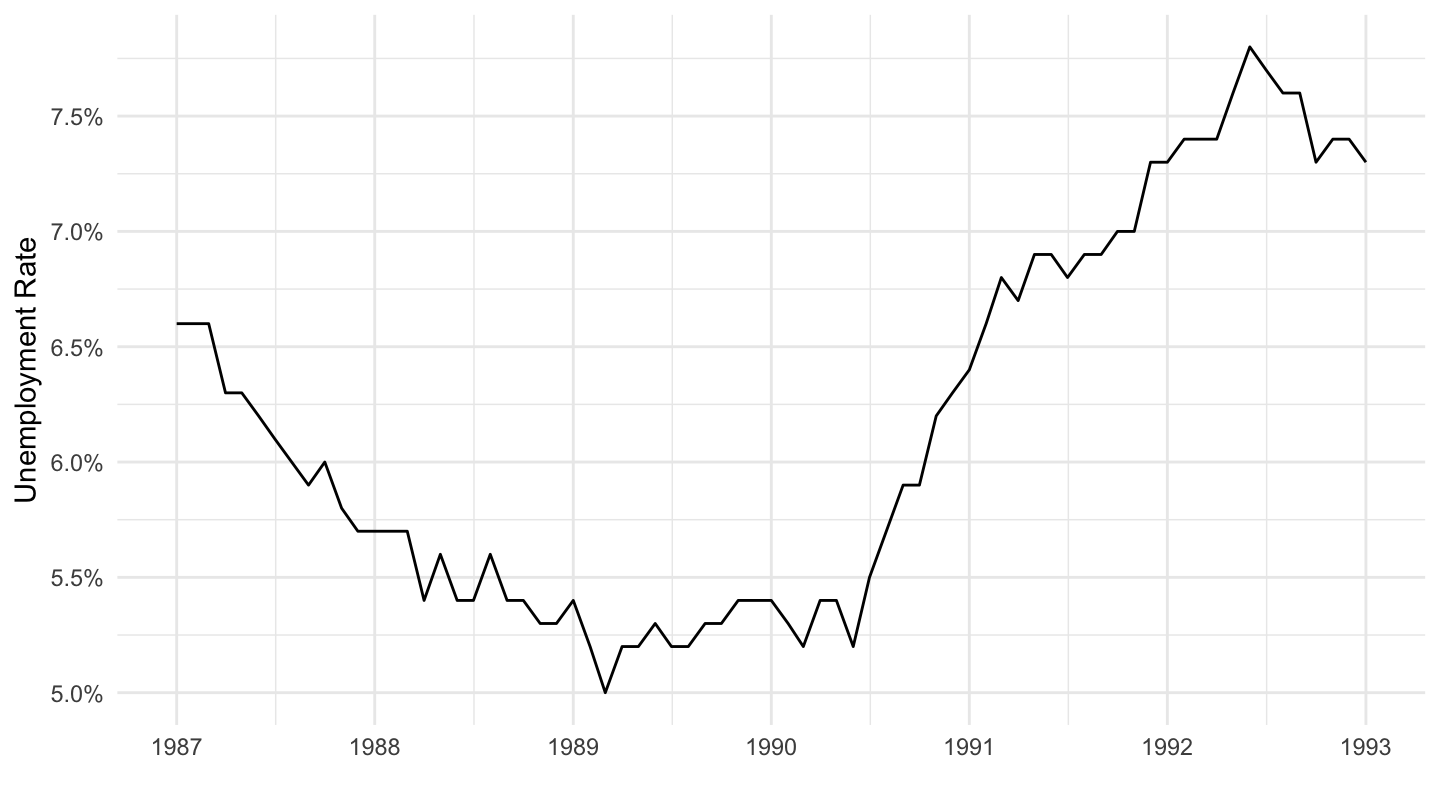
1995 - 2000
Code
unr %>%
  filter(date >= as.Date("1995-01-01"),
         date <= as.Date("2000-02-01"),
         variable == "UNRATE") %>%
  mutate(value = value / 100) %>%
  left_join(variable, by = "variable") %>%
  ggplot(.) + geom_line(aes(x = date, y = value, color = Variable)) + theme_minimal() +
  scale_x_date(breaks = seq(1870, 2100, 1) %>% paste0("-01-01") %>% as.Date,
               labels = date_format("%Y")) +
  scale_y_continuous(breaks = 0.01*seq(0, 15, .1),
                     labels = scales::percent_format(accuracy = .1)) +
  xlab("") + ylab("Unemployment Rate") +

  theme(legend.title = element_blank(),
        legend.position = c(0.6, 0.9)) +
  geom_vline(xintercept = as.Date("2017-01-20"), linetype = "dashed", color = "black")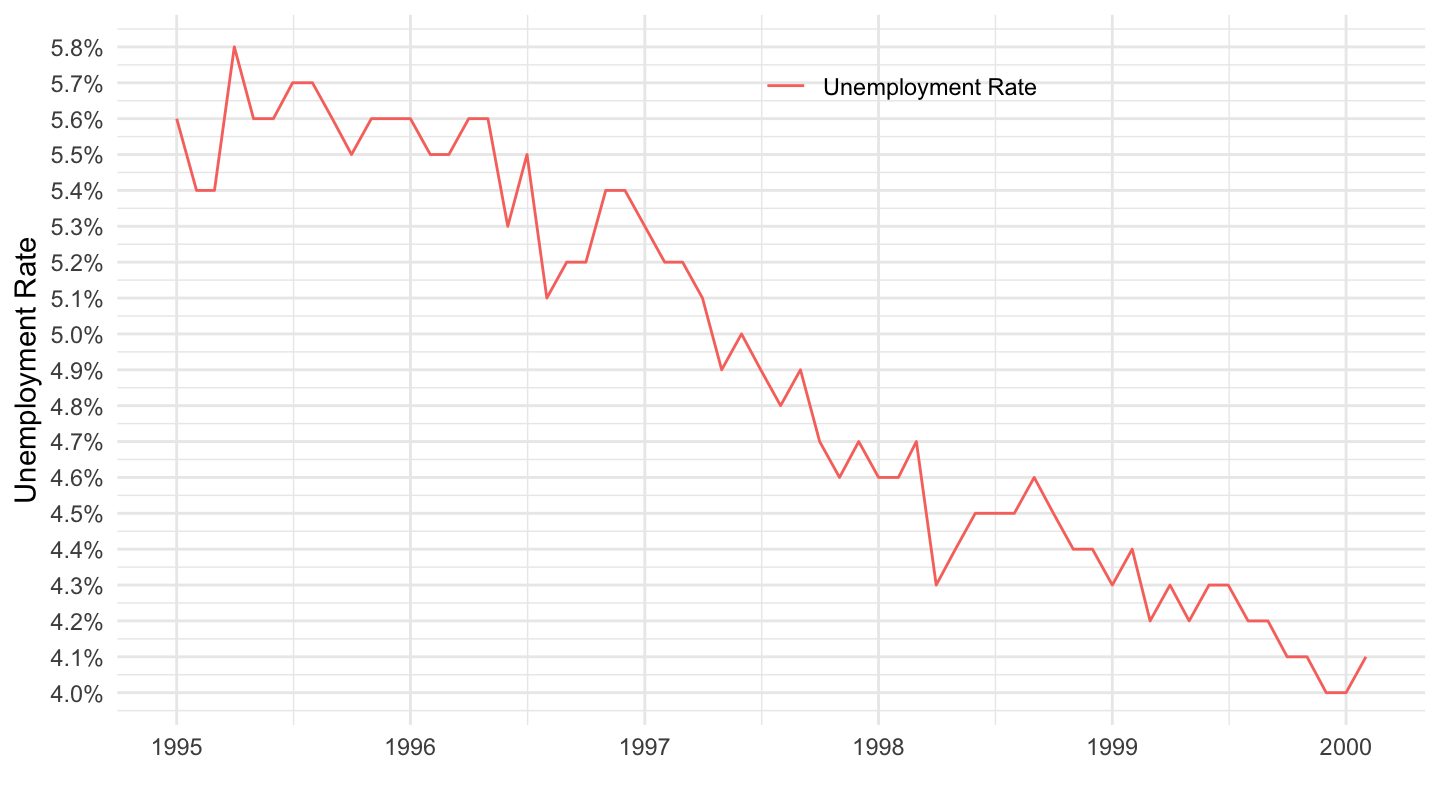
U.S.
1903 - 1925
(ref:us-employment-1903-1925) U.S. Employment (1903 - 1925)
Code
unr %>%
  filter(variable %in% c("A0871AUSA175NNBR"),
         date >= as.Date("1903-01-01"),
         date <= as.Date("1925-01-01")) %>%
  ggplot(.) +
  geom_line(aes(x = date, y = value)) +
  ylab("Employment ('000s)") + xlab("") +
  geom_rect(data = nber_recessions,
            aes(xmin = Peak, xmax = Trough, ymin = -Inf, ymax = +Inf),
            fill = 'grey', alpha = 0.5) +
  scale_y_continuous(breaks = 1000*seq(24, 50, 2),
                     labels = comma) +
  scale_x_date(breaks = as.Date(paste0(seq(1900, 1930, 5), "-01-01")),
               labels = date_format("%Y"),
               limits = c(as.Date("1903-01-01"), as.Date("1925-01-01"))) +
  theme_minimal()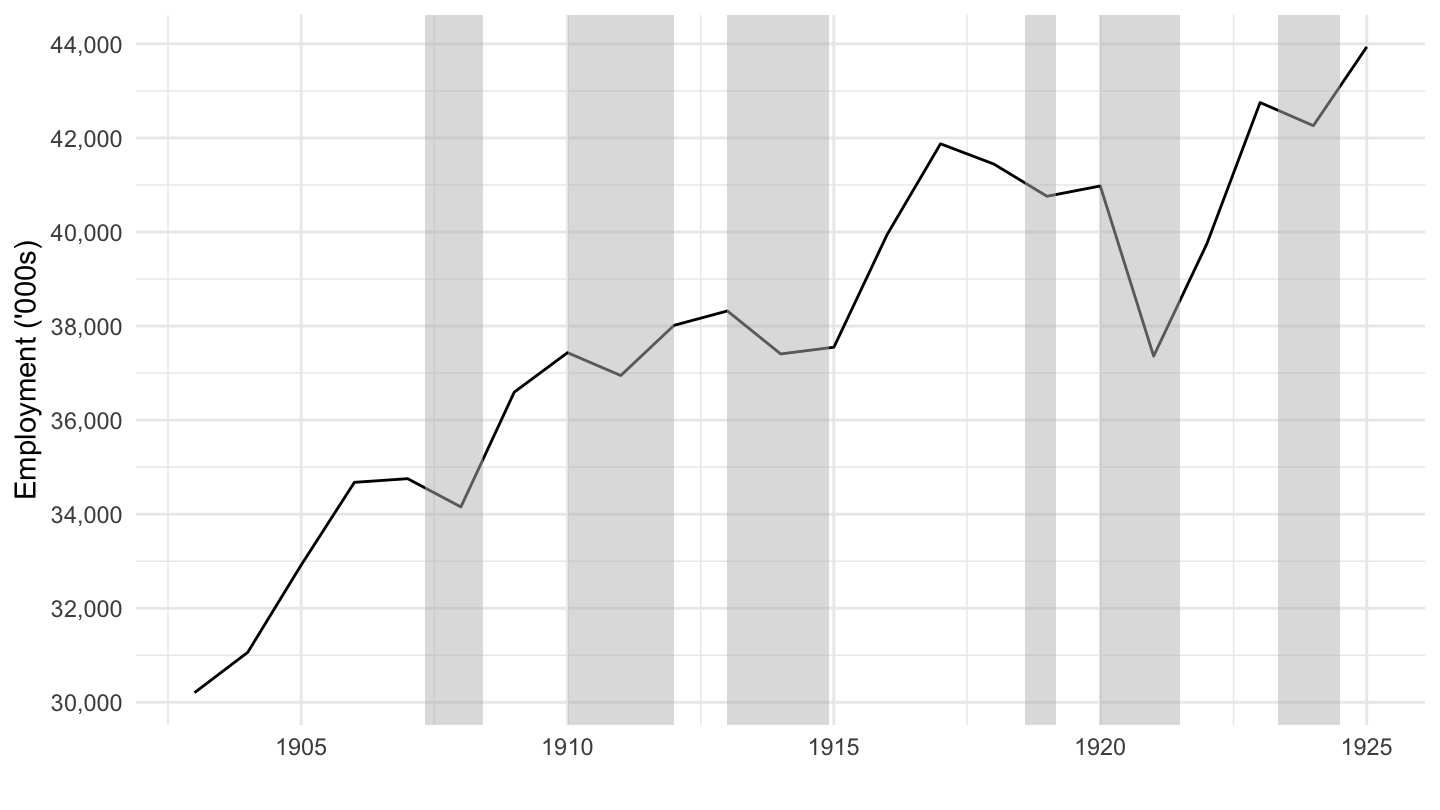
1900 - 1929
(ref:us-employment-1900-1929) U.S. Employment (1900 - 1929)
Code
unr %>%
  filter(variable == "A0871AUSA175NNBR") %>%
  ggplot(.) +
  geom_line(aes(x = date, y = value)) +
  ylab("Employment ('000s)") + xlab("") +
  geom_rect(data = nber_recessions,
            aes(xmin = Peak, xmax = Trough, ymin = -Inf, ymax = +Inf),
            fill = 'grey', alpha = 0.5) +
  scale_y_continuous(breaks = 1000*seq(24, 50, 4),
                     labels = comma) +
  scale_x_date(breaks = as.Date(paste0(seq(1900, 1930, 5), "-01-01")),
               labels = date_format("%Y"),
               limits = c(as.Date("1900-01-01"), as.Date("1929-01-01"))) +
  theme_minimal()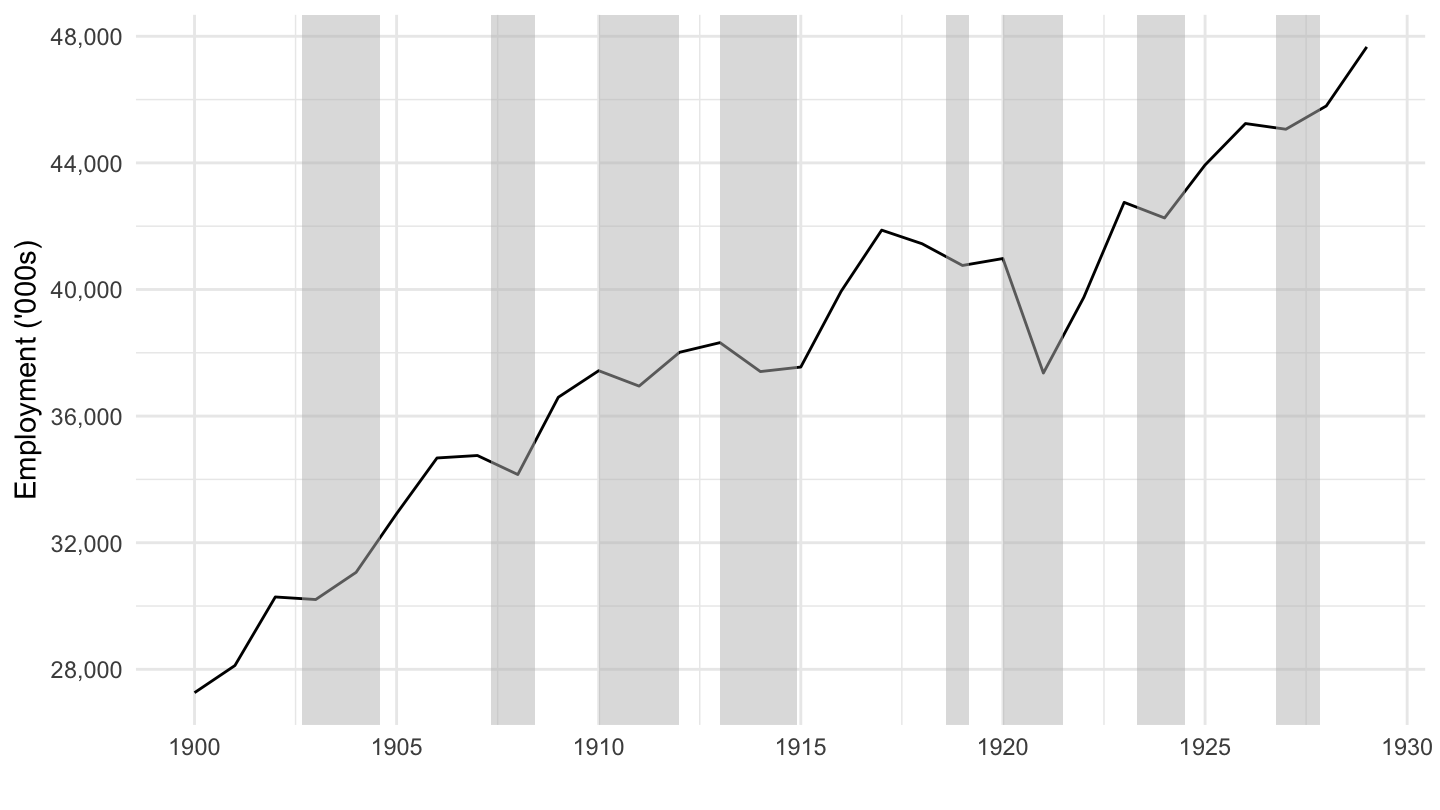
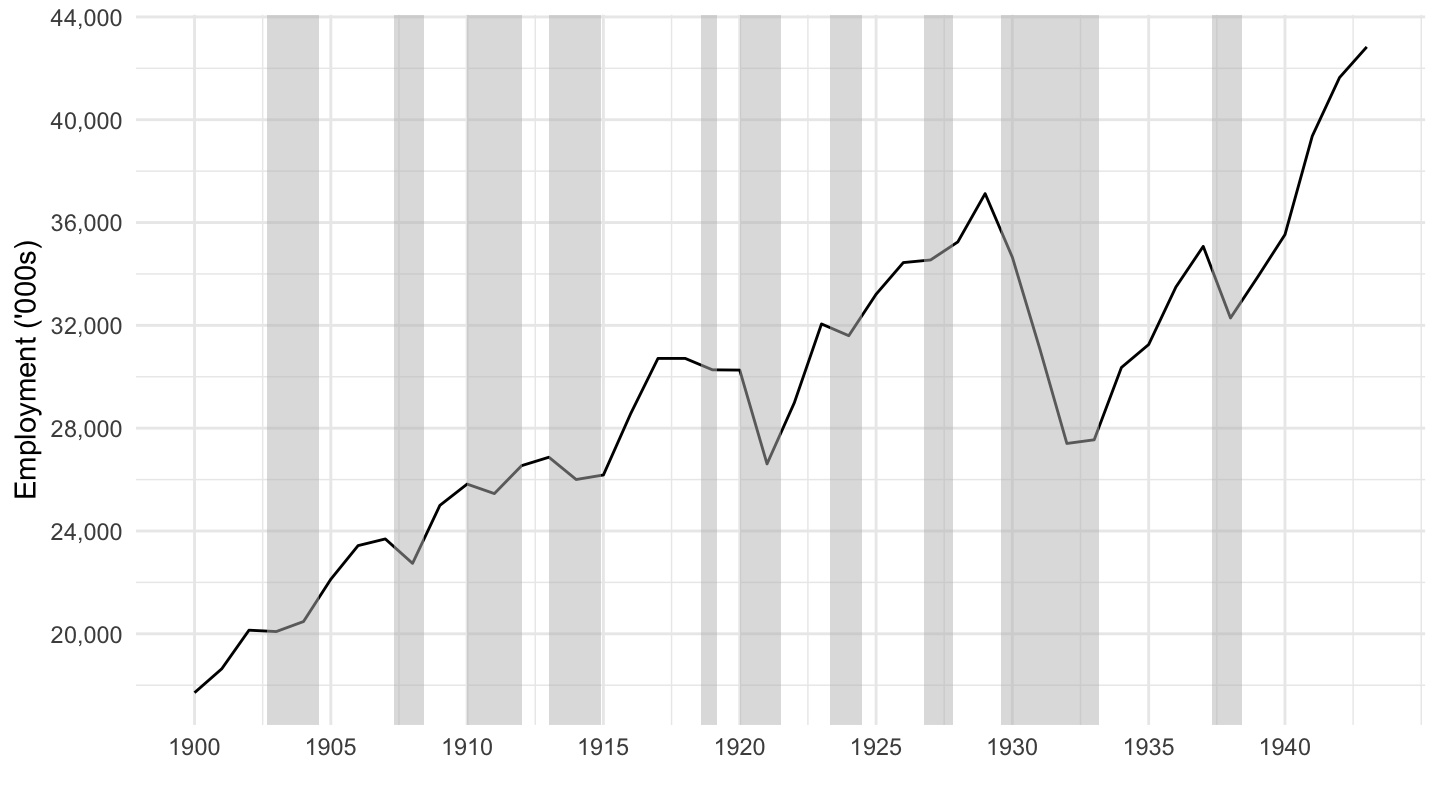
Non agricultural employment - 1900 - 1943
(ref:us-nonagr-employment-1900-1943) U.S. Non Agricultural Employment (1900-1943)
Code
unr %>%
  filter(variable == "A08170USA175NNBR",
         date >= as.Date("1900-01-01"),
         date <= as.Date("1943-01-01")) %>%
  ggplot(.) +
  geom_line(aes(x = date, y = value)) +
  ylab("Employment ('000s)") + xlab("") +
  geom_rect(data = nber_recessions,
            aes(xmin = Peak, xmax = Trough, ymin = -Inf, ymax = +Inf),
            fill = 'grey', alpha = 0.5) +
  scale_y_continuous(breaks = 1000*seq(16, 50, 4),
                     labels = comma) +
  scale_x_date(breaks = as.Date(paste0(seq(1900, 1943, 5), "-01-01")),
               labels = date_format("%Y"),
               limits = c(as.Date("1900-01-01"), as.Date("1943-01-01"))) +
  theme_minimal()