| source | dataset | Title | .html | .rData |
|---|---|---|---|---|
| eurostat | prc_hpi_ooq | Owner-occupied housing price index (2015=100) - quarterly data | 2025-11-14 | 2025-11-13 |
Owner-occupied housing price index (2015=100) - quarterly data
Data - Eurostat
Info
Data on housing
| source | dataset | Title | .html | .rData |
|---|---|---|---|---|
| bdf | RPP | Prix de l'immobilier | 2025-08-28 | 2025-10-25 |
| bis | LONG_PP | Residential property prices - detailed series | 2025-10-11 | 2024-05-10 |
| bis | SELECTED_PP | Property prices, selected series | 2025-10-11 | 2025-10-11 |
| ecb | RPP | Residential Property Price Index Statistics | 2025-11-15 | 2025-08-29 |
| eurostat | ei_hppi_q | House price index (2015 = 100) - quarterly data | 2025-11-16 | 2025-11-15 |
| eurostat | hbs_str_t223 | Mean consumption expenditure by income quintile | 2025-10-11 | 2025-11-15 |
| eurostat | prc_hicp_midx | HICP (2015 = 100) - monthly data (index) | 2025-11-14 | 2025-11-15 |
| eurostat | prc_hpi_q | House price index (2015 = 100) - quarterly data | 2025-11-14 | 2025-11-13 |
| fred | housing | House Prices | 2025-11-15 | 2025-11-15 |
| insee | IPLA-IPLNA-2015 | Indices des prix des logements neufs et Indices Notaires-Insee des prix des logements anciens | 2025-11-16 | 2025-11-15 |
| oecd | SNA_TABLE5 | Final consumption expenditure of households | 2025-09-29 | 2023-10-19 |
| oecd | housing | NA | NA | NA |
Last
Code
prc_hpi_ooq %>%
  group_by(time) %>%
  summarise(Nobs = n()) %>%
  arrange(desc(time)) %>%
  head(3) %>%
print_table_conditional()| time | Nobs |
|---|---|
| 2025Q2 | 1282 |
| 2025Q1 | 1281 |
| 2024Q4 | 1279 |
expend
Code
prc_hpi_ooq %>%
  left_join(expend, by = "expend") %>%
  group_by(expend, Expend) %>%
  summarise(Nobs = n()) %>%
  arrange(-Nobs) %>%
{if (is_html_output()) print_table(.) else .}| expend | Expend | Nobs |
|---|---|---|
| DW_ACQ_NEW | New dwellings | 8846 |
| TOTAL | Total | 8846 |
| DW_ACQ | Acquisitions of dwellings | 8841 |
| DW_ACQ_OTH | Other services related to the acquisition of dwellings | 8798 |
| DW_OWN | Ownership of dwellings | 8793 |
| DW_ACQ_NEWP | Purchases of newly built dwellings | 8752 |
| DW_OWN_RMNT | Major repairs and maintenance | 8727 |
| DW_OWN_INS | Insurance connected with dwellings | 8328 |
| DW_ACQ_NEWSB | Self-build dwellings and major renovations | 8044 |
| DW_ACQ_EXST | Existing dwellings new to the households | 4006 |
| DW_OWN_OTH | Other services related to ownership of dwellings | 3216 |
unit
Code
prc_hpi_ooq %>%
  left_join(unit, by = "unit") %>%
  group_by(unit, Unit) %>%
  summarise(Nobs = n()) %>%
  arrange(-Nobs) %>%
{if (is_html_output()) print_table(.) else .}| unit | Unit | Nobs |
|---|---|---|
| I15_Q | Quarterly index, 2015=100 | 21800 |
| I10_Q | Quarterly index, 2010=100 | 21476 |
| RCH_Q | Quarterly rate of change | 21465 |
| RCH_A | Annual rate of change | 20456 |
geo
Code
prc_hpi_ooq %>%
  left_join(geo, by = "geo") %>%
  group_by(geo, Geo) %>%
  summarise(Nobs = n()) %>%
  arrange(-Nobs) %>%
  mutate(Flag = gsub(" ", "-", str_to_lower(Geo)),
         Flag = paste0('<img src="../../icon/flag/vsmall/', Flag, '.png" alt="Flag">')) %>%
  select(Flag, everything()) %>%
  {if (is_html_output()) datatable(., filter = 'top', rownames = F, escape = F) else .}
time
Code
prc_hpi_ooq %>%
  group_by(time) %>%
  summarise(Nobs = n()) %>%
  {if (is_html_output()) datatable(., filter = 'top', rownames = F) else .}
Greece, Europe, France, Spain, Italy, Germany
Purchase Total
Code
prc_hpi_ooq %>%
  filter(expend == "TOTAL",
         geo %in% c("EL", "FR", "ES", "IT", "DE"),
         unit == "I15_Q") %>%
  quarter_to_date %>%
  group_by(geo) %>%
  mutate(values = 100*values/values[date == as.Date("2011-01-01")]) %>%
  filter(date >= as.Date("2009-01-01"),
         date <= as.Date("2016-01-01")) %>%
  left_join(geo, by = "geo") %>%
  mutate(Geo = ifelse(geo == "EA", "Europe", Geo),
         Geo = ifelse(geo == "DE", "Germany", Geo)) %>%
  ggplot(.) + geom_line(aes(x = date, y = values, color = Geo)) +
  theme_minimal() + xlab("") + ylab("100 = Janv. 2011") +
  scale_x_date(breaks = seq(1960, 2021, 1) %>% paste0("-01-01") %>% as.Date,
               labels = date_format("%y")) +
  scale_color_manual(values = c("#ED2939", "#000000", "#009246", "#FFC400")) + add_4flags +
  scale_y_log10(breaks = seq(0, 200, 5)) +
  theme(legend.position = "none",
        legend.title = element_blank())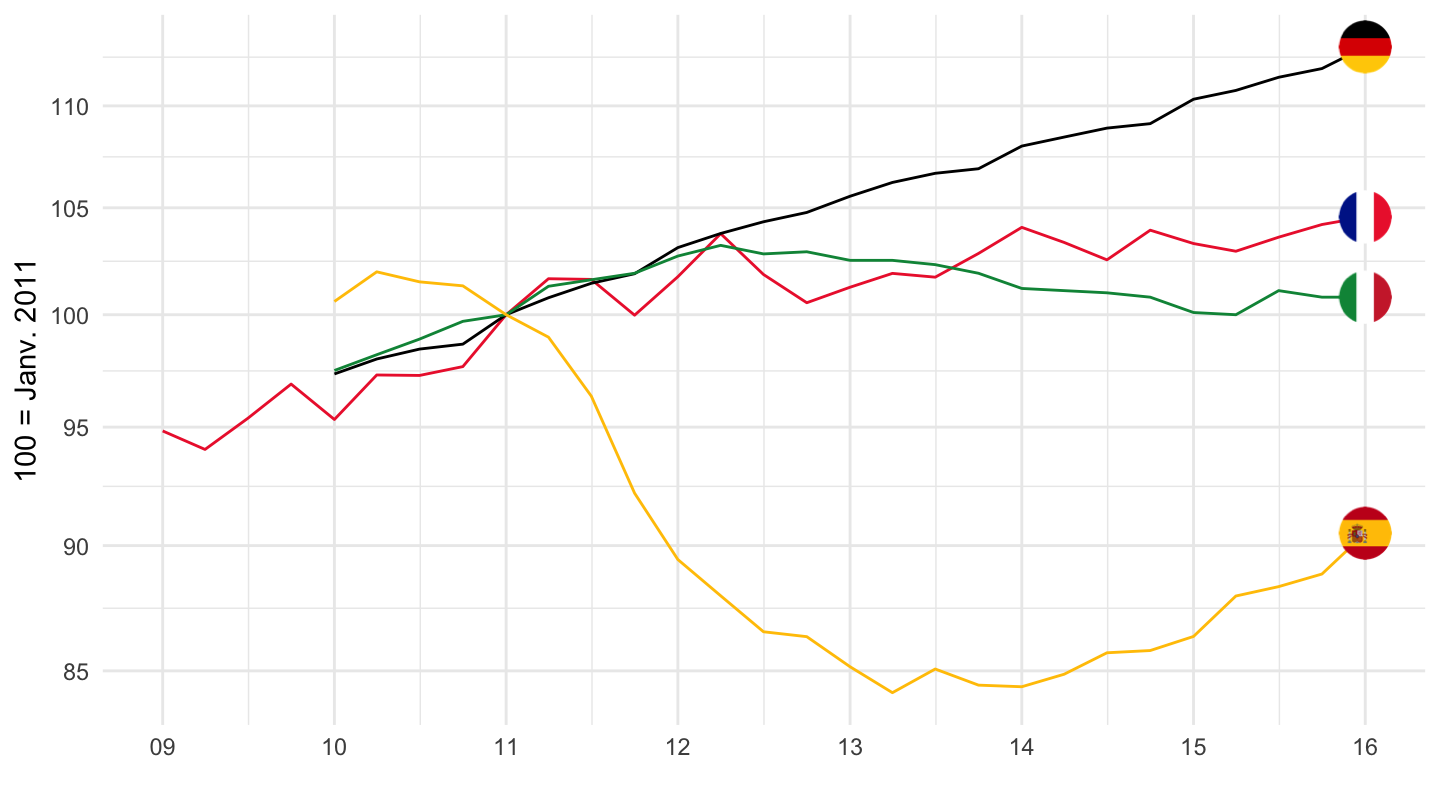
Acquisitions of dwellings - DW_ACQ
Code
prc_hpi_ooq %>%
  filter(expend == "DW_ACQ",
         geo %in% c("EL", "FR", "ES", "IT", "DE"),
         unit == "I15_Q") %>%
  quarter_to_date %>%
  group_by(geo) %>%
  mutate(values = 100*values/values[date == as.Date("2011-01-01")]) %>%
  filter(date >= as.Date("2009-01-01"),
         date <= as.Date("2016-01-01")) %>%
  left_join(geo, by = "geo") %>%
  mutate(Geo = ifelse(geo == "EA", "Europe", Geo),
         Geo = ifelse(geo == "DE", "Germany", Geo)) %>%
  ggplot(.) + geom_line(aes(x = date, y = values, color = Geo)) +
  theme_minimal() + xlab("") + ylab("100 = Janv. 2011") +
  scale_x_date(breaks = seq(1960, 2021, 1) %>% paste0("-01-01") %>% as.Date,
               labels = date_format("%y")) +
  scale_color_manual(values = c("#ED2939", "#000000", "#009246", "#FFC400")) + add_4flags +
  scale_y_log10(breaks = seq(0, 200, 5)) +
  theme(legend.position = "none",
        legend.title = element_blank())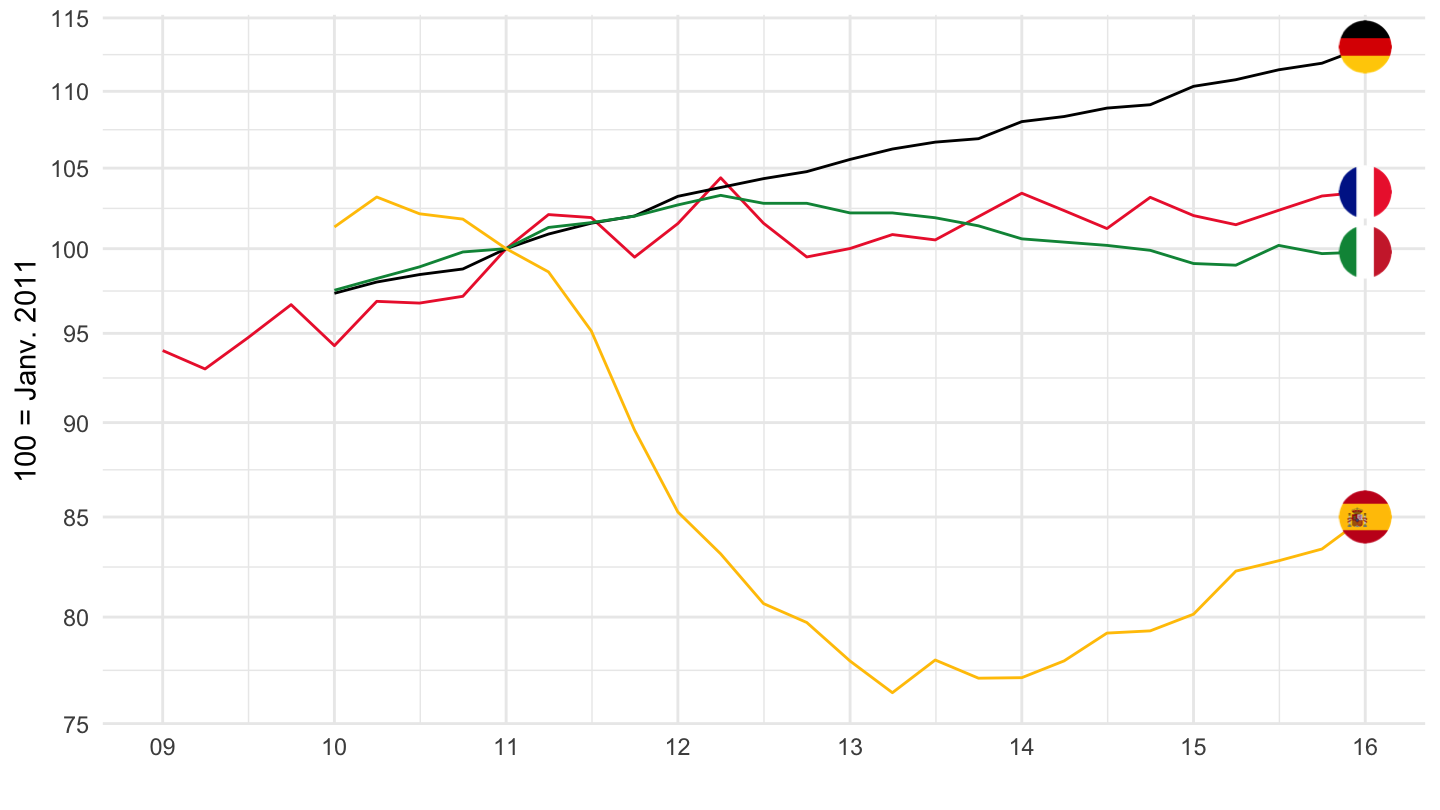
Ownership of new dwellings - DW_NEW
Code
prc_hpi_ooq %>%
  filter(expend == "DW_OWN",
         geo %in% c("EL", "FR", "ES", "IT", "DE"),
         unit == "I15_Q") %>%
  quarter_to_date %>%
  group_by(geo) %>%
  mutate(values = 100*values/values[date == as.Date("2011-01-01")]) %>%
  filter(date >= as.Date("2009-01-01"),
         date <= as.Date("2016-01-01")) %>%
  left_join(geo, by = "geo") %>%
  mutate(Geo = ifelse(geo == "EA", "Europe", Geo),
         Geo = ifelse(geo == "DE", "Germany", Geo)) %>%
  ggplot(.) + geom_line(aes(x = date, y = values, color = Geo)) +
  theme_minimal() + xlab("") + ylab("100 = Janv. 2011") +
  scale_x_date(breaks = seq(1920, 2025, 2) %>% paste0("-01-01") %>% as.Date,
               labels = date_format("%Y")) +
  scale_color_manual(values = c("#ED2939", "#000000", "#009246", "#FFC400")) + add_4flags +
  scale_y_log10(breaks = seq(0, 200, 2)) +
  theme(legend.position = "none",
        legend.title = element_blank())
2006Q1
Code
prc_hpi_ooq %>%
  filter(time == "2006Q1") %>%
  {if (is_html_output()) datatable(., filter = 'top', rownames = F) else .}
Purchase Total
Nobs
Code
prc_hpi_ooq %>%
  filter(expend == "TOTAL",
         unit == "I15_Q") %>%
  left_join(geo, by = "geo") %>%
  mutate(Geo = ifelse(geo == "EA", "Europe", Geo),
         Geo = ifelse(geo == "DE", "Germany", Geo)) %>%
  group_by(geo, Geo) %>%
  arrange(time) %>%
  summarise(first = first(time),
            last = last(time),
            Nobs = n()) %>%
  arrange(-Nobs) %>%
  mutate(Flag = gsub(" ", "-", str_to_lower(Geo)),
         Flag = paste0('<img src="../../icon/flag/vsmall/', Flag, '.png" alt="Flag">')) %>%
  select(Flag, everything()) %>%
  {if (is_html_output()) datatable(., filter = 'top', rownames = F, escape = F) else .}
France, Italy, Germany
Code
prc_hpi_ooq %>%
  filter(expend == "TOTAL",
         geo %in% c("FR", "IT", "DE"),
         unit == "I15_Q") %>%
  quarter_to_date %>%
  left_join(geo, by = "geo") %>%
  mutate(Geo = ifelse(geo == "EA", "Europe", Geo),
         Geo = ifelse(geo == "DE", "Germany", Geo)) %>%
  ggplot() + geom_line(aes(x = date, y = values, color = Geo)) + theme_minimal() + add_3flags +
  scale_color_manual(values = c("#ED2939", "#000000", "#009246", "#FFC400")) +
  scale_x_date(breaks = seq(1920, 2025, 2) %>% paste0("-01-01") %>% as.Date,
               labels = date_format("%Y")) +
  theme(legend.position = c(0.35, 0.9),
        legend.title = element_blank()) +
  scale_y_continuous(breaks = seq(-100, 300, 5)) +
  ylab("House Price Index") + xlab("")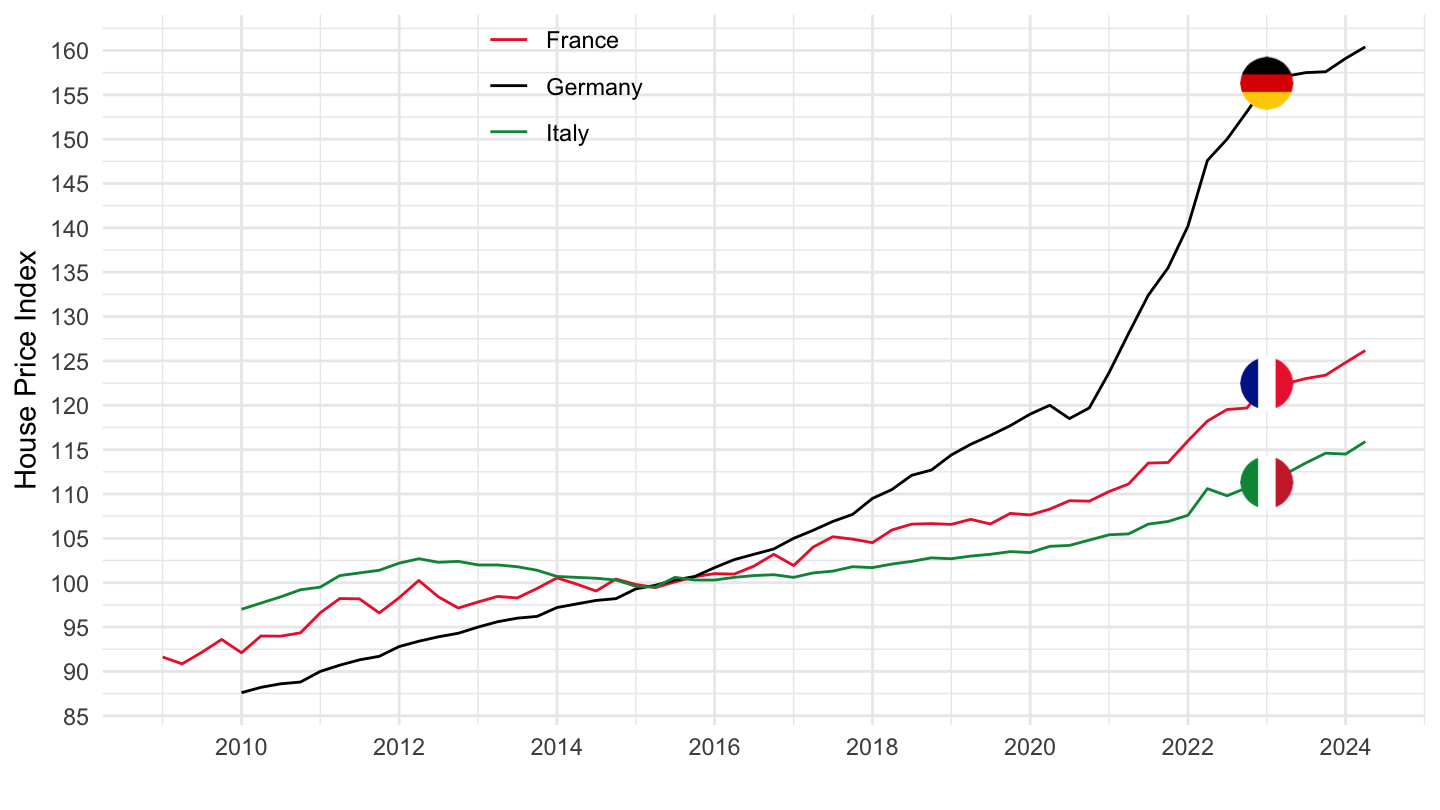
Belgium, Denmark, Sweden, United Kingdom
Code
prc_hpi_ooq %>%
  filter(expend == "TOTAL",
         geo %in% c("BE", "DK", "SE", "UK"),
         unit == "I15_Q") %>%
  quarter_to_date %>%
  left_join(geo, by = "geo") %>%
  ggplot() + geom_line(aes(x = date, y = values, color = Geo)) + theme_minimal() + add_4flags +
  scale_color_manual(values = c("#000000", "#C60C30", "#FECC00", "#6E82B5")) +
  scale_x_date(breaks = seq(1920, 2025, 2) %>% paste0("-01-01") %>% as.Date,
               labels = date_format("%Y")) +
  theme(legend.position = c(0.35, 0.9),
        legend.title = element_blank()) +
  scale_y_continuous(breaks = seq(-100, 300, 10)) +
  ylab("House Price Index") + xlab("")
All Series
France
Code
prc_hpi_ooq %>%
  filter(geo %in% c("FR"),
         unit == "I15_Q") %>%
  quarter_to_date %>%
  left_join(geo, by = "geo") %>%
  left_join(expend, by = "expend") %>%
  ggplot() + geom_line() + theme_minimal() +
  aes(x = date, y = values, color = Expend, linetype = Expend) +
  scale_color_manual(values = viridis(11)[1:10]) +
  scale_x_date(breaks = seq(1920, 2025, 2) %>% paste0("-01-01") %>% as.Date,
               labels = date_format("%Y")) +
  theme(legend.position = c(0.75, 0.3),
        legend.title = element_blank()) +
  scale_y_log10(breaks = seq(-100, 300, 10)) +
  ylab("House Price Index") + xlab("")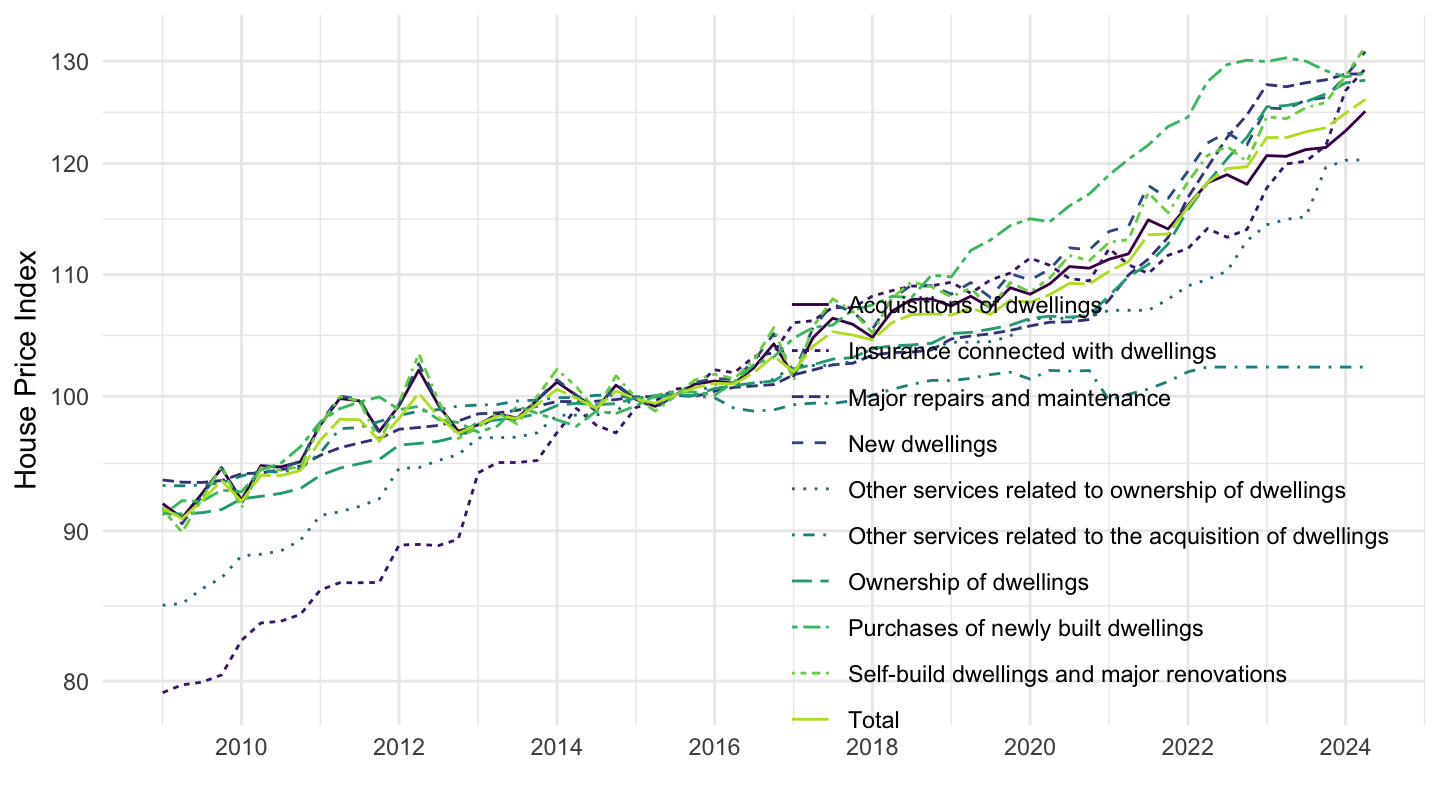
Germany
Code
prc_hpi_ooq %>%
  filter(geo %in% c("DE"),
         unit == "I15_Q") %>%
  quarter_to_date %>%
  left_join(geo, by = "geo") %>%
  left_join(expend, by = "expend") %>%
  ggplot() + geom_line() + theme_minimal() +
  aes(x = date, y = values, color = Expend, linetype = Expend) +
  scale_color_manual(values = viridis(11)[1:10]) +
  scale_x_date(breaks = seq(1920, 2025, 2) %>% paste0("-01-01") %>% as.Date,
               labels = date_format("%Y")) +
  theme(legend.position = c(0.35, 0.9),
        legend.title = element_blank()) +
  scale_y_log10(breaks = seq(-100, 300, 10)) +
  ylab("House Price Index") + xlab("")
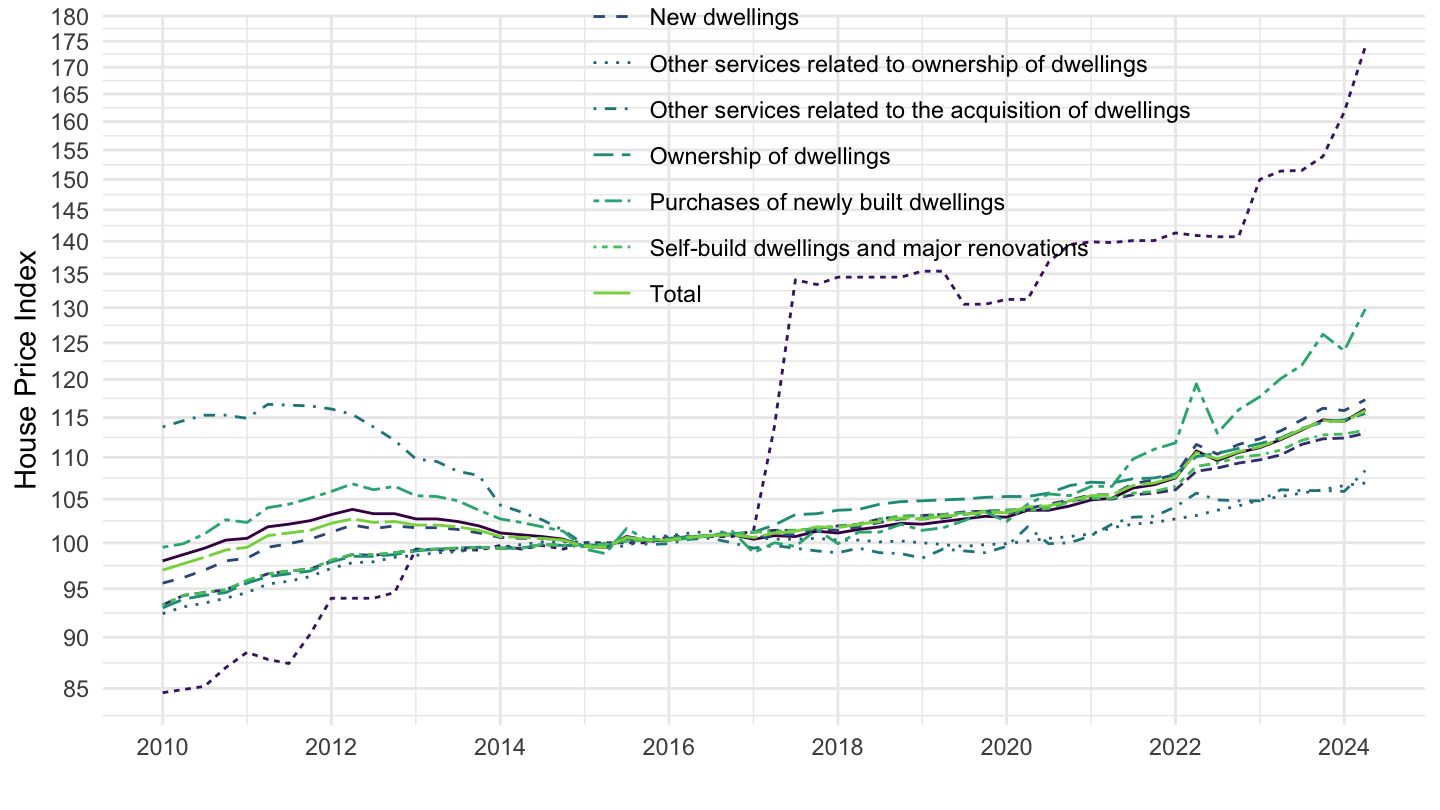
Italy
Code
prc_hpi_ooq %>%
  filter(geo %in% c("IT"),
         unit == "I15_Q") %>%
  quarter_to_date %>%
  left_join(geo, by = "geo") %>%
  left_join(expend, by = "expend") %>%
  ggplot() + geom_line() + theme_minimal() +
  aes(x = date, y = values, color = Expend, linetype = Expend) +
  scale_color_manual(values = viridis(12)[1:11]) +
  scale_x_date(breaks = seq(1920, 2025, 2) %>% paste0("-01-01") %>% as.Date,
               labels = date_format("%Y")) +
  theme(legend.position = c(0.6, 0.9),
        legend.title = element_blank()) +
  scale_y_log10(breaks = seq(-100, 300, 5)) +
  ylab("House Price Index") + xlab("")