Warning in readChar(con, 5L, useBytes = TRUE): impossible d'ouvrir le fichier
compressé '/Users/geerolf/iCloud/website/data/ecb/TITLE_COMPL.RData', cause
probable : 'No such file or directory'
Error: 17 Data - ECB
Warning in readChar(con, 5L, useBytes = TRUE): impossible d'ouvrir le fichier
compressé '/Users/geerolf/iCloud/website/data/ecb/TITLE_COMPL.RData', cause
probable : 'No such file or directory'Error: 17 | source | dataset | Title | .html | .rData |
|---|---|---|---|---|
| bdf | FM | Marché financier, taux | 2026-07-22 | 2026-07-22 |
| bdf | MIR | Taux d'intérêt - Zone euro | 2026-07-22 | 2026-07-22 |
| bdf | MIR1 | Taux d'intérêt - France | 2026-07-23 | 2026-07-23 |
| bis | CBPOL_D | Policy Rates, Daily | 2026-07-18 | 2025-08-20 |
| bis | CBPOL_M | Policy Rates, Monthly | 2026-07-22 | 2024-04-19 |
| ecb | FM | Financial market data | 2026-07-23 | 2026-07-22 |
| ecb | MIR | MFI Interest Rate Statistics | 2026-07-23 | 2026-07-22 |
| eurostat | ei_mfir_m | Interest rates - monthly data | 2026-07-23 | 2026-07-23 |
| eurostat | irt_lt_mcby_d | EMU convergence criterion series - daily data | 2026-07-23 | 2025-07-24 |
| eurostat | irt_st_m | Money market interest rates - monthly data | 2026-07-23 | 2026-07-23 |
| fred | r | Interest Rates | 2026-07-22 | 2026-07-22 |
| oecd | MEI | Main Economic Indicators | 2024-04-16 | 2025-07-24 |
| oecd | MEI_FIN | Monthly Monetary and Financial Statistics (MEI) | 2024-09-15 | 2025-07-24 |
| wdi | FR.INR.DPST | Deposit interest rate (%) | 2022-09-27 | 2026-07-22 |
| wdi | FR.INR.LEND | Lending interest rate (%) | 2026-07-22 | 2026-07-22 |
| wdi | FR.INR.RINR | Real interest rate (%) | 2026-01-11 | 2026-07-22 |
| LAST_COMPILE |
|---|
| 2026-07-24 |
IRS %>%
  group_by(TIME_PERIOD) %>%
  summarise(Nobs = n()) %>%
  arrange(desc(TIME_PERIOD)) %>%
  head(2) %>%
print_table_conditional()| TIME_PERIOD | Nobs |
|---|---|
| 2026-06 | 36 |
| 2026-05 | 36 |
IRS %>%
  left_join(IR_TYPE , by = "IR_TYPE") %>%
  group_by(IR_TYPE, Ir_type) %>%
  summarise(Nobs = n()) %>%
  arrange(-Nobs) %>%
print_table_conditional()| IR_TYPE | Ir_type | Nobs |
|---|---|---|
| L | Long-term interest rate for convergence purposes | 12047 |
| M | Money market interest rates | 1536 |
| B | Bank interest rates | 198 |
IRS %>%
  left_join(TR_TYPE , by = "TR_TYPE") %>%
  group_by(TR_TYPE, Tr_type) %>%
  summarise(Nobs = n()) %>%
  arrange(-Nobs) %>%
print_table_conditional()| TR_TYPE | Tr_type | Nobs |
|---|---|---|
| L40 | Debt security issued | 12047 |
| L20 | Deposit liabilities | 1536 |
| A2L | Loans to households for house purchase and to non-financial corporations | 198 |
IRS %>%
  left_join(REF_AREA ,  by = "REF_AREA") %>%
  group_by(REF_AREA, Ref_area) %>%
  summarise(Nobs = n()) %>%
  arrange(-Nobs) %>%
print_table_conditional()IRS %>%
group_by(TIME_PERIOD) %>%
summarise(Nobs = n()) %>%
arrange(desc(TIME_PERIOD)) %>%
print_table_conditional()IRS %>%
filter(REF_AREA %in% c("FR", "DE", "IT"),
IR_TYPE == "L",
TR_TYPE == "L40") %>%
left_join(REF_AREA, by = "REF_AREA") %>%
month_to_date %>%
select_if(~n_distinct(.) > 1) %>%
left_join(colors, by = c("Ref_area" = "country")) %>%
mutate(OBS_VALUE = OBS_VALUE/100) %>%
ggplot(.) + theme_minimal() + xlab("") + ylab("Loans to households (%)") +
geom_line(aes(x = date, y = OBS_VALUE, color = color)) +
add_flags(3) + scale_color_identity() +
scale_x_date(breaks = seq(1960, 2030, 2) %>% paste0("-01-01") %>% as.Date,
labels = date_format("%Y")) +
scale_y_continuous(breaks = 0.01*seq(-10, 50, 1),
labels = percent_format(accuracy = 1))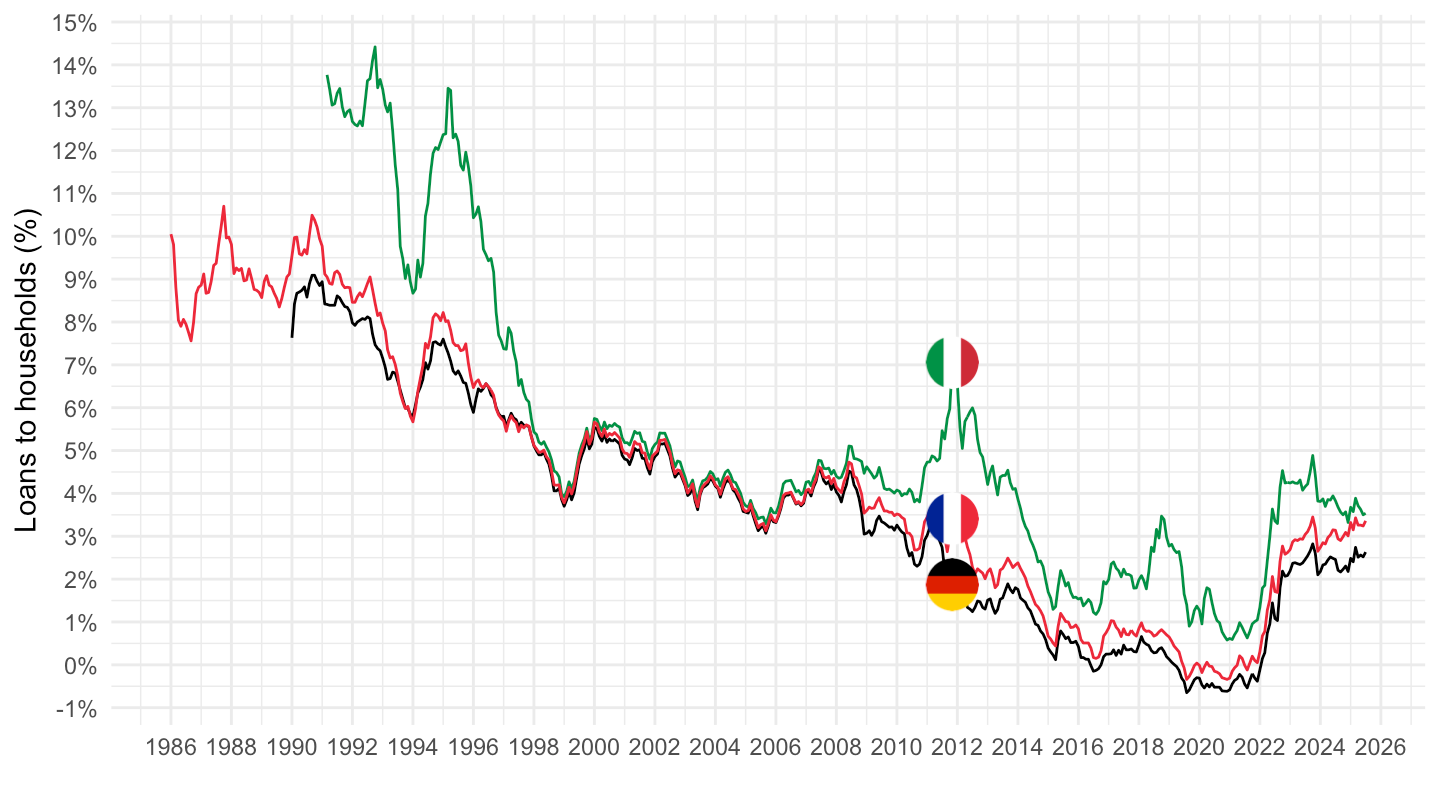
IRS %>%
  filter(REF_AREA %in% c("ES", "PT", "U2"),
         IR_TYPE == "L",
         TR_TYPE == "L40") %>%
  left_join(REF_AREA, by = "REF_AREA") %>%
  month_to_date %>%
  select_if(~n_distinct(.) > 1) %>%
  mutate(Ref_area = ifelse(REF_AREA == "U2", "Europe", Ref_area)) %>%
  left_join(colors, by = c("Ref_area" = "country")) %>%
  mutate(OBS_VALUE = OBS_VALUE/100) %>%
  ggplot(.) + theme_minimal() + xlab("") + ylab("Loans to households (%)") +
  geom_line(aes(x = date, y = OBS_VALUE, color = color)) +
  add_flags(3) + scale_color_identity() +
  scale_x_date(breaks = seq(1960, 2030, 2) %>% paste0("-01-01") %>% as.Date,
               labels = date_format("%Y")) +
  scale_y_continuous(breaks = 0.01*seq(-10, 50, 1),
                     labels = percent_format(accuracy = 1))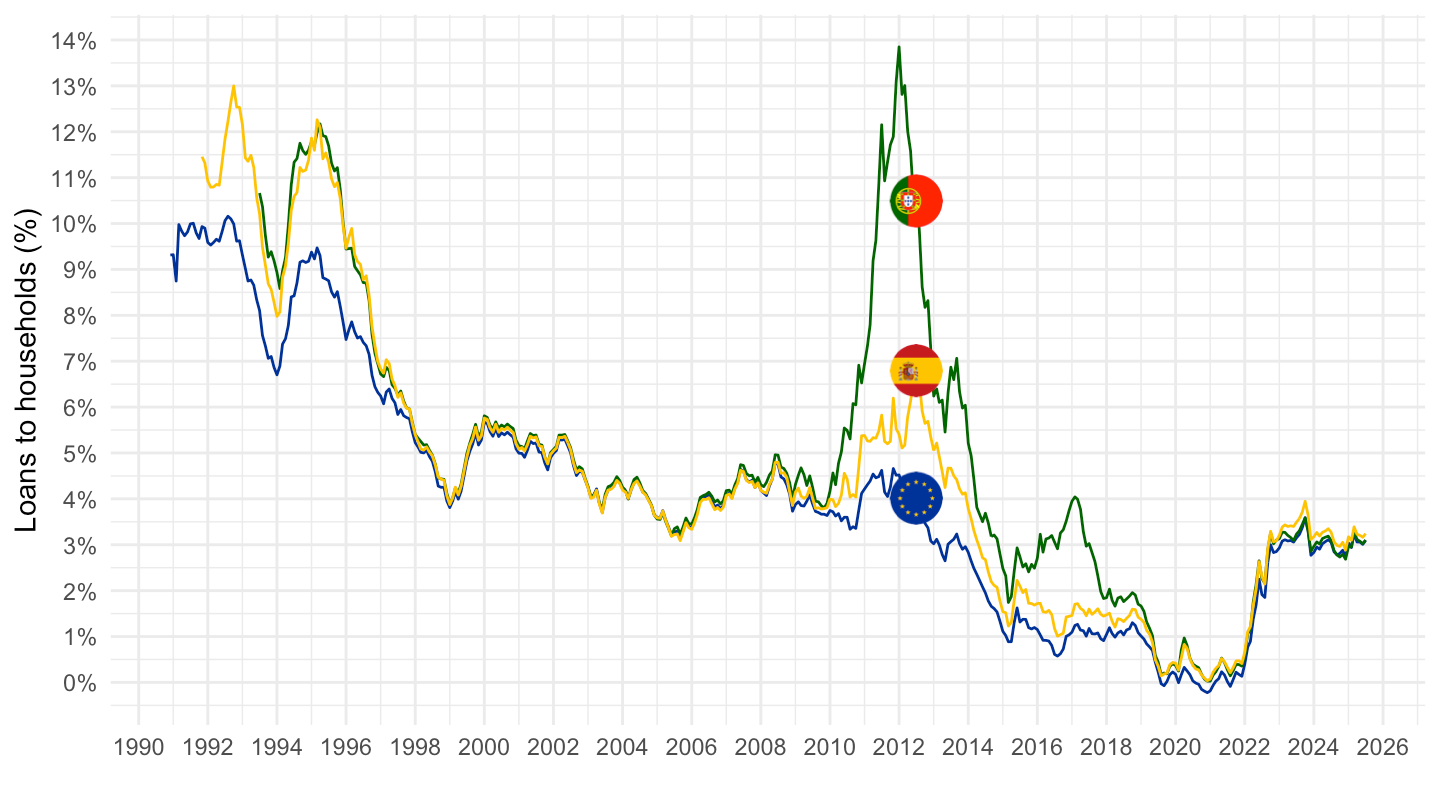
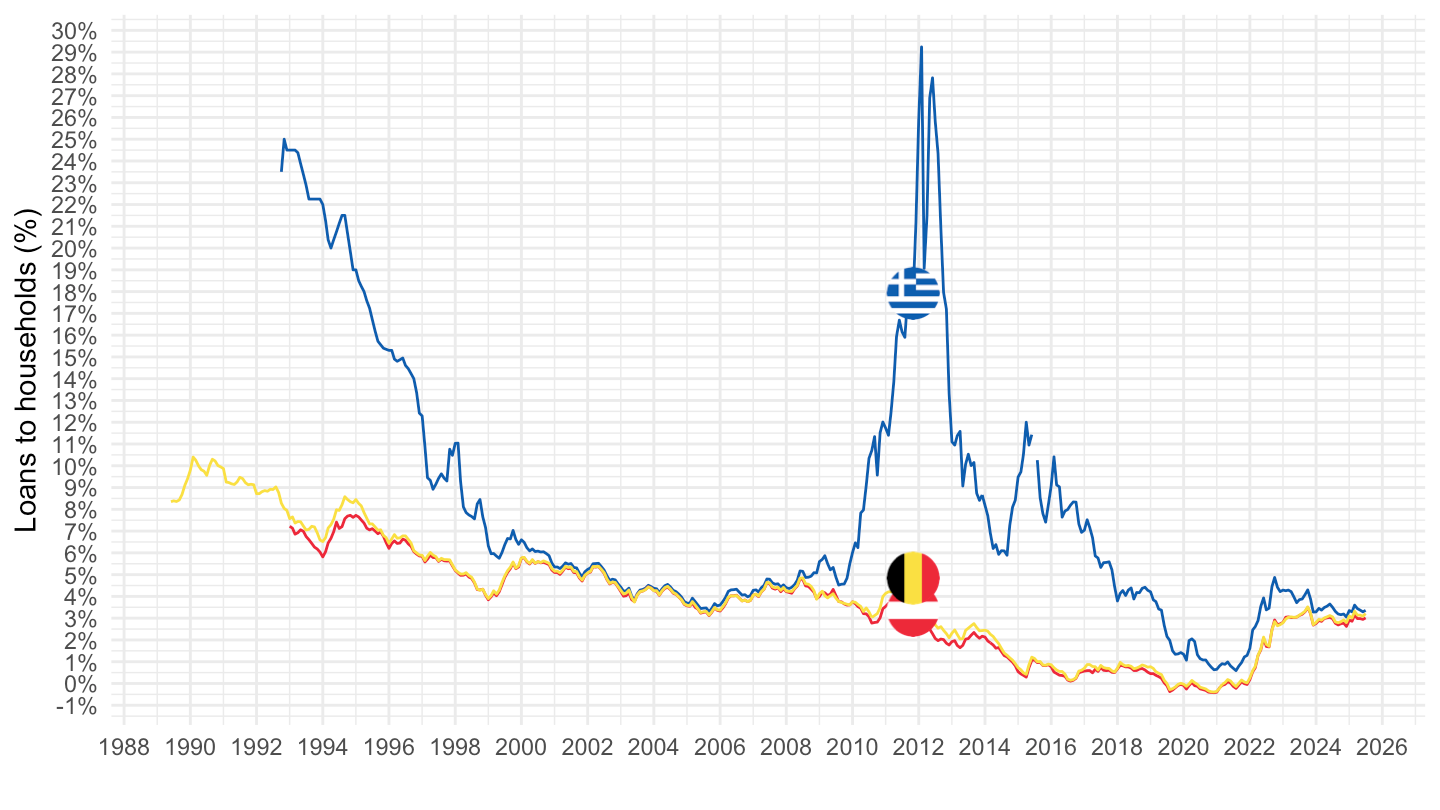
IRS %>%
  filter(REF_AREA %in% c("AT", "BE", "GR"),
         IR_TYPE == "L",
         TR_TYPE == "L40") %>%
  left_join(REF_AREA, by = "REF_AREA") %>%
  month_to_date %>%
  select_if(~n_distinct(.) > 1) %>%
  mutate(Ref_area = ifelse(REF_AREA == "U2", "Europe", Ref_area)) %>%
  left_join(colors, by = c("Ref_area" = "country")) %>%
  mutate(OBS_VALUE = OBS_VALUE/100) %>%
  ggplot(.) + theme_minimal() + xlab("") + ylab("Loans to households (%)") +
  geom_line(aes(x = date, y = OBS_VALUE, color = color)) +
  add_flags(3) + scale_color_identity() +
  scale_x_date(breaks = seq(1960, 2030, 2) %>% paste0("-01-01") %>% as.Date,
               labels = date_format("%Y")) +
  scale_y_continuous(breaks = 0.01*seq(-10, 50, 1),
                     labels = percent_format(accuracy = 1))