Code
`interest-rates` %>%
  arrange(-(dataset == "FR.INR.DPST")) %>%
  mutate(Title = read_lines(paste0("~/iCloud/website/data/", source, "/",dataset, ".qmd"), skip = 1, n_max = 1) %>% gsub("title: ", "", .) %>% gsub("\"", "", .)) %>%
  mutate(Download = as.Date(file.info(paste0("~/iCloud/website/data/", source, "/", dataset, ".RData"))$mtime),
         Compile = as.Date(file.info(paste0("~/iCloud/website/data/", source, "/", dataset, ".html"))$mtime)) %>%
  mutate(Compile = paste0("[", Compile, "](https://fgeerolf.com/data/", source, "/", dataset, '.html)')) %>%
print_table_conditional_20()| source | dataset | Title | Download | Compile |
|---|---|---|---|---|
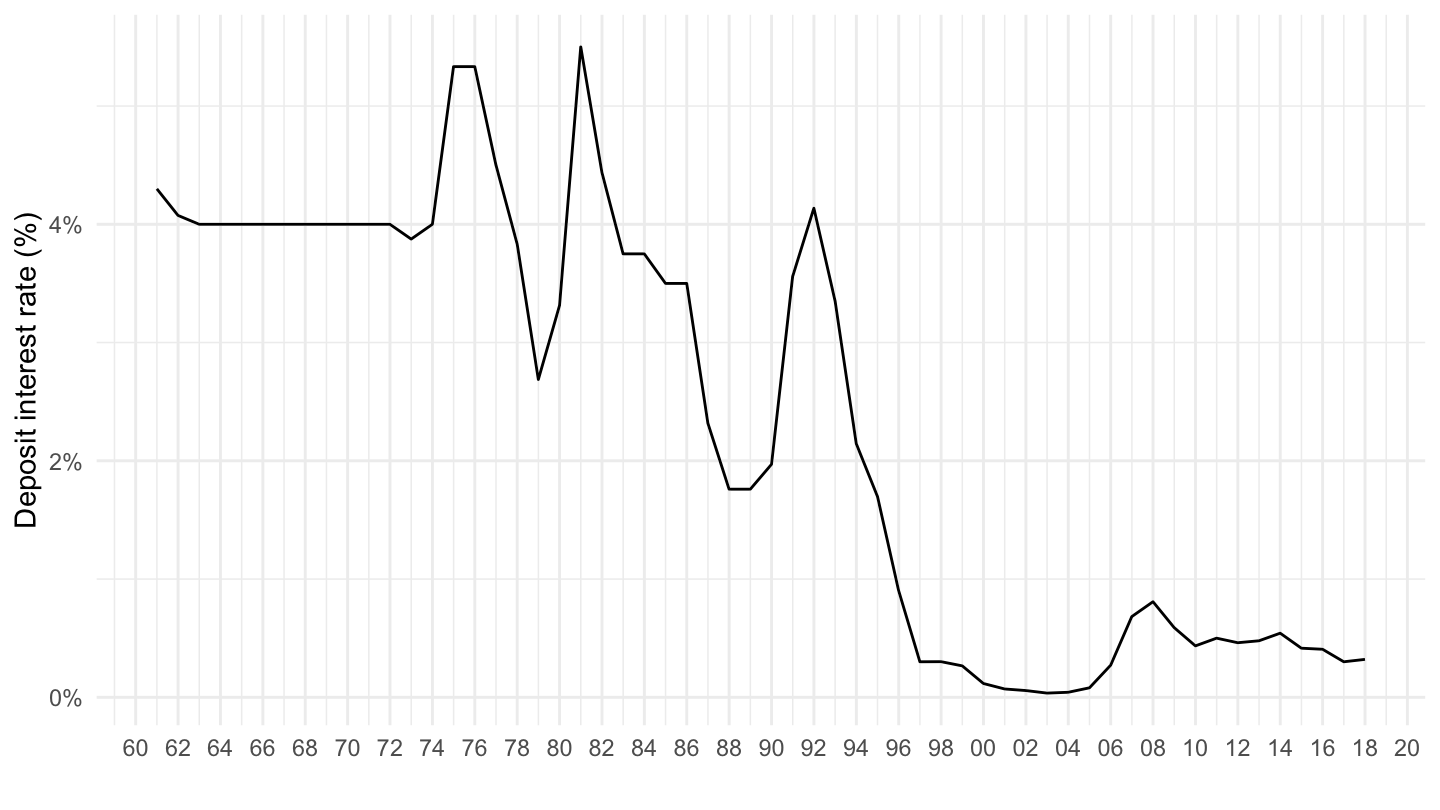
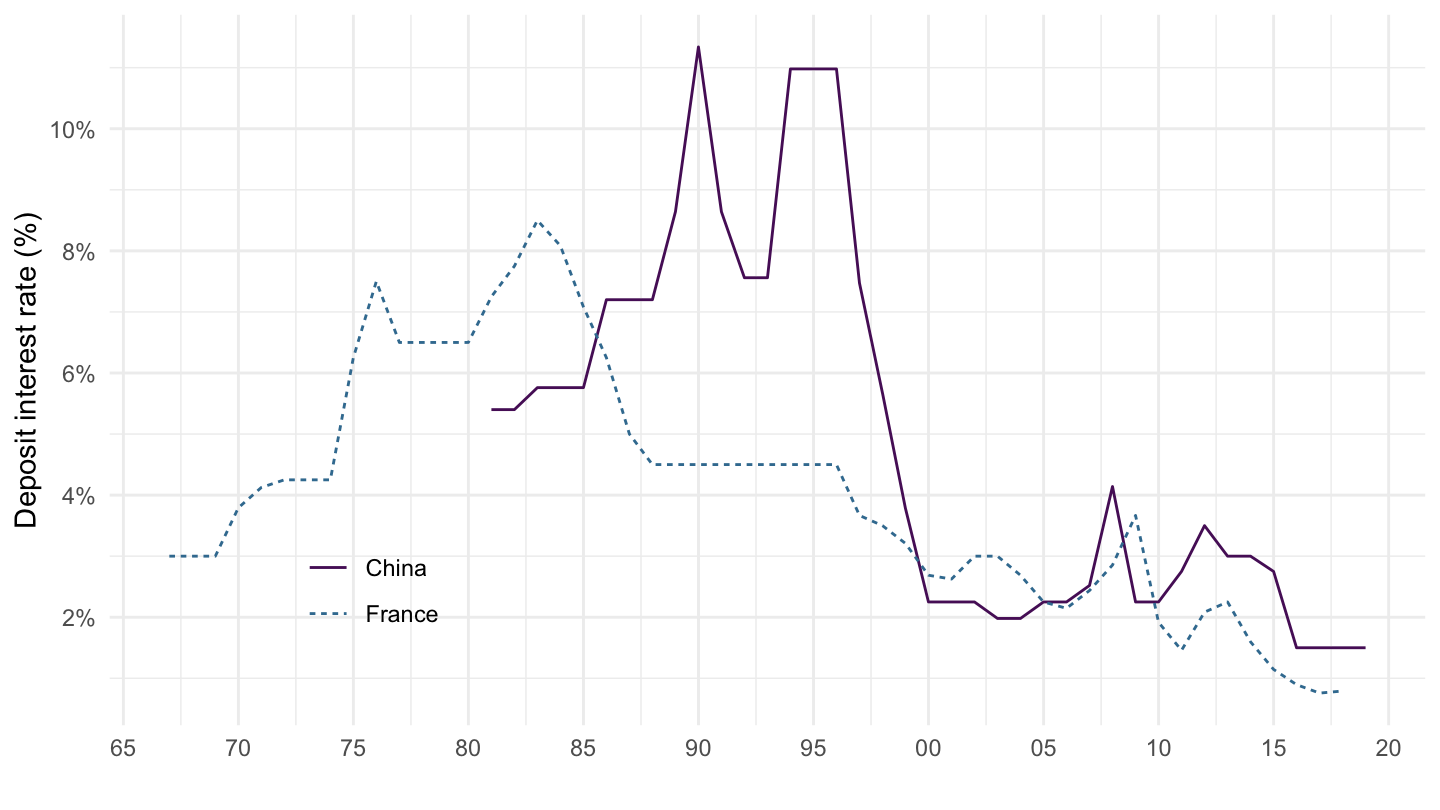
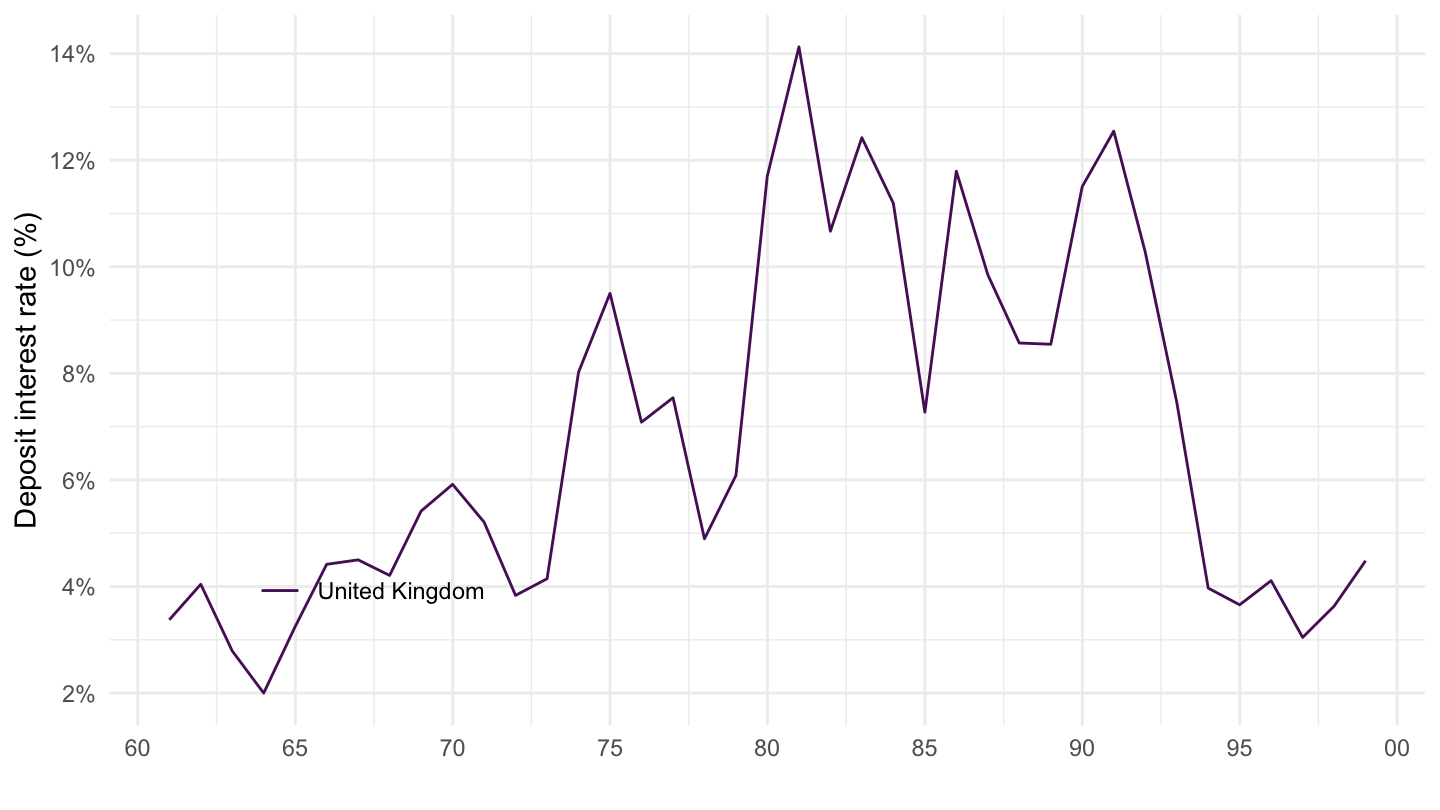
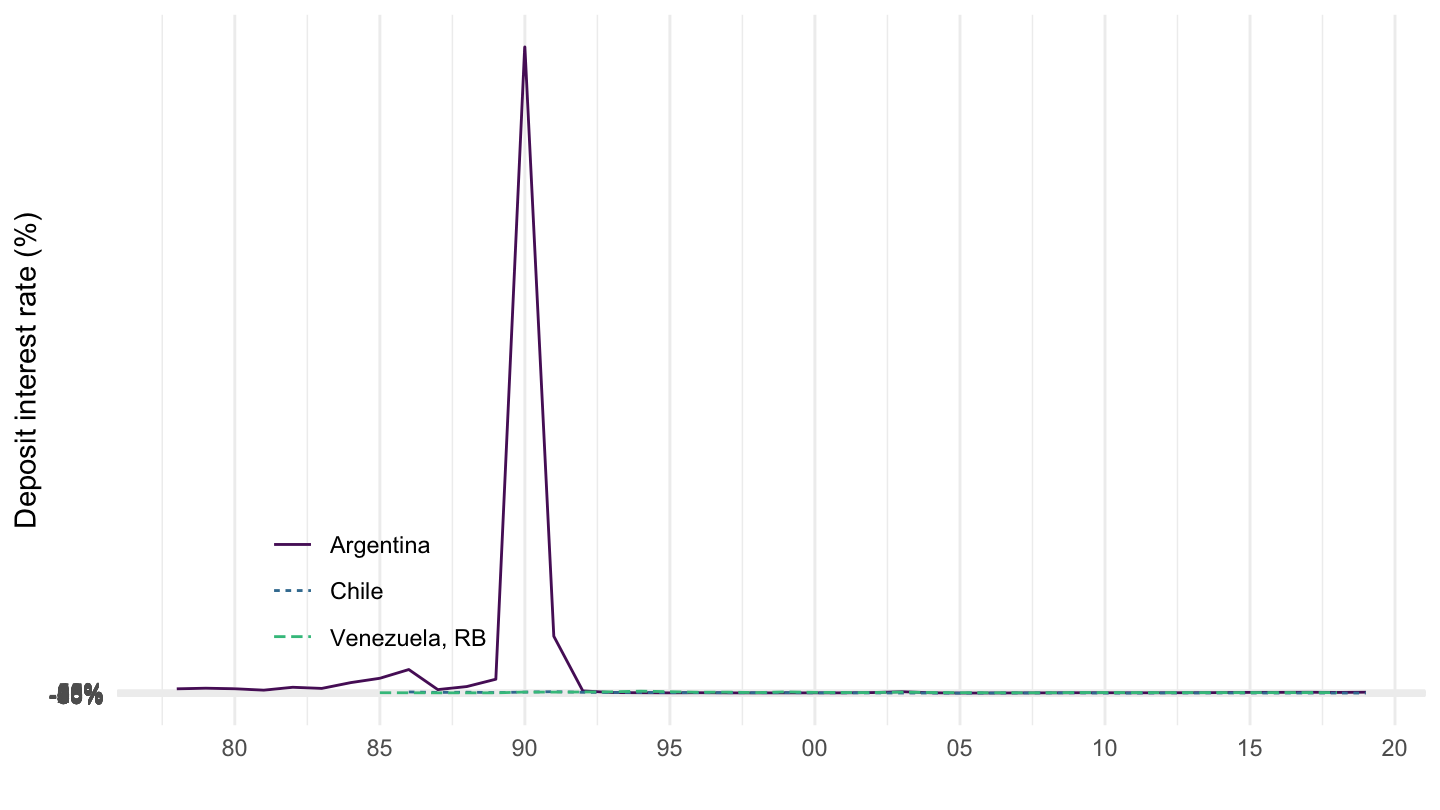
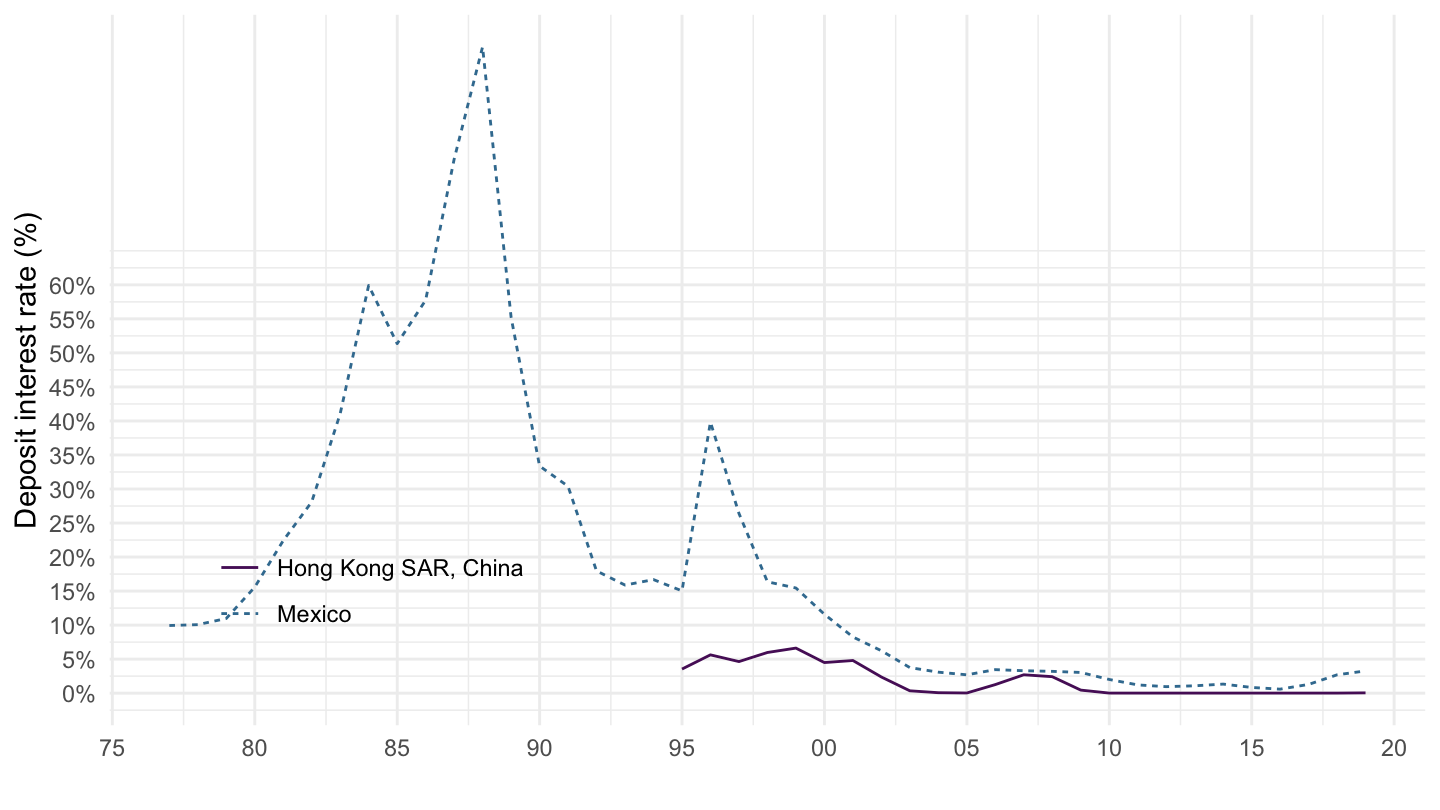
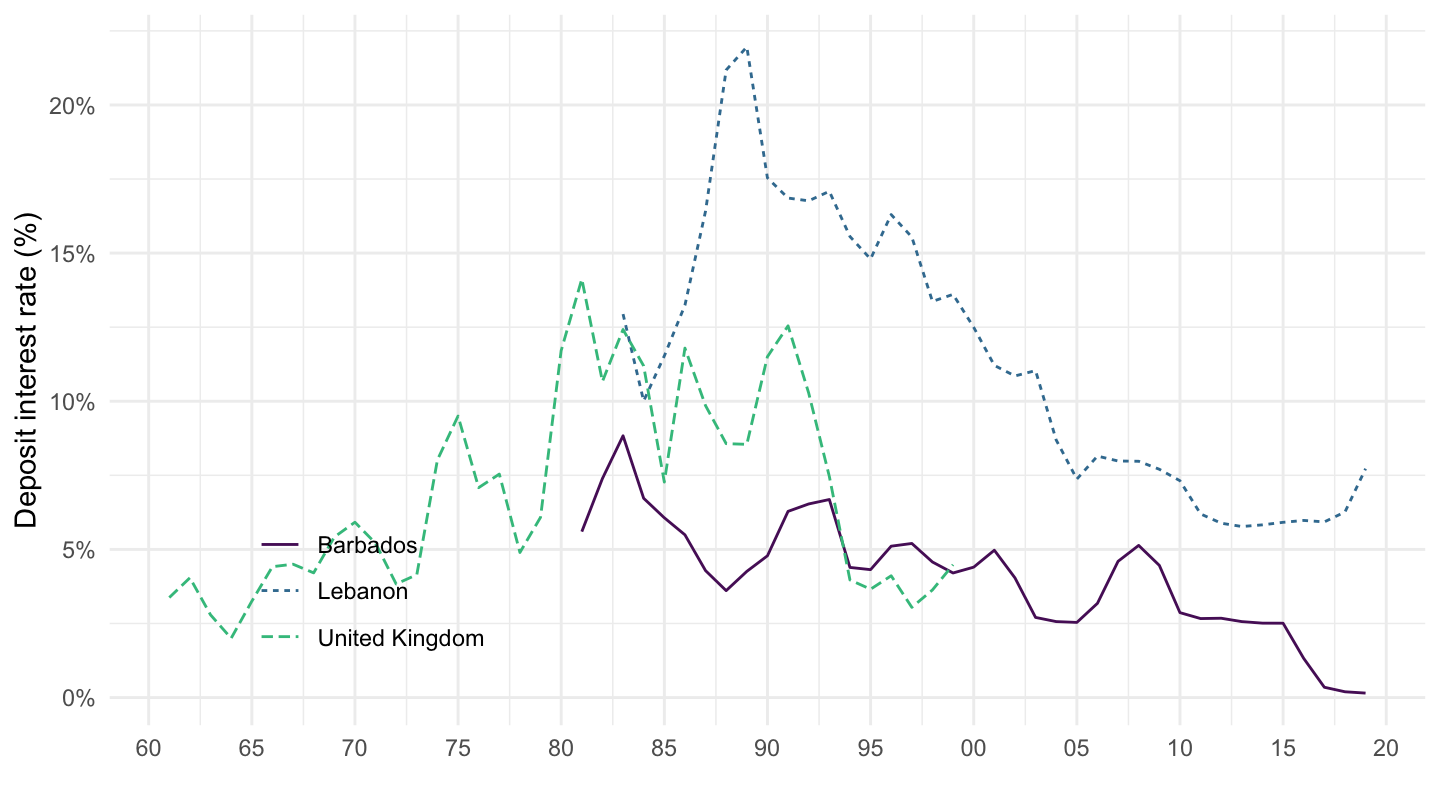
| wdi | FR.INR.DPST | Deposit interest rate (%) | 2026-07-24 | [2026-07-24] |
| bdf | FM | Marché financier, taux | 2026-07-22 | [2026-07-24] |
| bdf | MIR | Taux d'intérêt - Zone euro | NA | [2026-07-24] |
| bdf | MIR1 | Taux d'intérêt - France | 2026-07-23 | [2026-07-24] |
| bis | CBPOL_D | Policy Rates, Daily | 2025-08-20 | [2026-07-18] |
| bis | CBPOL_M | Policy Rates, Monthly | 2024-04-19 | [2026-07-23] |
| ecb | FM | Financial market data | NA | [2026-07-24] |
| ecb | MIR | MFI Interest Rate Statistics | 2025-08-28 | [2026-07-24] |
| eurostat | ei_mfir_m | Interest rates - monthly data | NA | [2026-07-23] |
| eurostat | irt_lt_mcby_d | EMU convergence criterion series - daily data | 2025-07-24 | [2026-07-24] |
| eurostat | irt_st_m | Money market interest rates - monthly data | NA | [2026-07-24] |
| fred | r | Interest Rates | 2026-07-23 | [2026-07-23] |
| oecd | MEI | Main Economic Indicators | 2025-07-24 | [2024-04-16] |
| oecd | MEI_FIN | Monthly Monetary and Financial Statistics (MEI) | 2025-07-24 | [2024-09-15] |
| wdi | FR.INR.LEND | Lending interest rate (%) | 2026-07-24 | [2026-07-24] |
| wdi | FR.INR.RINR | Real interest rate (%) | 2026-07-24 | [2026-07-24] |