Last data update: 08 oct. 2026, 16:49
Last compile: 16 oct. 2026, 01:43
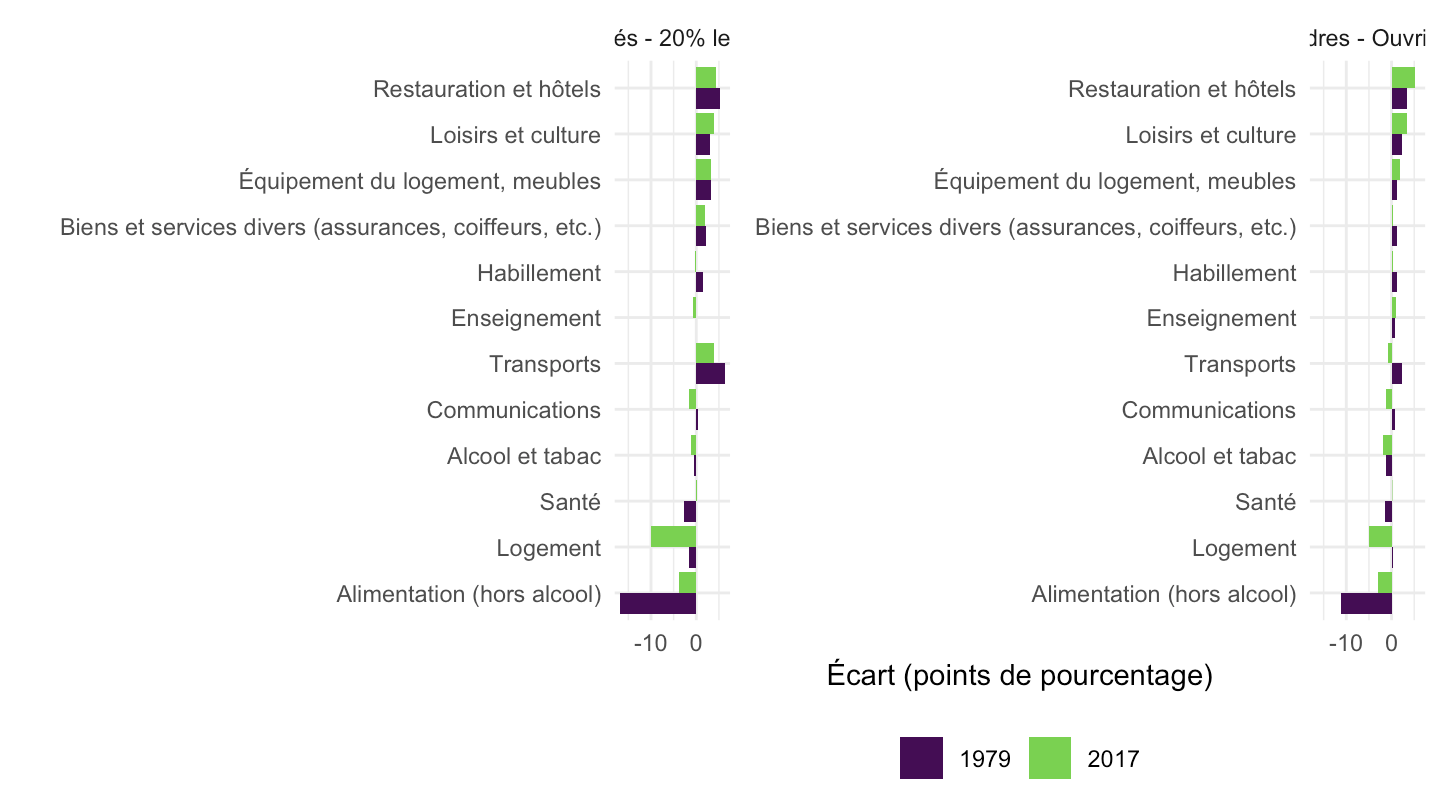
if203_fig1 |>
  mutate(Coicop = fct_reorder(Coicop, value, .fun = max)) |>
  ggplot() + geom_col(aes(x = Coicop, y = value, fill = Quintile), position = position_dodge()) +
  coord_flip() +
  theme_minimal() + xlab("") + ylab("Part dans la consommation (%)") +
  theme(legend.title = element_blank(), legend.position = "bottom") +
  guides(fill = guide_legend(nrow = 3)) +
  scale_fill_viridis_d()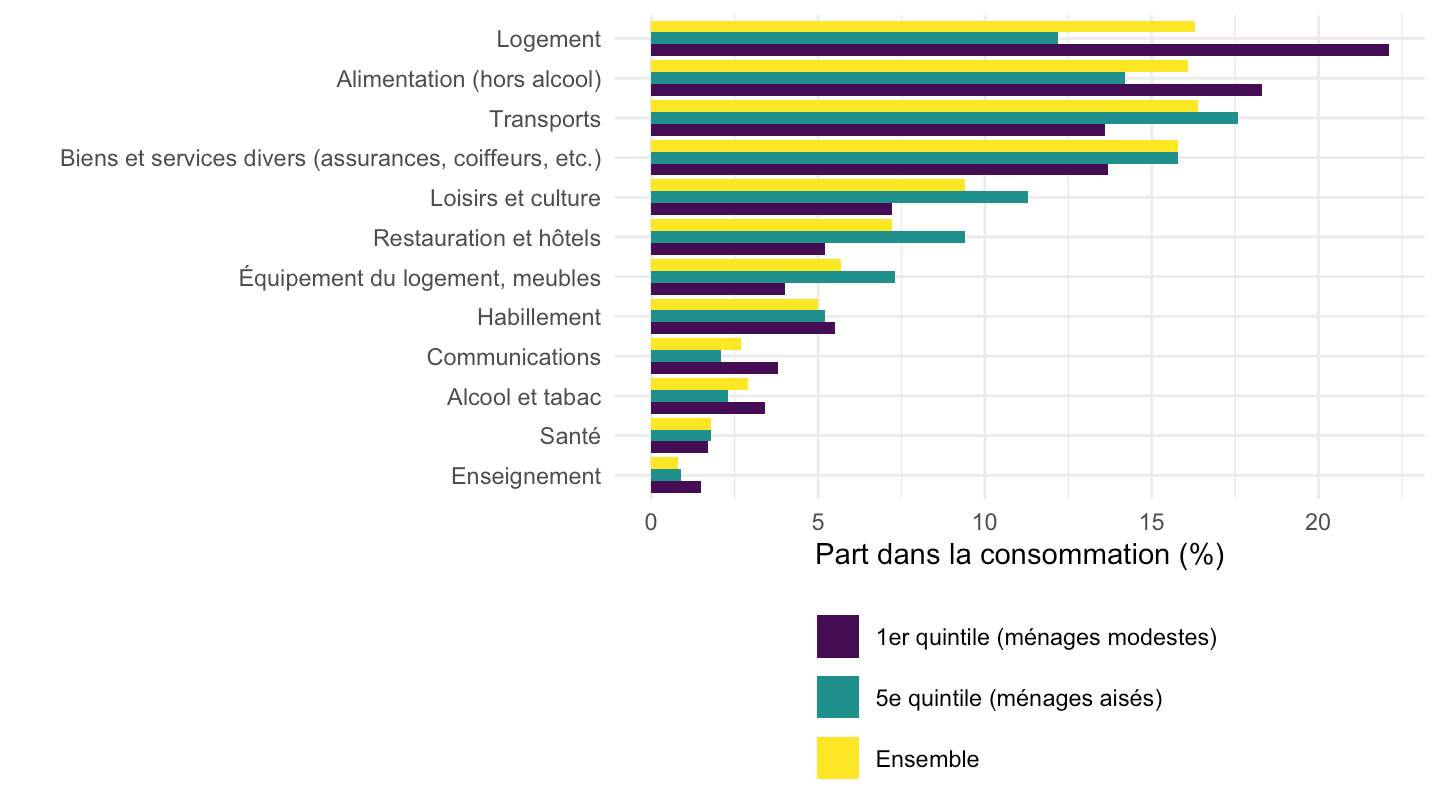
if203_fig2 |>
  filter(Quintile != "Ensemble") |>
  mutate(Coicop = fct_reorder(Coicop, value, .fun = max)) |>
  ggplot() + geom_col(aes(x = Coicop, y = value, fill = Quintile), position = position_dodge()) +
  facet_wrap(~ prop_loc) +
  coord_flip() +
  theme_minimal() + xlab("") + ylab("Part dans la consommation (%)") +
  theme(legend.title = element_blank(), legend.position = "bottom") +
  guides(fill = guide_legend(nrow = 2)) +
  scale_fill_viridis_d()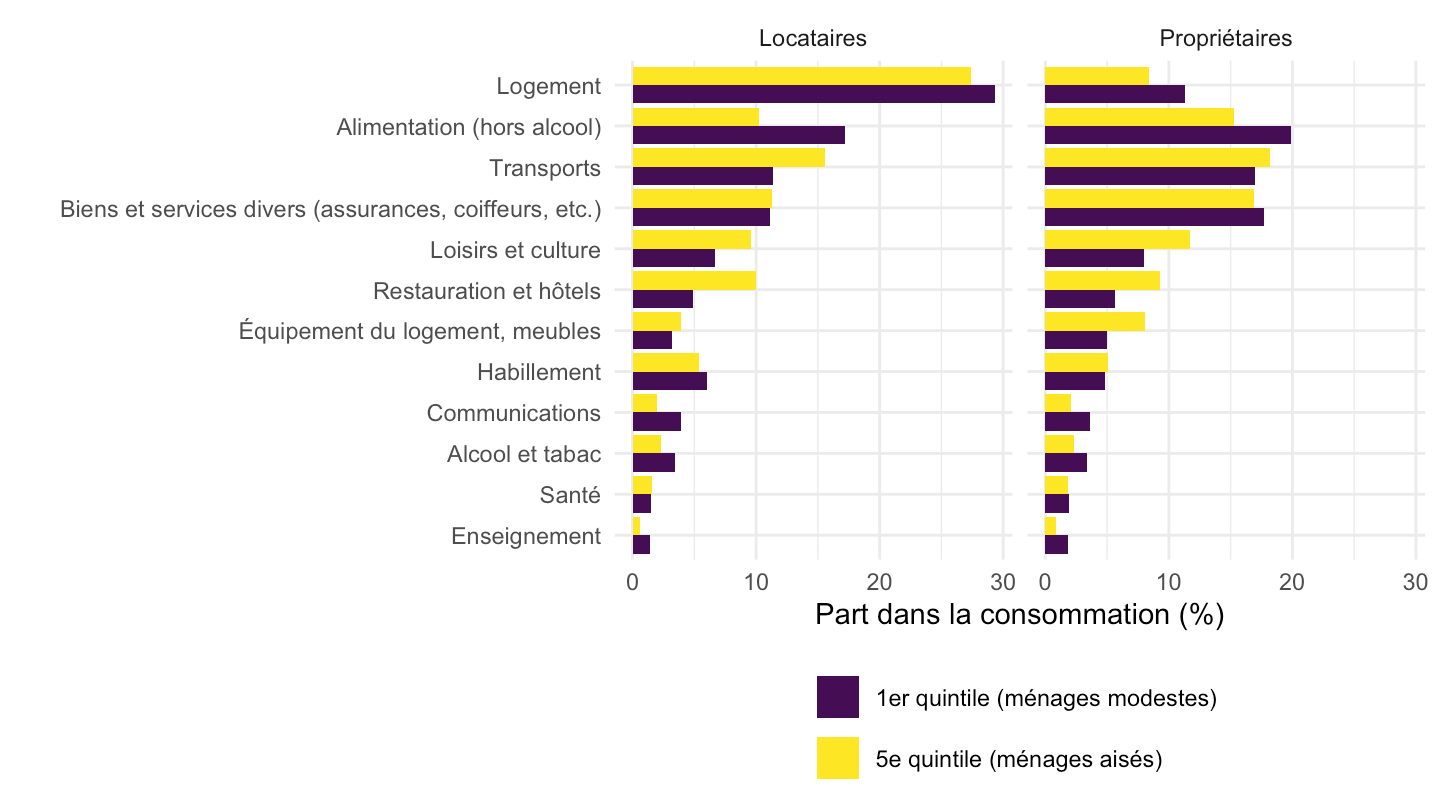
if203_fig3 |>
  ggplot() + geom_col(aes(x = Coicop, y = value, fill = Type_menage), position = position_dodge()) +
  coord_flip() +
  theme_minimal() + xlab("") + ylab("Part dans la consommation (%)") +
  theme(legend.title = element_blank(), legend.position = "bottom") +
  guides(fill = guide_legend(nrow = 2)) +
  scale_fill_viridis_d()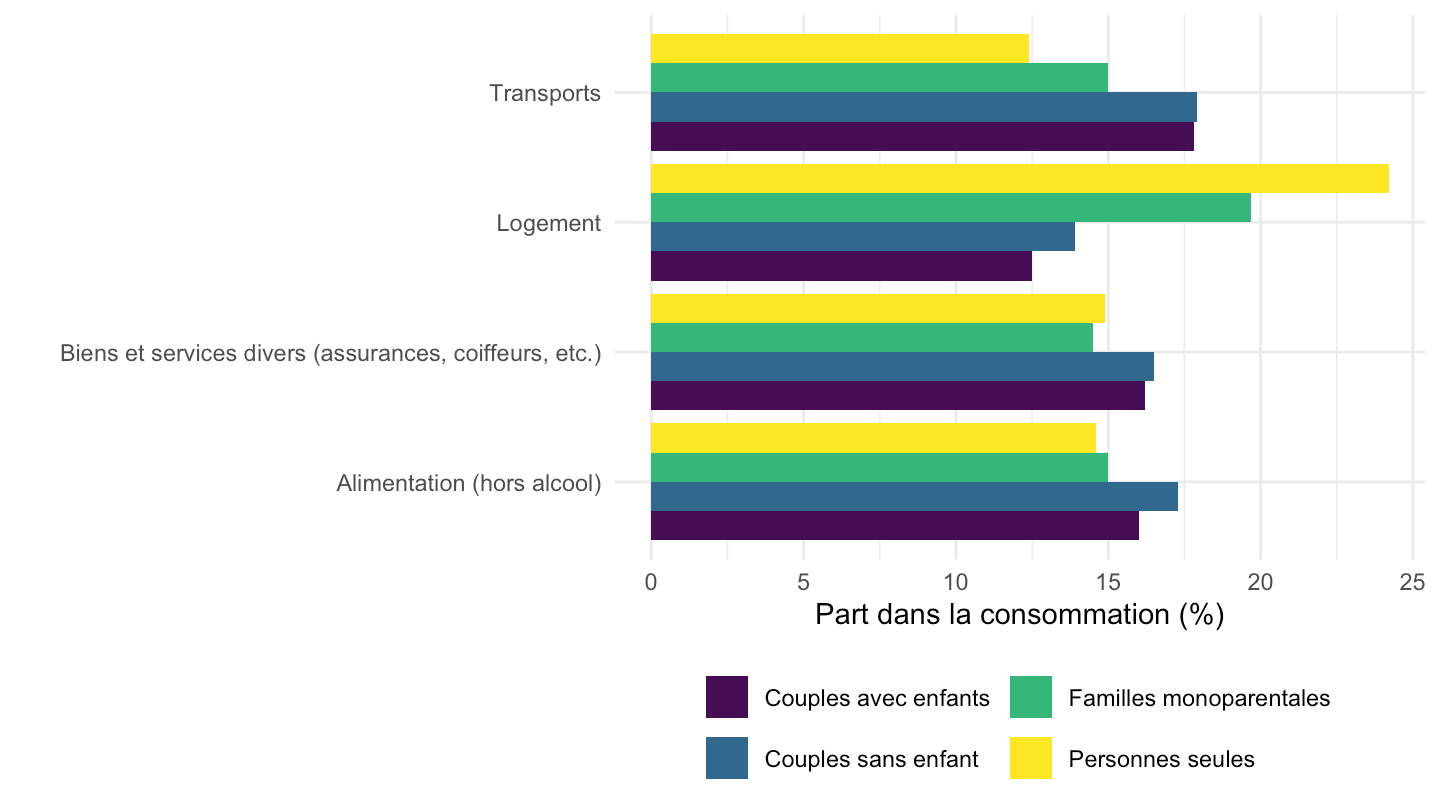
if203_fig4 |>
  mutate(annee = factor(annee), Coicop = fct_reorder(Coicop, value, .fun = min)) |>
  ggplot() + geom_col(aes(x = Coicop, y = value, fill = annee), position = position_dodge()) +
  facet_wrap(~ comparaison, scales = "free_y") +
  coord_flip() +
  theme_minimal() + xlab("") + ylab("Écart (points de pourcentage)") +
  theme(legend.title = element_blank(), legend.position = "bottom") +
  scale_fill_viridis_d(end = 0.8)