
Last observation: 2025 (N = 101)
First observation: 1949 (N = 74)
Last data update: 08 sept. 2026, 14:36
Last compile: 10 oct. 2026, 01:51
« Mesurer “le” pouvoir d’achat », F. Geerolf, hal-05505752, 9 juillet 2024. [ html] [ pdf] [ handouts] [ slides] [ slides] [ github]
« La taxe inflationniste, le pouvoir d’achat, le taux d’épargne et le déficit public », F. Geerolf, hal-05506068, 9 juillet 2024. [ html] [ pdf] [ handouts] [ slides] [ slides] [ github]
« Inflation en France : IPC ou IPCH ? », F. Geerolf, hal-05502577, 9 juillet 2024. [ html] [ pdf] [ handouts] [ slides] [ slides] [ github]
ig_b("insee", "t_7401_1")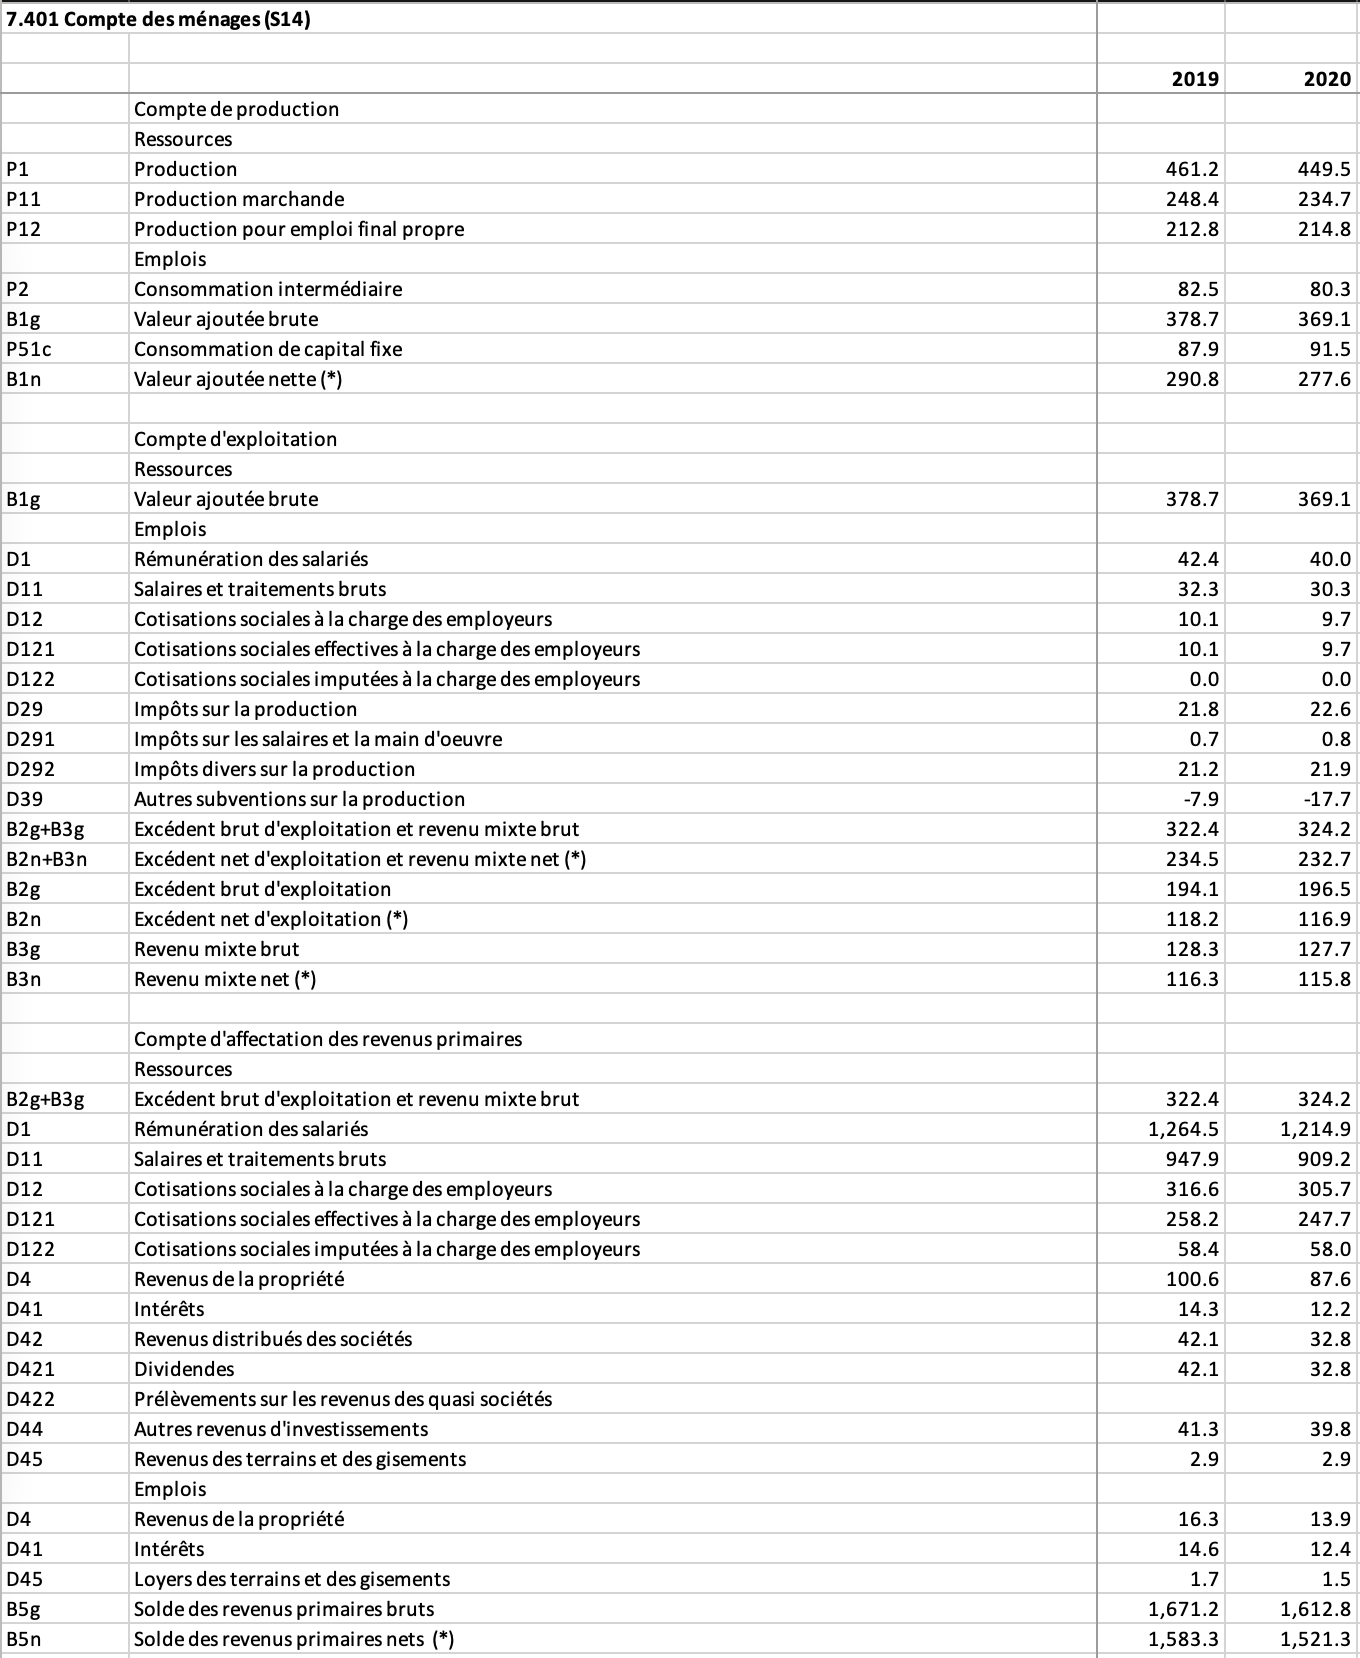
ig_b("insee", "t_7401_2")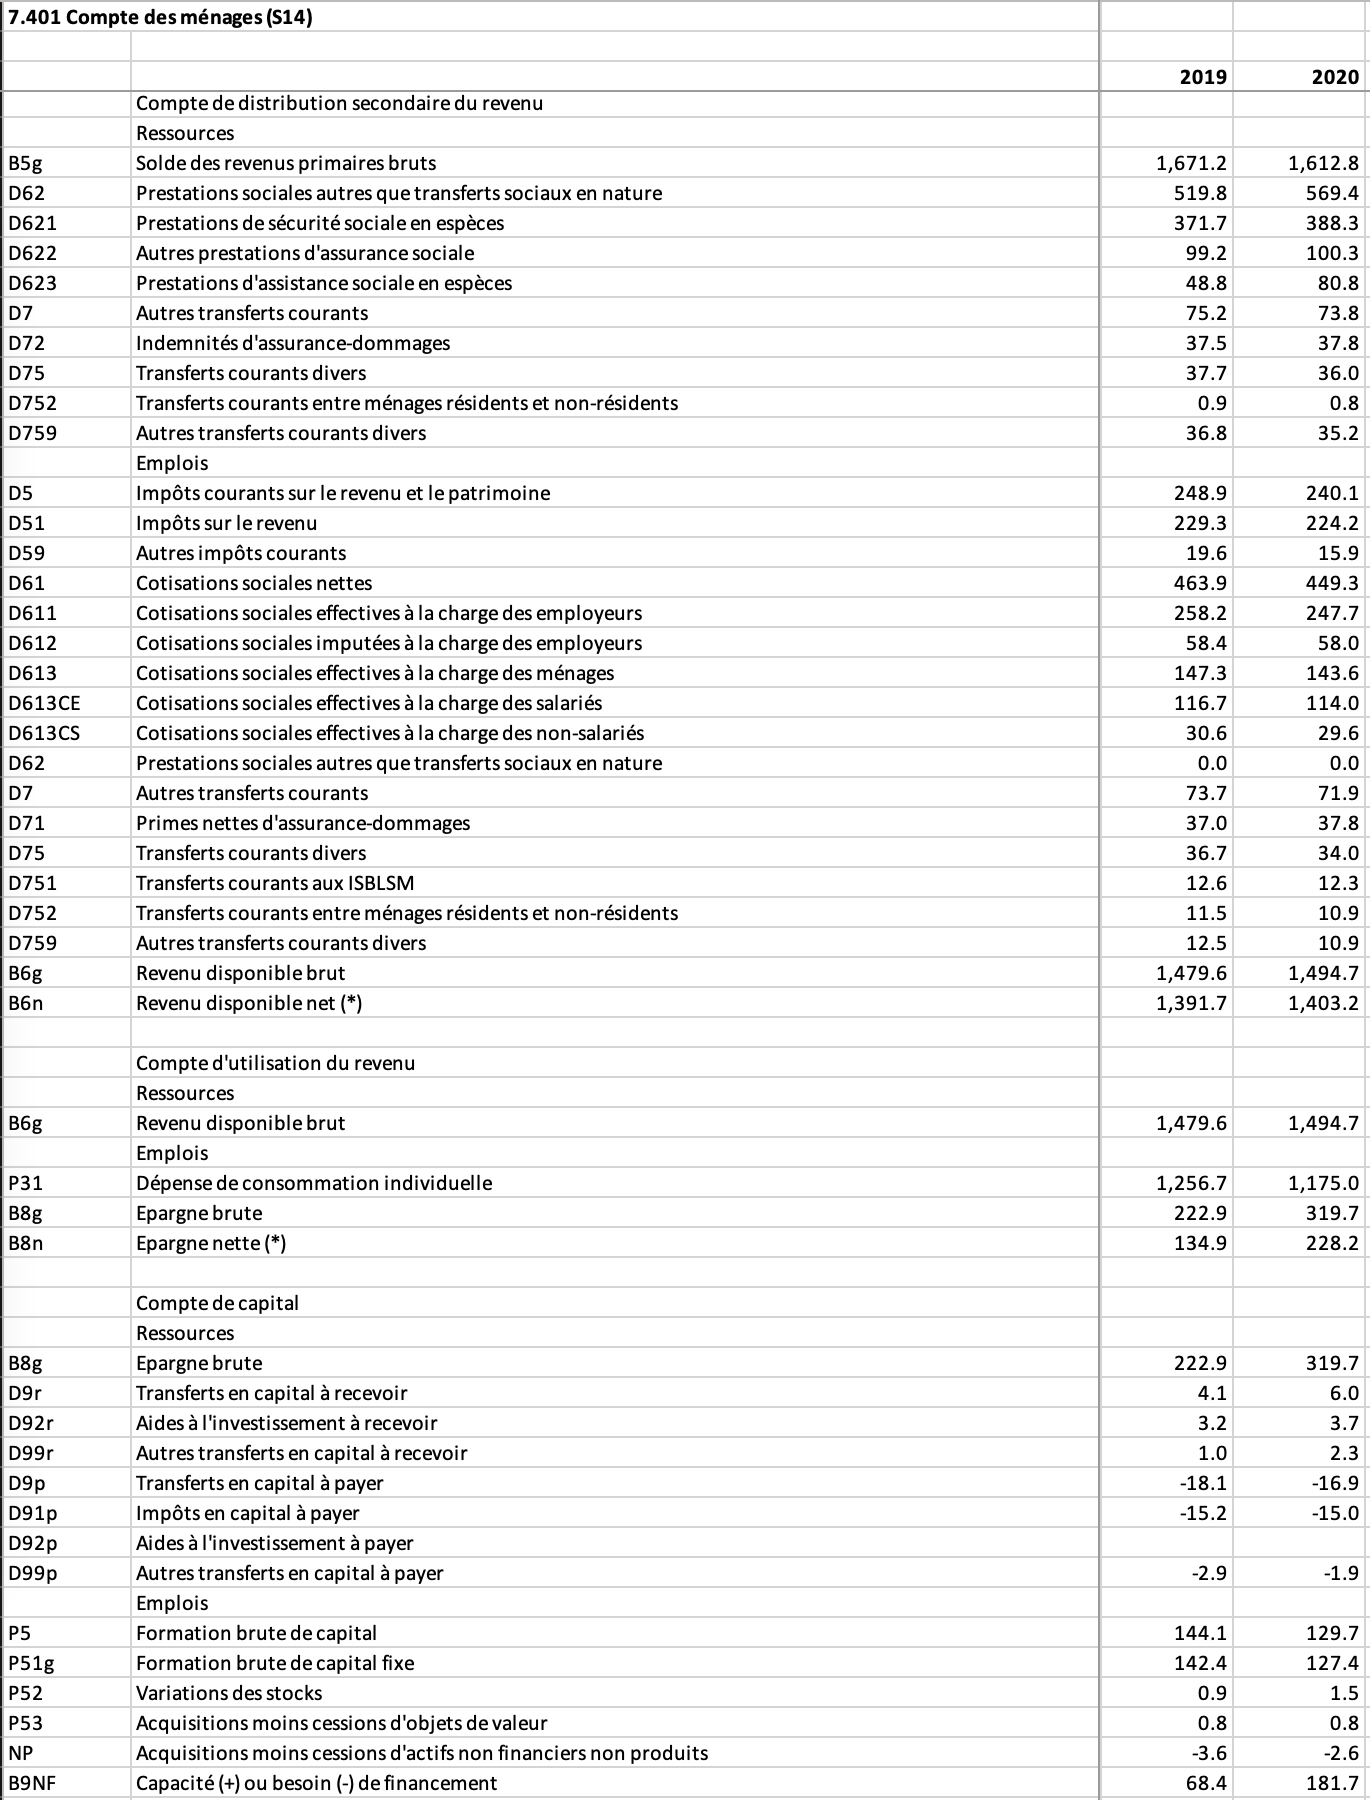
ig_b("insee", "t_7401_3")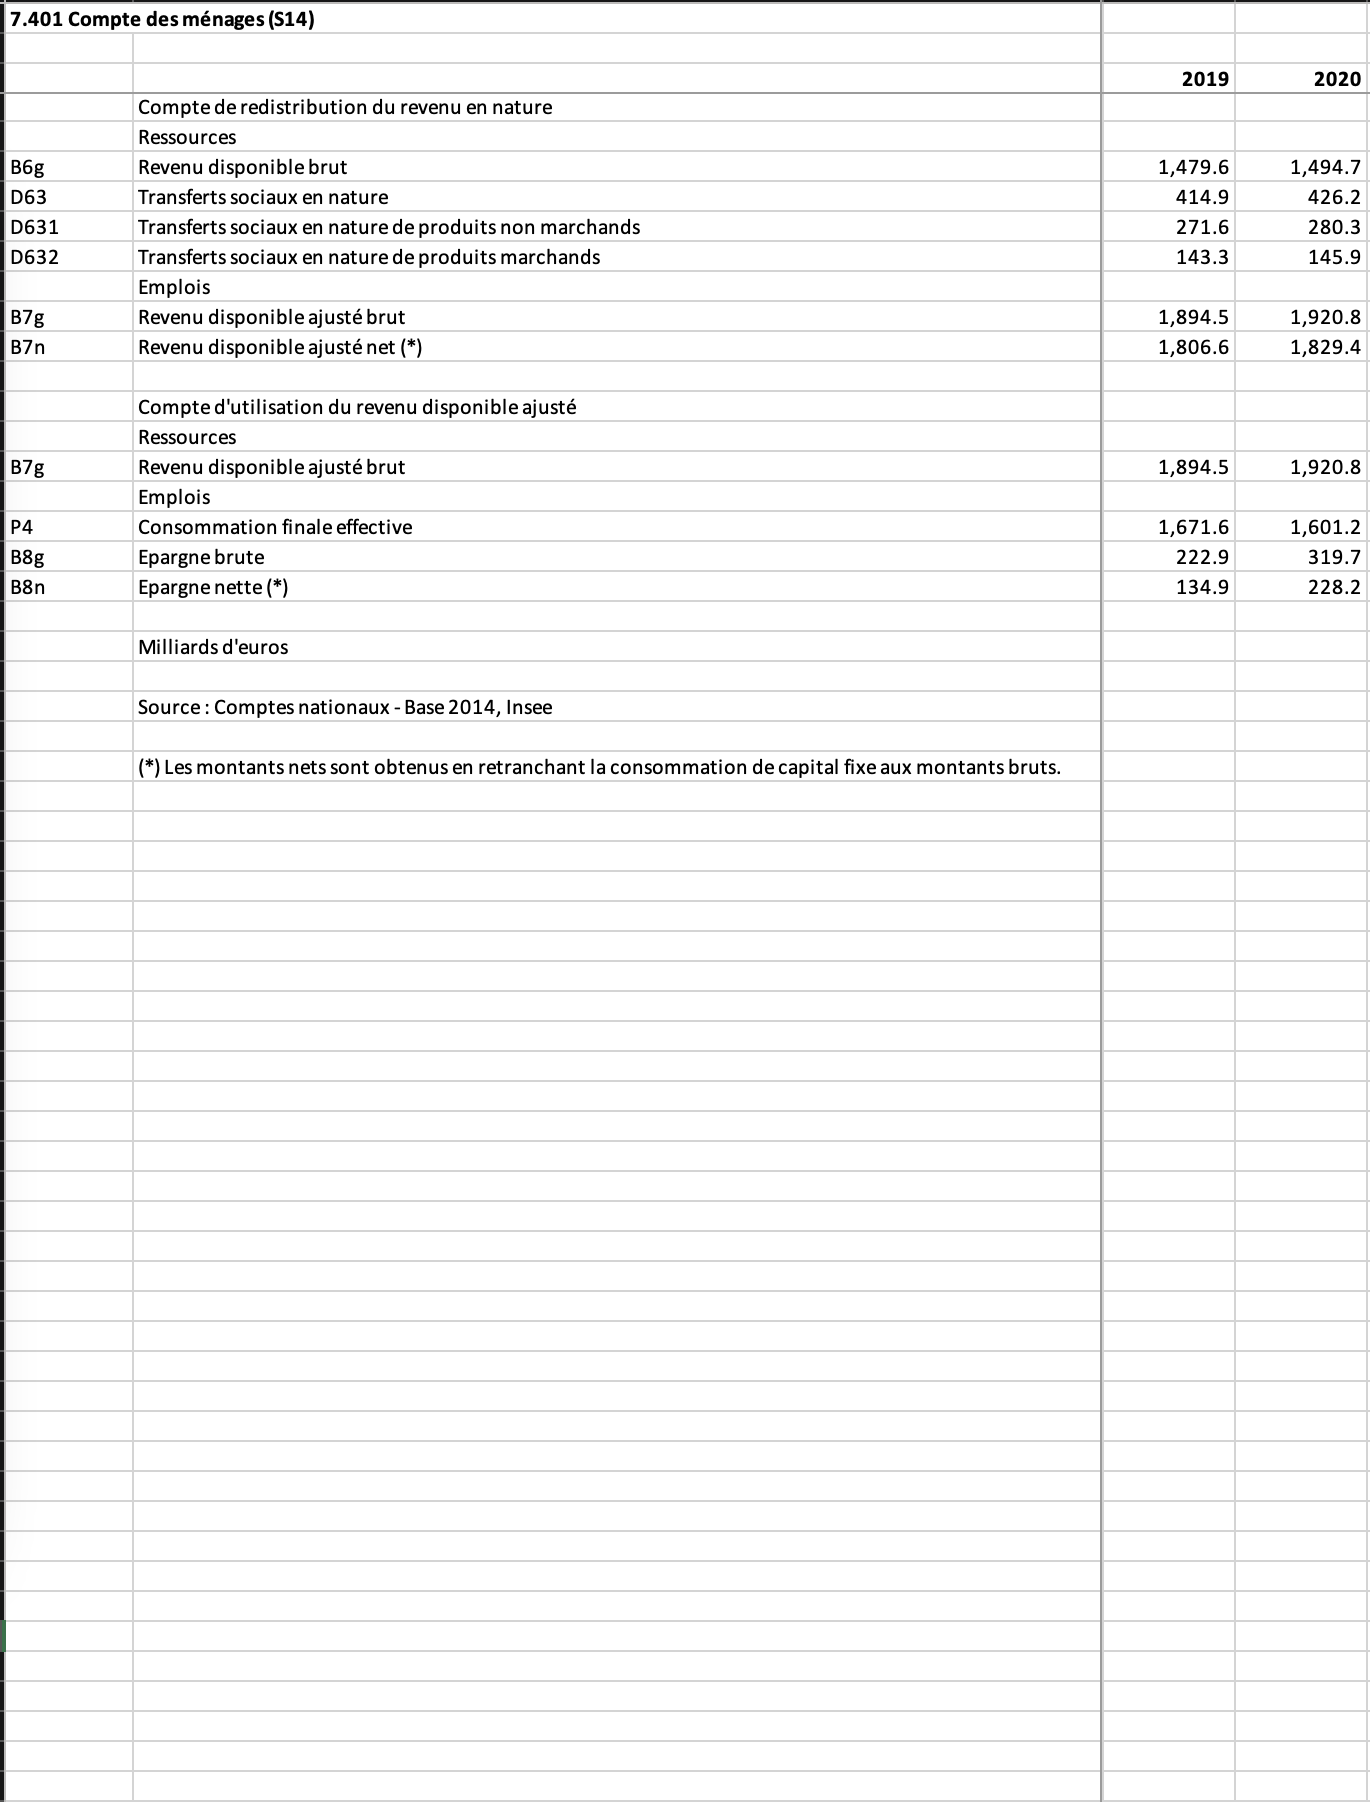
ig_b("insee", "t_7401_bind")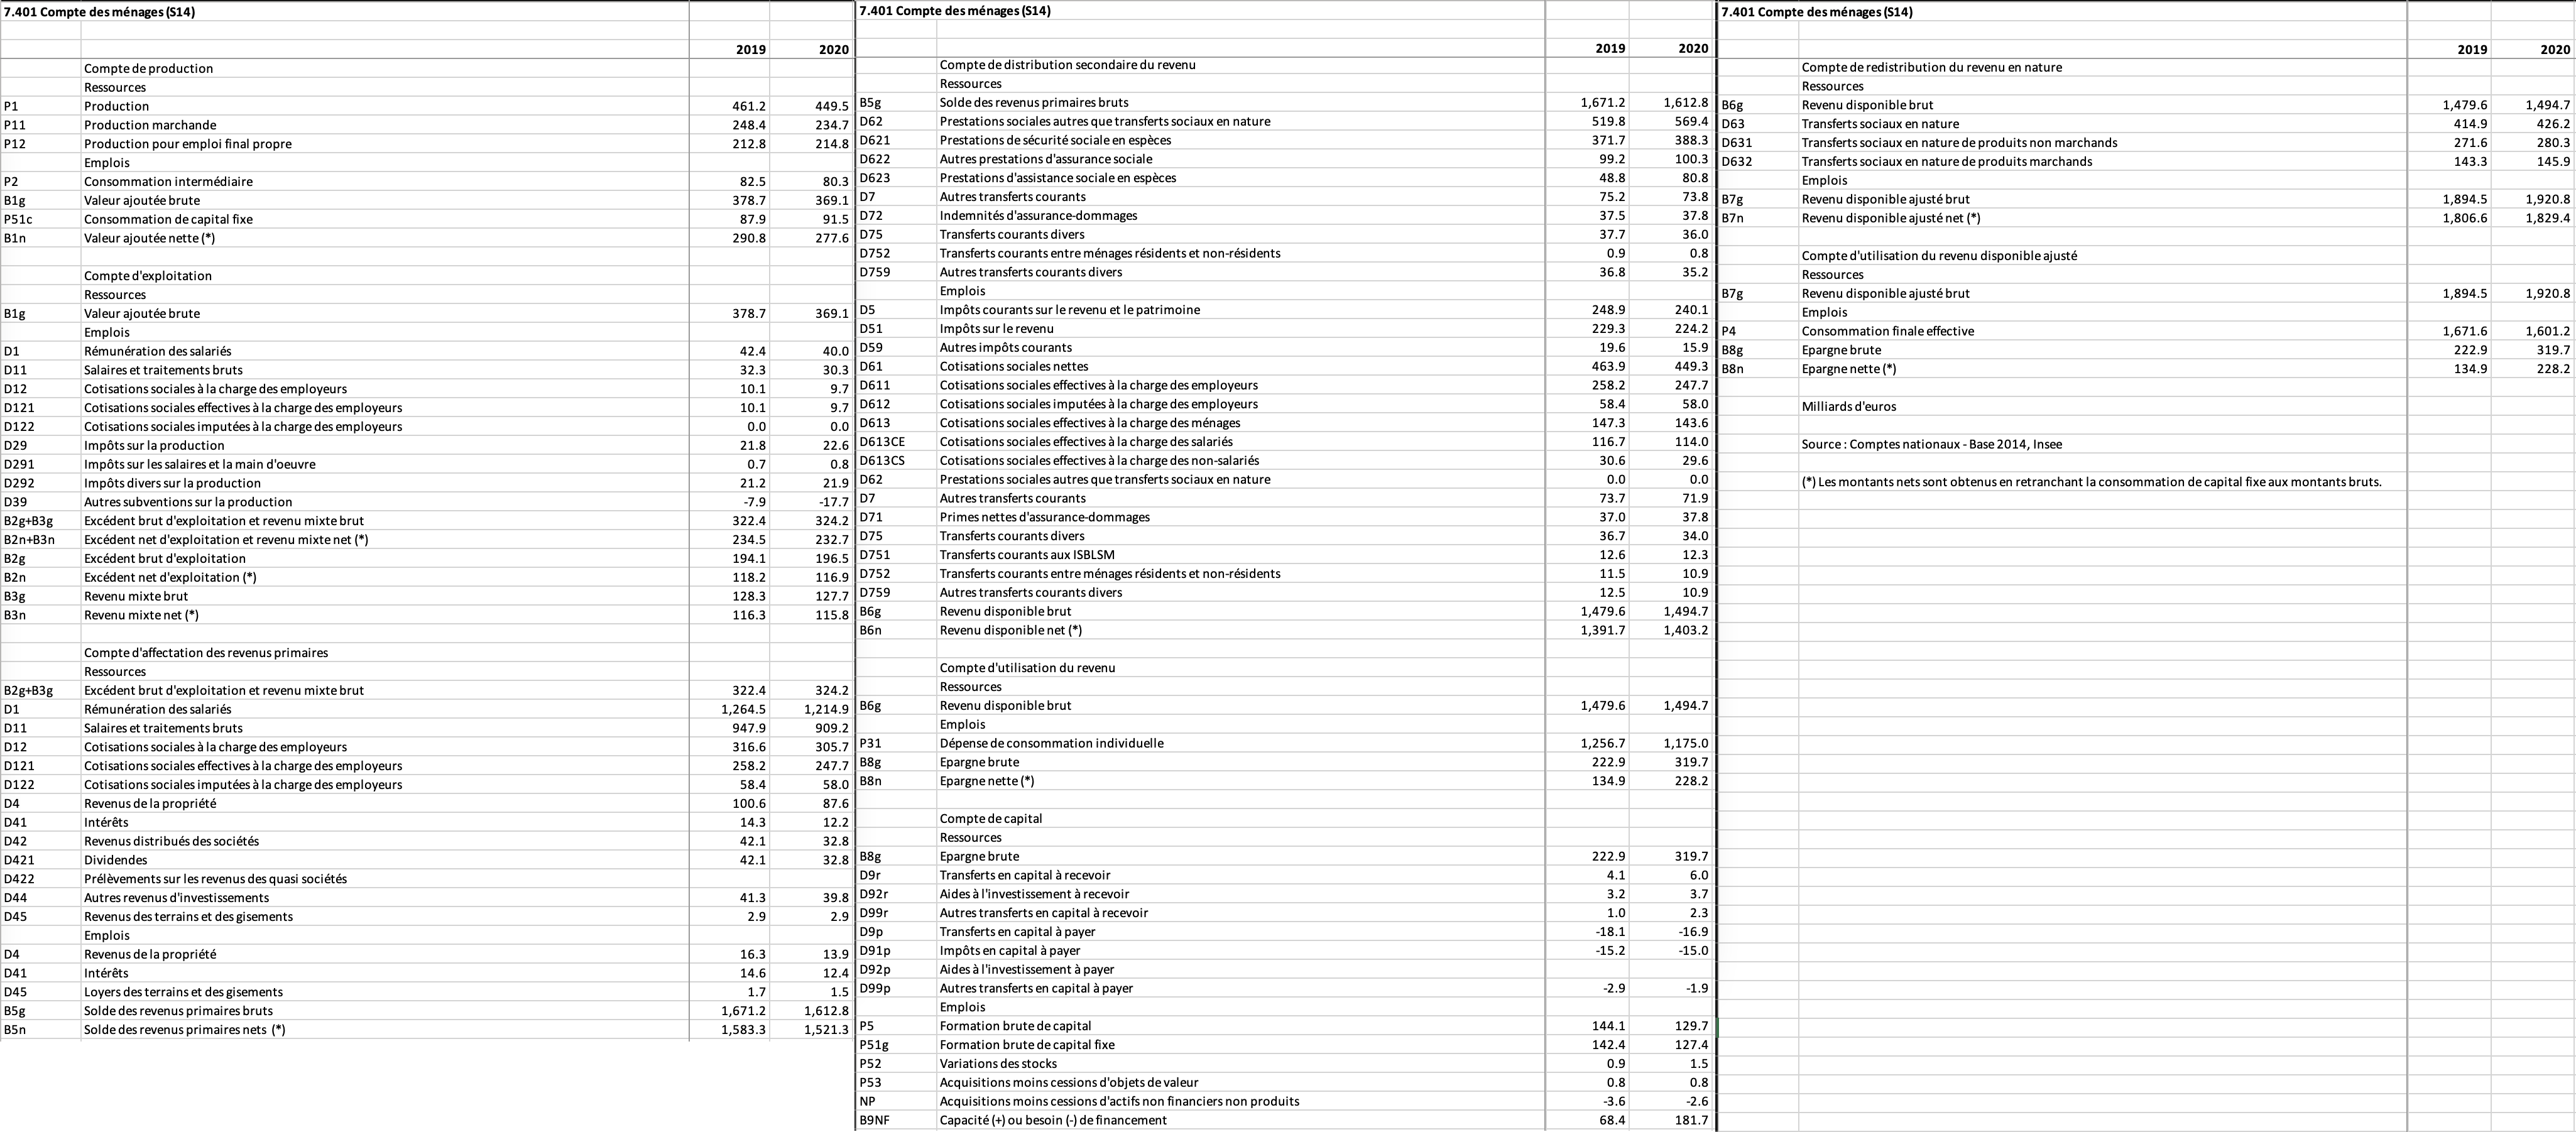
7.401 – Compte des ménages (S14) (En milliards d’euros):
ig_b("insee", "FPORSOC22", "F29", "table2")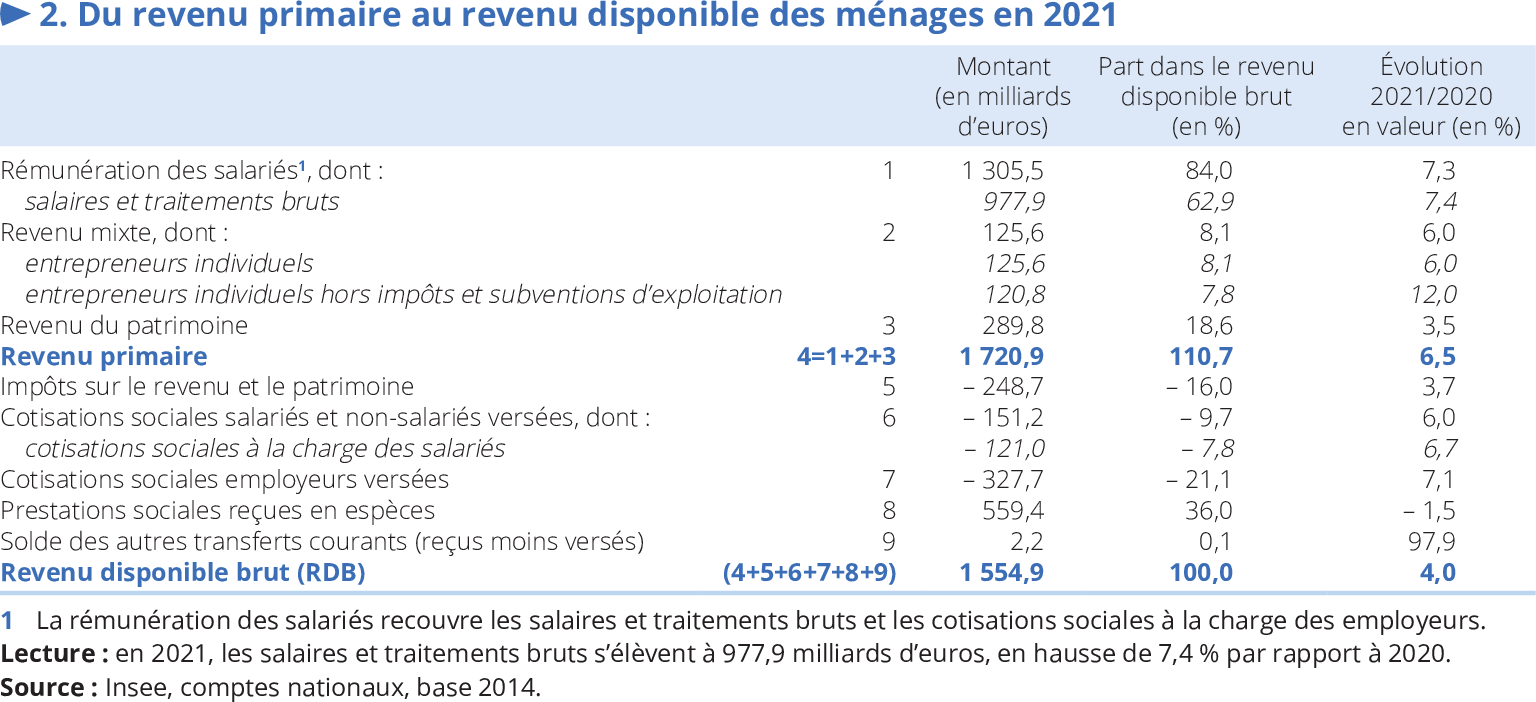
ig_b("insee", "FPS2021", "revenu-primaire-RDB")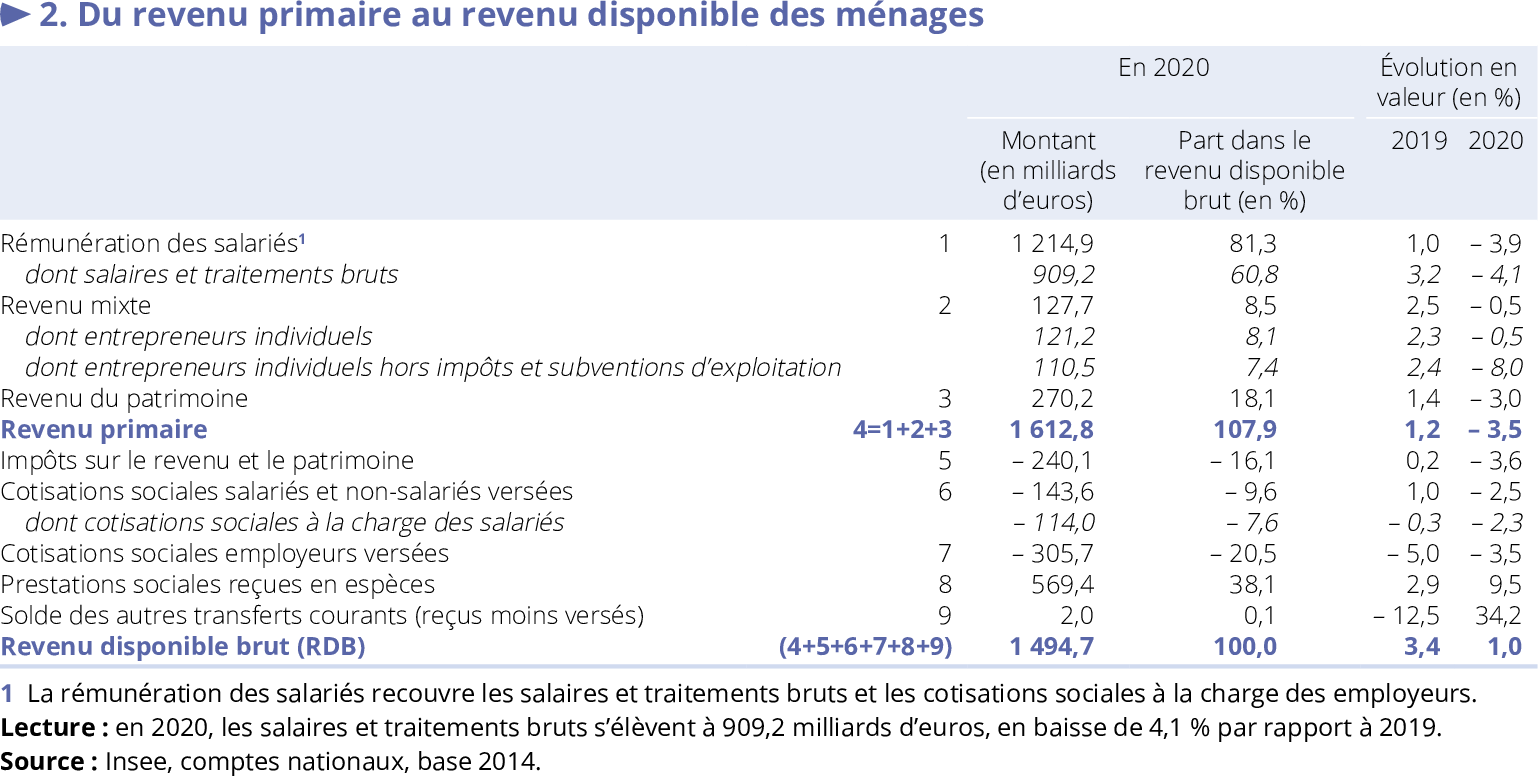
ig_b("insee", "FPS2021", "EC4", "tab1")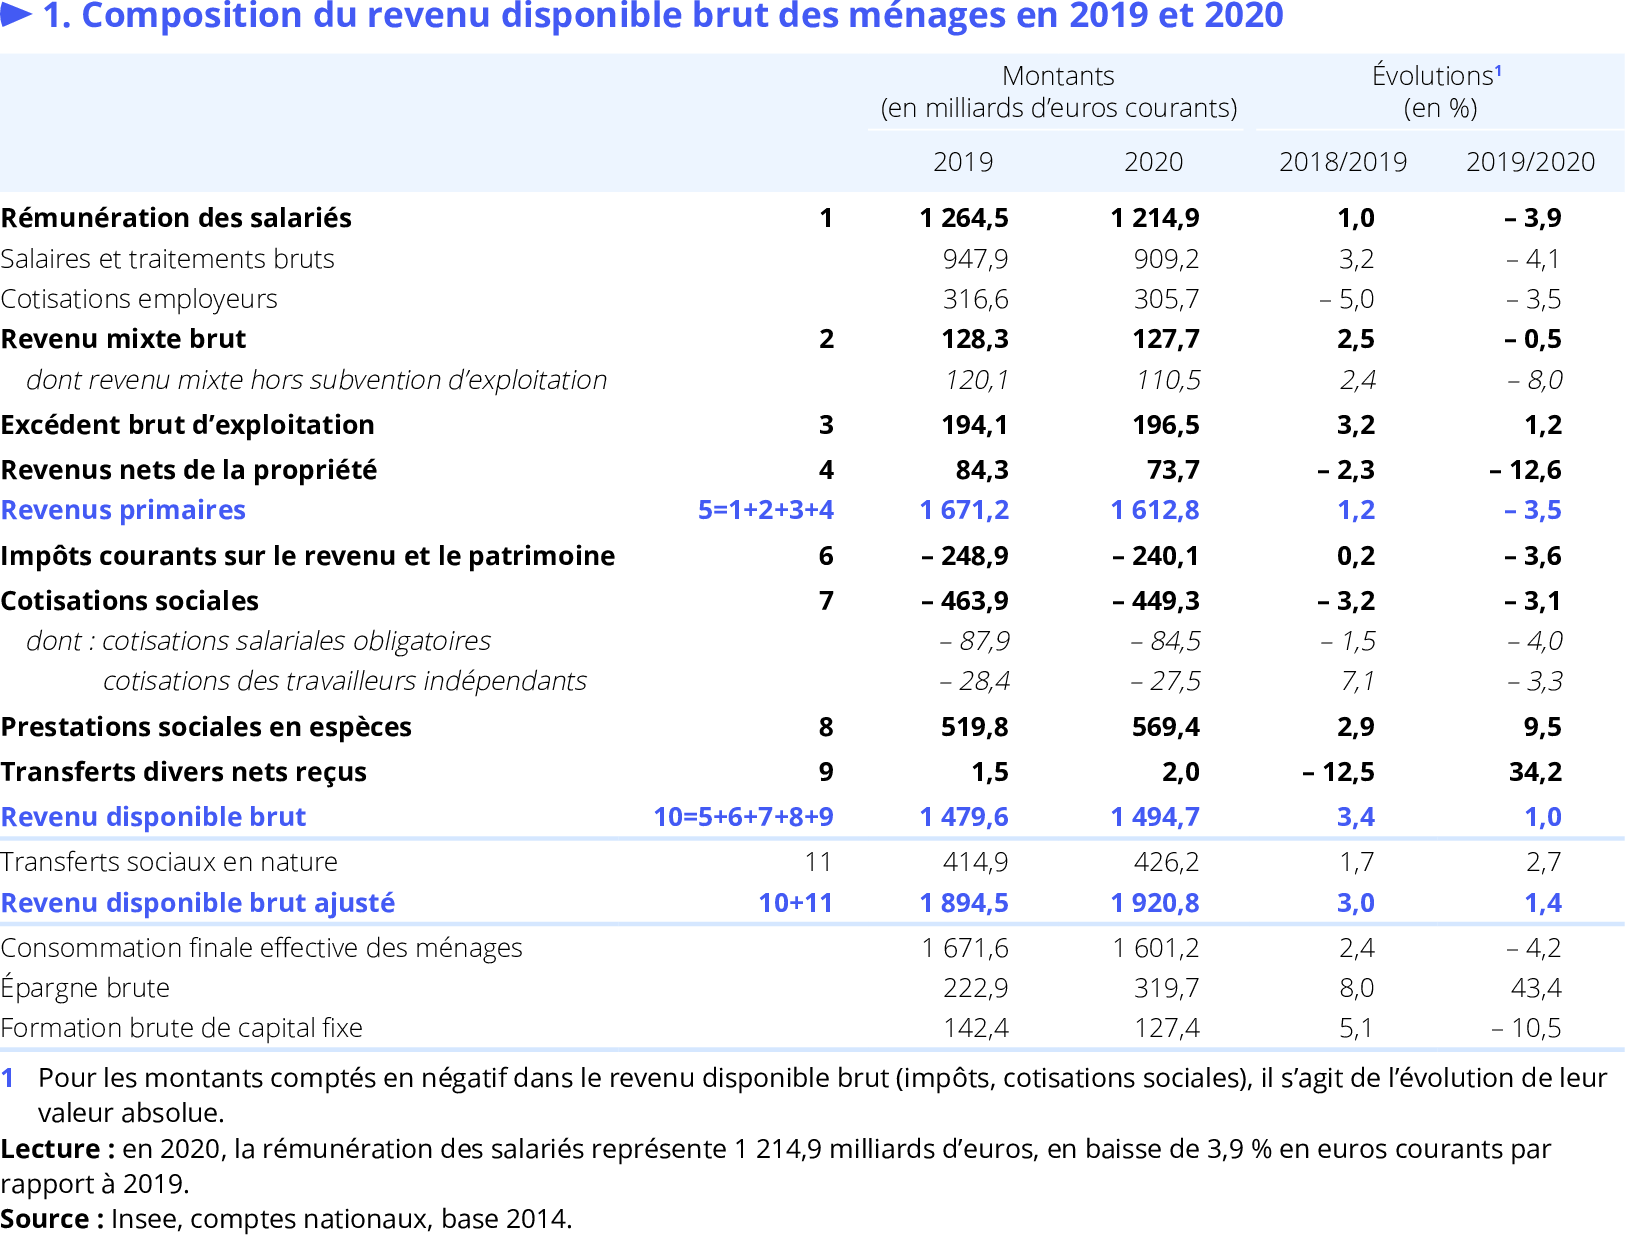
ig_b("insee", "TEF2020", "057", "prestations-sociales")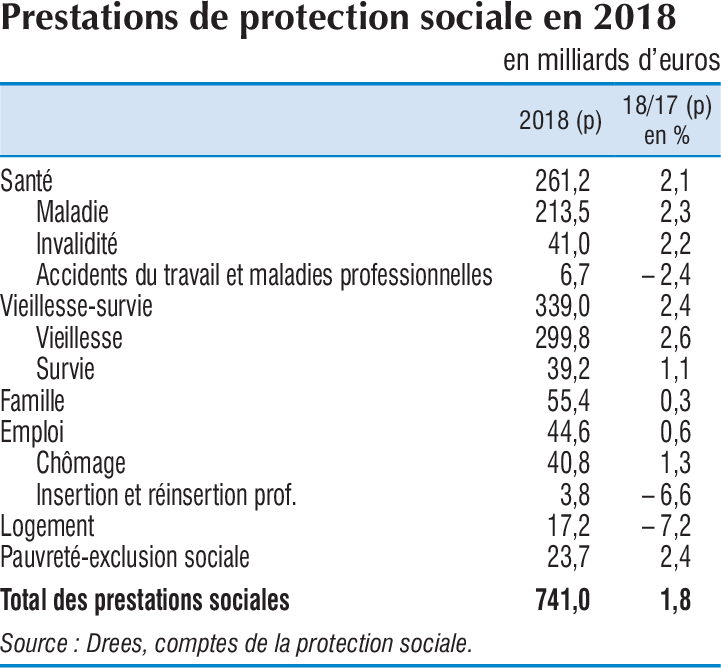
T_7401 |>
  group_by(line, variable, Variable) |>
  summarise(Nobs = n()) |>
  print_table_conditional()
gdp |>
print_table_conditional()T_7401 |>
filter(year %in% c("2017", "2024")) |>
select(line, code, label, year, value) |>
spread(year, value) |>
mutate(croissance = round(100*(`2024`/`2017`-1), 2)) |>
arrange(desc(croissance)) |>
print_table_conditional()T_7401 |>
filter(year %in% c(paste0(seq(1980, 2100, 20)), 2023)) |>
select(line, variable, Variable, year, value) |>
spread(year, value) |>
arrange(line) %>%
mutate_at(vars(-line, -variable, -Variable), funs(round(.))) |>
print_table_conditional()T_7401 |>
left_join(gdp, by = "year") |>
mutate(value_gdp = round(100 * value / gdp, 1)) |>
filter(year %in% c(paste0(seq(1980, 2100, 20)), 2023)) |>
select(-value, -gdp) |>
spread(year, value_gdp) |>
arrange(line) |>
print_table_conditional()T_7401 |>
filter(line %in% c(52, 30, 22)) |>
left_join(gdp, by = "year") |>
year_to_date2() |>
ggplot() + geom_line(aes(x = date, y = value / gdp, color = Variable)) +
theme_minimal() + xlab("") + ylab("% du PIB") +
scale_x_date(breaks = as.Date(paste0(seq(1940, 2100, 5), "-01-01")),
labels = date_format("%Y")) +
scale_y_continuous(breaks = 0.01*seq(-10, 100, 2),
labels = percent_format(accuracy = 1)) +
theme(legend.position = c(0.6, 0.9),
legend.title = element_blank())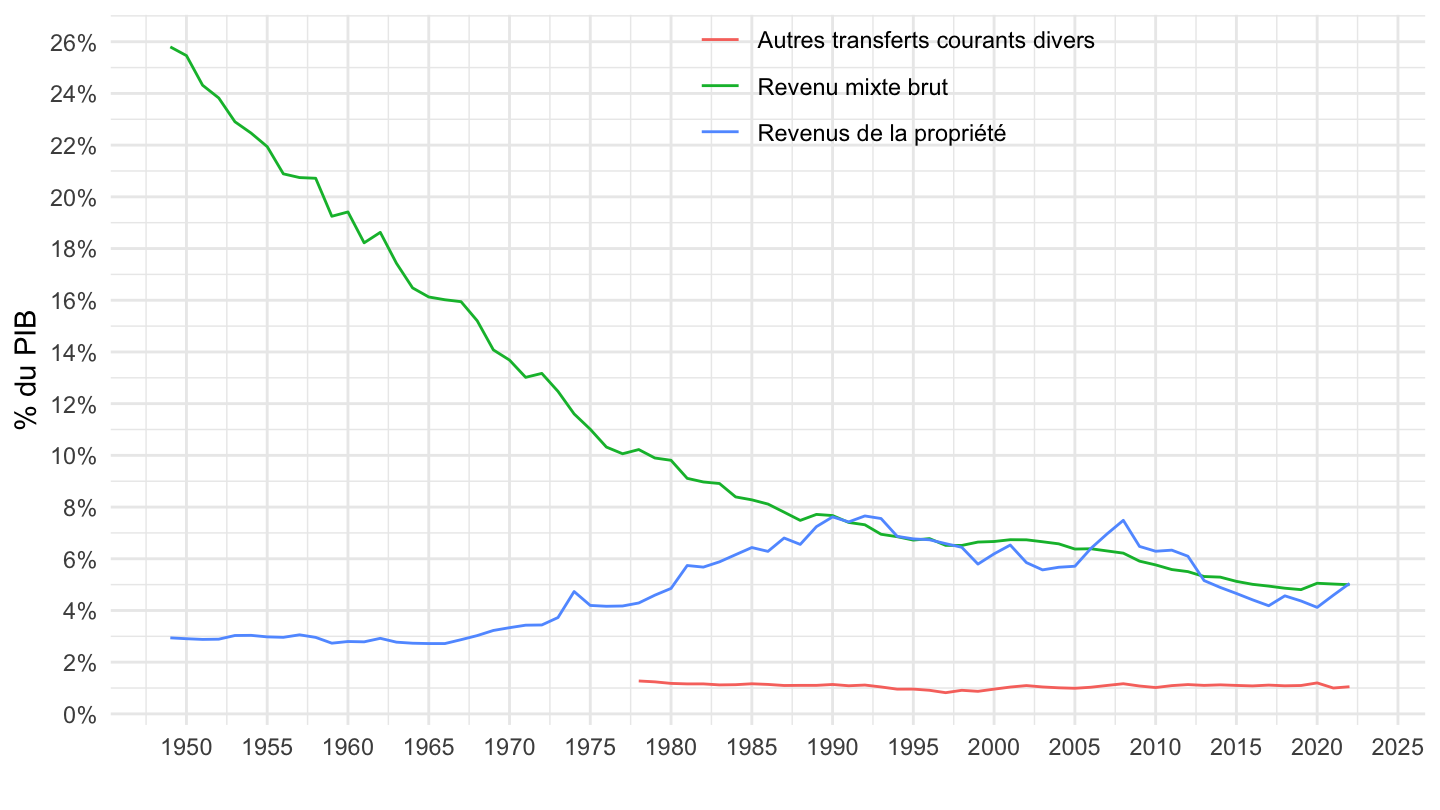
T_7401 |>
  filter(line %in% c(52, 30, 22)) |>
  left_join(gdp, by = "year") |>
  year_to_date2() |>
  filter(date >= as.Date("1995-01-01")) |>
  ggplot() + geom_line(aes(x = date, y = value / gdp, color = Variable)) +
  theme_minimal() + xlab("") + ylab("% du PIB") +
  scale_x_date(breaks = seq(1920, 2100, 2) |> paste0("-01-01") |> as.Date(),
               labels = date_format("%Y")) +
  scale_y_continuous(breaks = 0.01*seq(-10, 100, 1),
                     labels = percent_format(accuracy = 1)) +

  theme(legend.position = c(0.3, 0.9),
        legend.title = element_blank())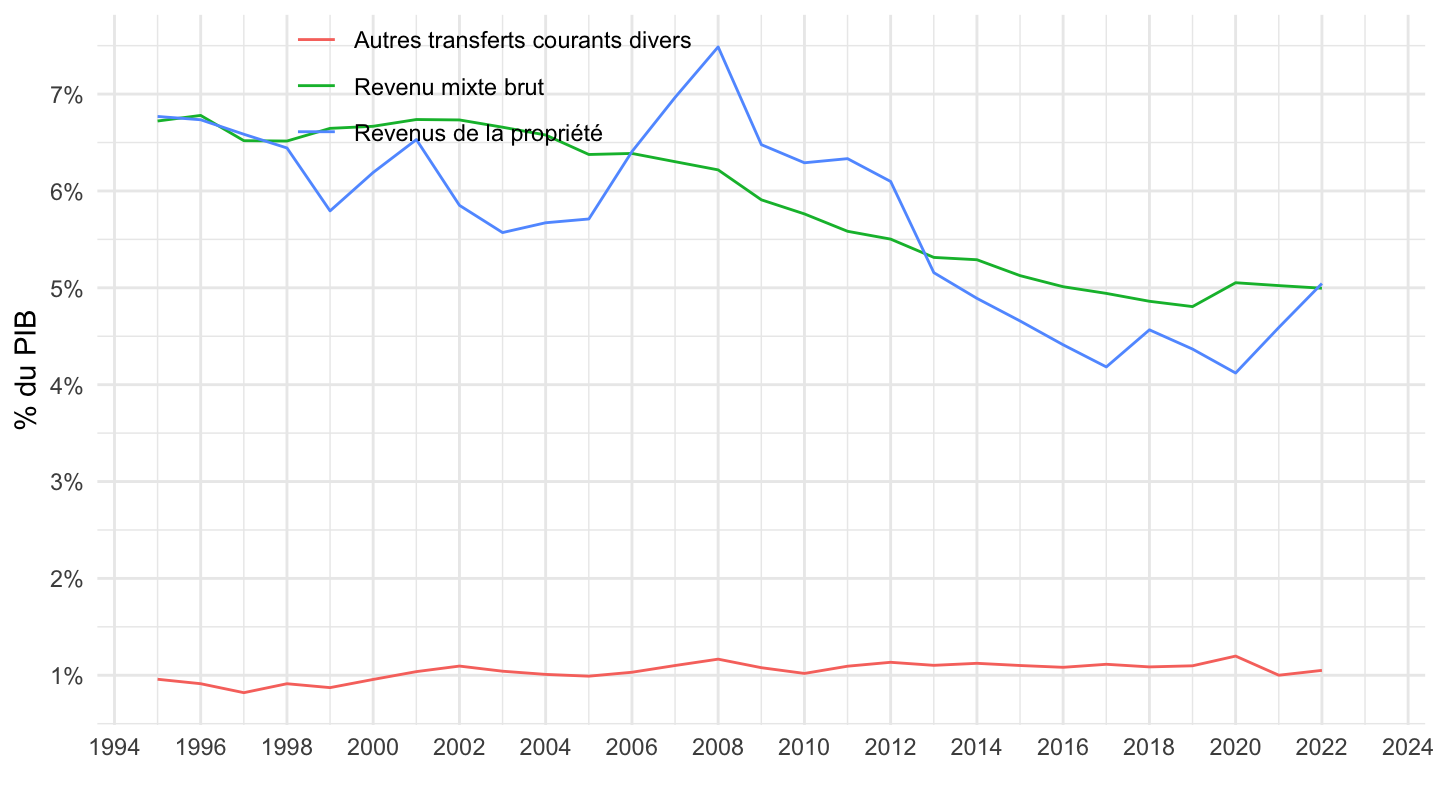
T_7401 |>
  filter(variable %in% c("B6G", "B7G")) |>
  left_join(gdp, by = "year") |>
  year_to_date2() |>
  ggplot() + geom_line(aes(x = date, y = value / gdp, color = Variable)) +
  theme_minimal() + xlab("") + ylab("% du PIB") +
  scale_x_date(breaks = as.Date(paste0(seq(1940, 2100, 5), "-01-01")),
               labels = date_format("%Y")) +
  scale_y_continuous(breaks = 0.01*seq(-10, 100, 2),
                     labels = percent_format(accuracy = 1)) +

  theme(legend.position = c(0.2, 0.15),
        legend.title = element_blank())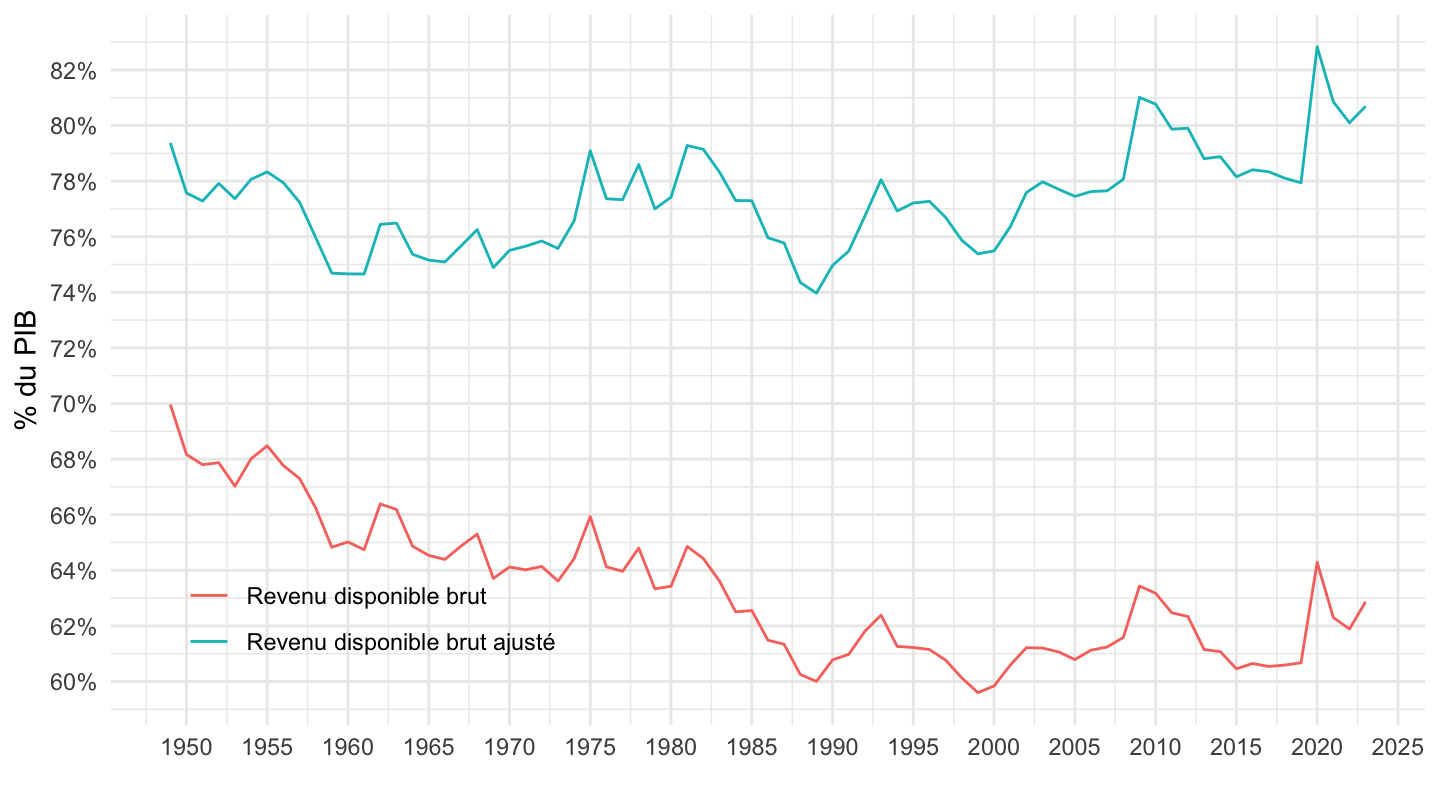
T_7401 |>
  filter(variable %in% c("B6G", "B5G", "B7G")) |>
  left_join(gdp, by = "year") |>
  year_to_date2() |>
  ggplot() + geom_line(aes(x = date, y = value / gdp, color = Variable)) +
  theme_minimal() + xlab("") + ylab("% du PIB") +
  scale_x_date(breaks = as.Date(paste0(seq(1940, 2100, 5), "-01-01")),
               labels = date_format("%Y")) +
  scale_y_continuous(breaks = 0.01*seq(-10, 100, 2),
                     labels = percent_format(accuracy = 1)) +

  theme(legend.position = c(0.2, 0.15),
        legend.title = element_blank())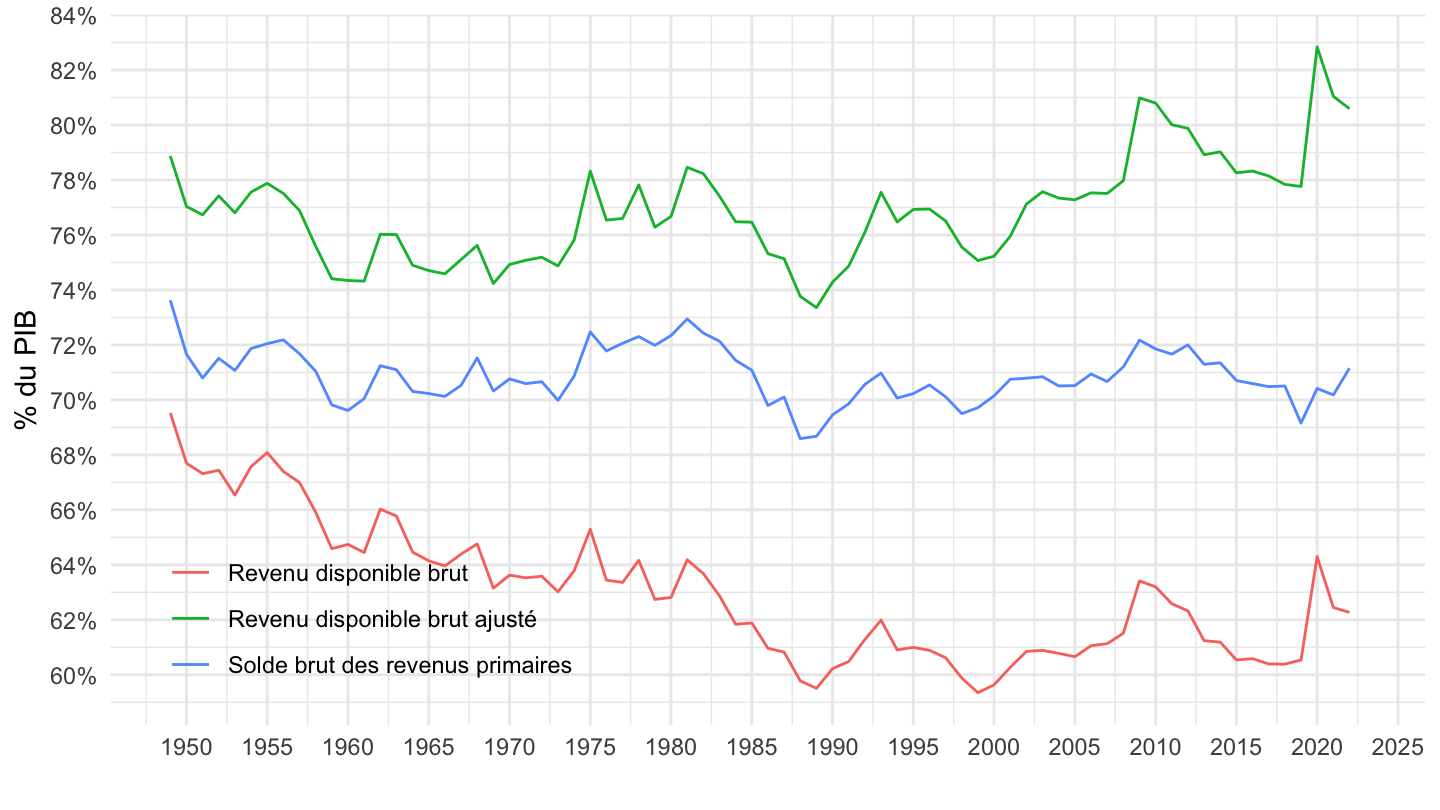
T_7401 |>
  filter(variable %in% c("P31", "P4")) |>
  left_join(gdp, by = "year") |>
  year_to_date2() |>
  ggplot() + geom_line(aes(x = date, y = value / gdp, color = Variable)) +
  theme_minimal() + xlab("") + ylab("% du PIB") +
  scale_x_date(breaks = seq(1920, 2100, 5) |> paste0("-01-01") |> as.Date(),
               labels = date_format("%Y")) +
  scale_y_continuous(breaks = 0.01*seq(-10, 100, 2),
                     labels = percent_format(accuracy = 1)) +

  theme(legend.position = c(0.7, 0.6),
        legend.title = element_blank())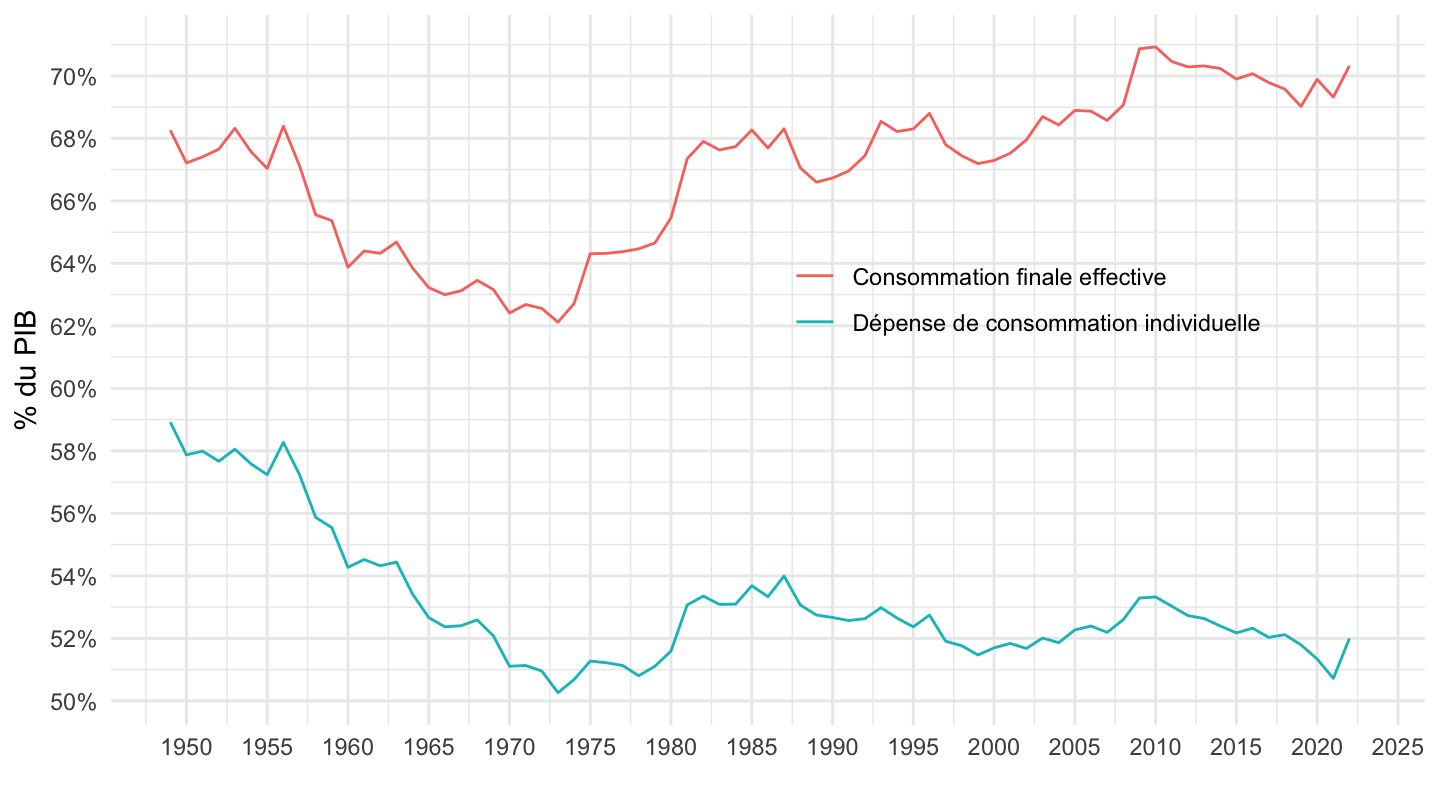
T_7401 |>
  filter(variable %in% c("D42")) |>
  left_join(gdp, by = "year") |>
  year_to_date2() |>
  ggplot() + geom_line(aes(x = date, y = value / gdp)) +
  theme_minimal() + xlab("") + ylab("Revenus Distributés des Sociétés - Dividendes (% du PIB)") +
  scale_x_date(breaks =seq.Date(from = as.Date("1947-01-01"), to = Sys.Date(), by = "5 years"),
               labels = date_format("%Y")) +
  scale_y_continuous(breaks = 0.01*seq(-10, 100, .1),
                     labels = percent_format(accuracy = .1)) +
  theme(legend.position = c(0.2, 0.9),
        legend.title = element_blank())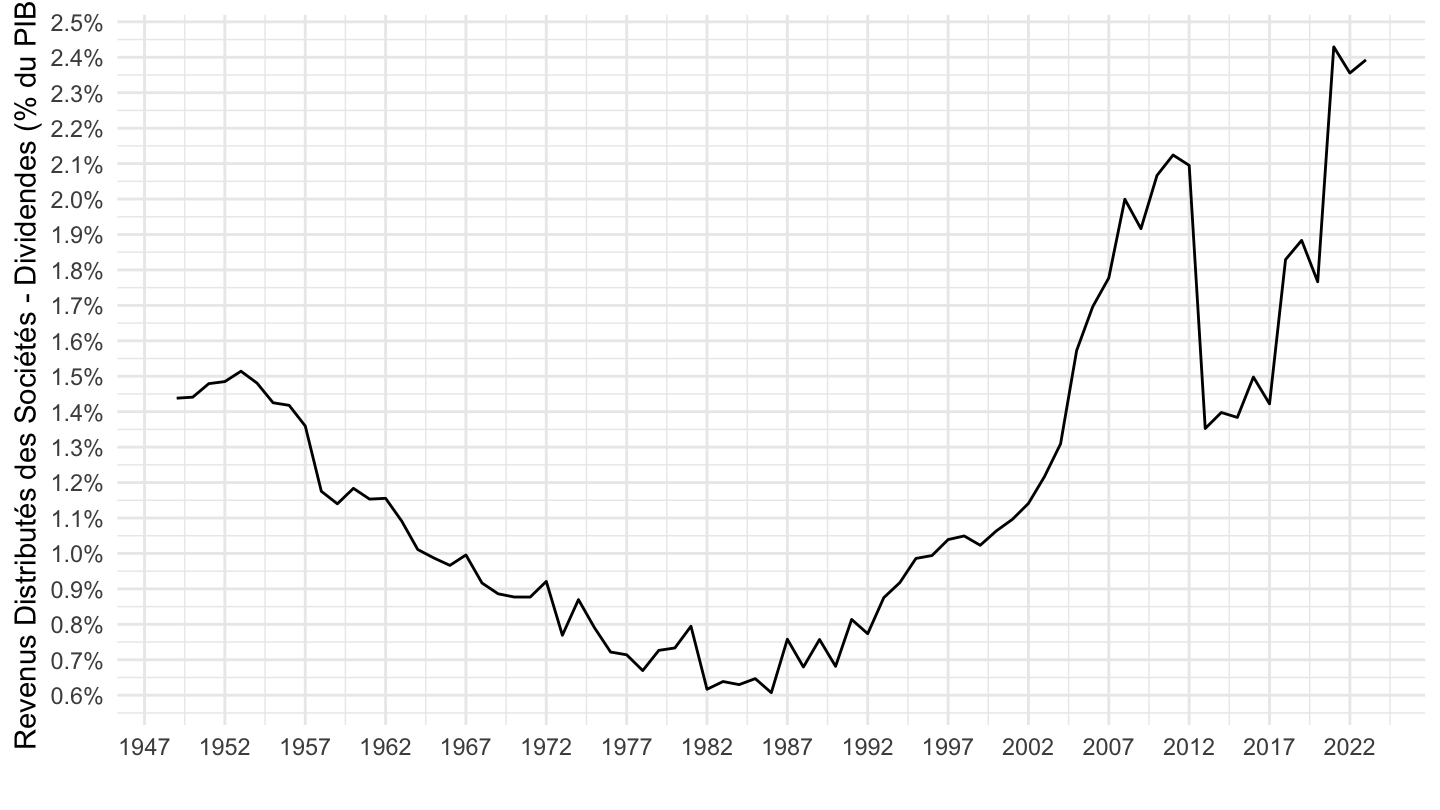
T_7401 |>
  filter(variable %in% c("D42")) |>
  left_join(gdp, by = "year") |>
  year_to_date2() |>
  ggplot() + geom_line(aes(x = date, y = value)) +
  theme_minimal() + xlab("") + ylab("Revenus Distributés des Sociétés - Dividendes (Milliards)") +
  scale_x_date(breaks =seq.Date(from = as.Date("1947-01-01"), to = Sys.Date(), by = "5 years"),
               labels = date_format("%Y")) +
  scale_y_continuous(breaks = seq(-10, 100, 10)) +
  theme(legend.position = c(0.2, 0.9),
        legend.title = element_blank())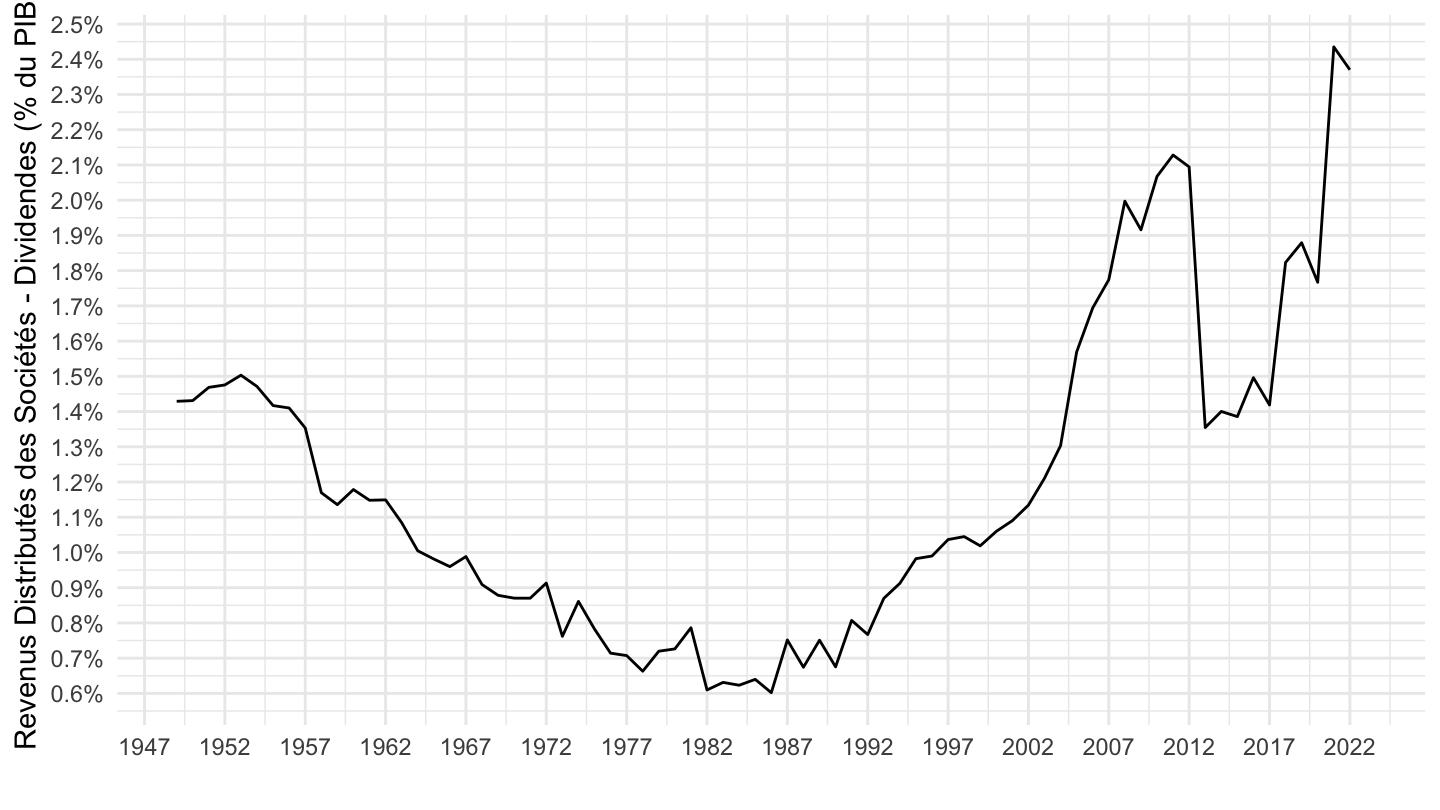
T_7401 |>
  filter(variable %in% c("D42")) |>
  left_join(gdp, by = "year") |>
  year_to_date2() |>
  ggplot() + geom_line(aes(x = date, y = value)) +
  theme_minimal() + xlab("") + ylab("Revenus Distributés des Sociétés - Dividendes (Milliards)") +
  scale_x_date(breaks =seq.Date(from = as.Date("1947-01-01"), to = Sys.Date(), by = "5 years"),
               labels = date_format("%Y")) +
  scale_y_log10(breaks = c(c(1, 2, 3, 5, 8), seq(-10, 100, 10))) +
  theme(legend.position = c(0.2, 0.9),
        legend.title = element_blank())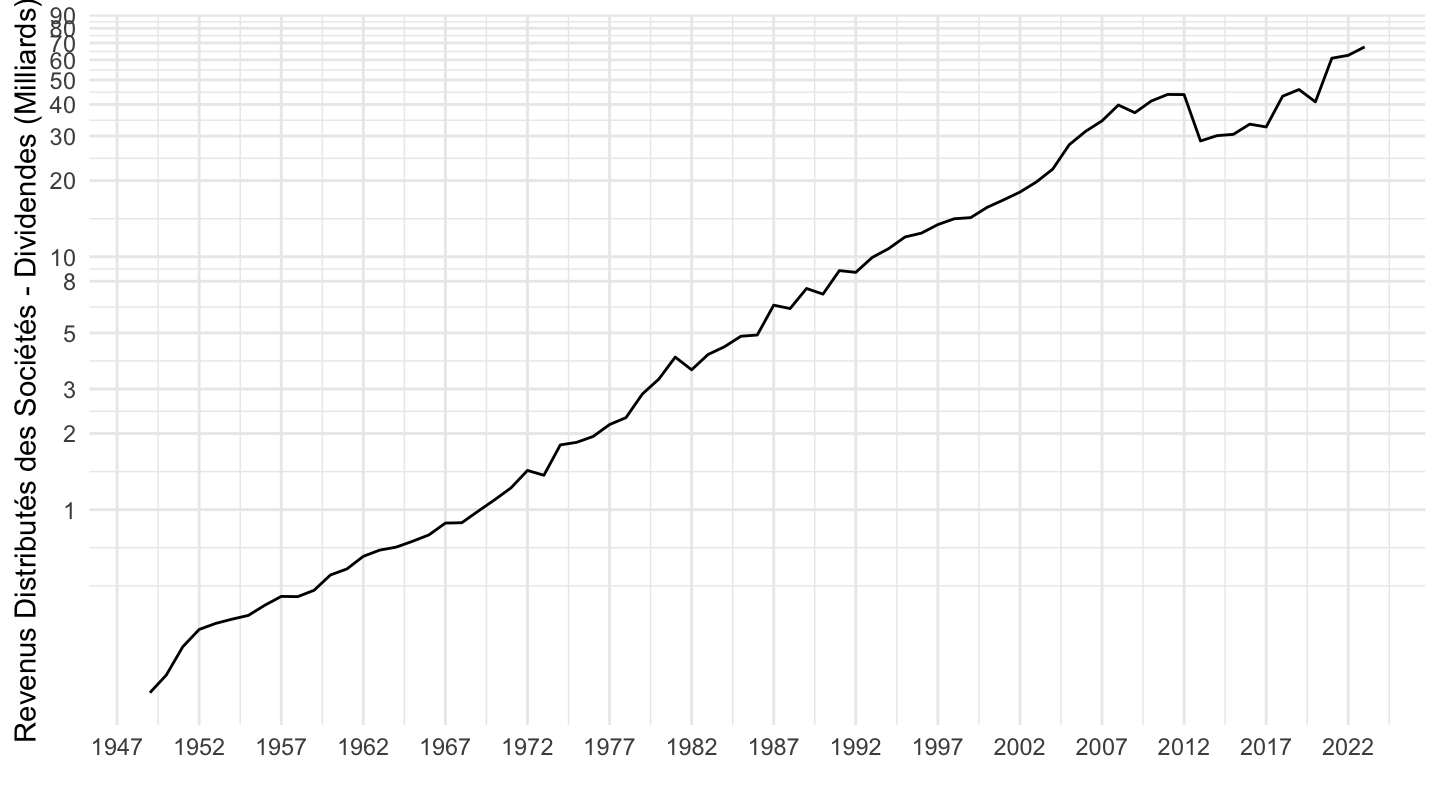
T_7401 |>
  filter(variable %in% c("B8G", "B8N"),
         line %in% c(100, 101)) |>
  left_join(gdp, by = "year") |>
  year_to_date2() |>
  ggplot() + geom_line(aes(x = date, y = value / gdp, color = Variable)) +
  theme_minimal() + xlab("") + ylab("% du PIB") +
  scale_x_date(breaks ="5 years",
               labels = date_format("%Y")) +
  scale_y_continuous(breaks = 0.01*seq(-10, 100, 1),
                     labels = percent_format(accuracy = 1)) +

  theme(legend.position = c(0.2, 0.9),
        legend.title = element_blank())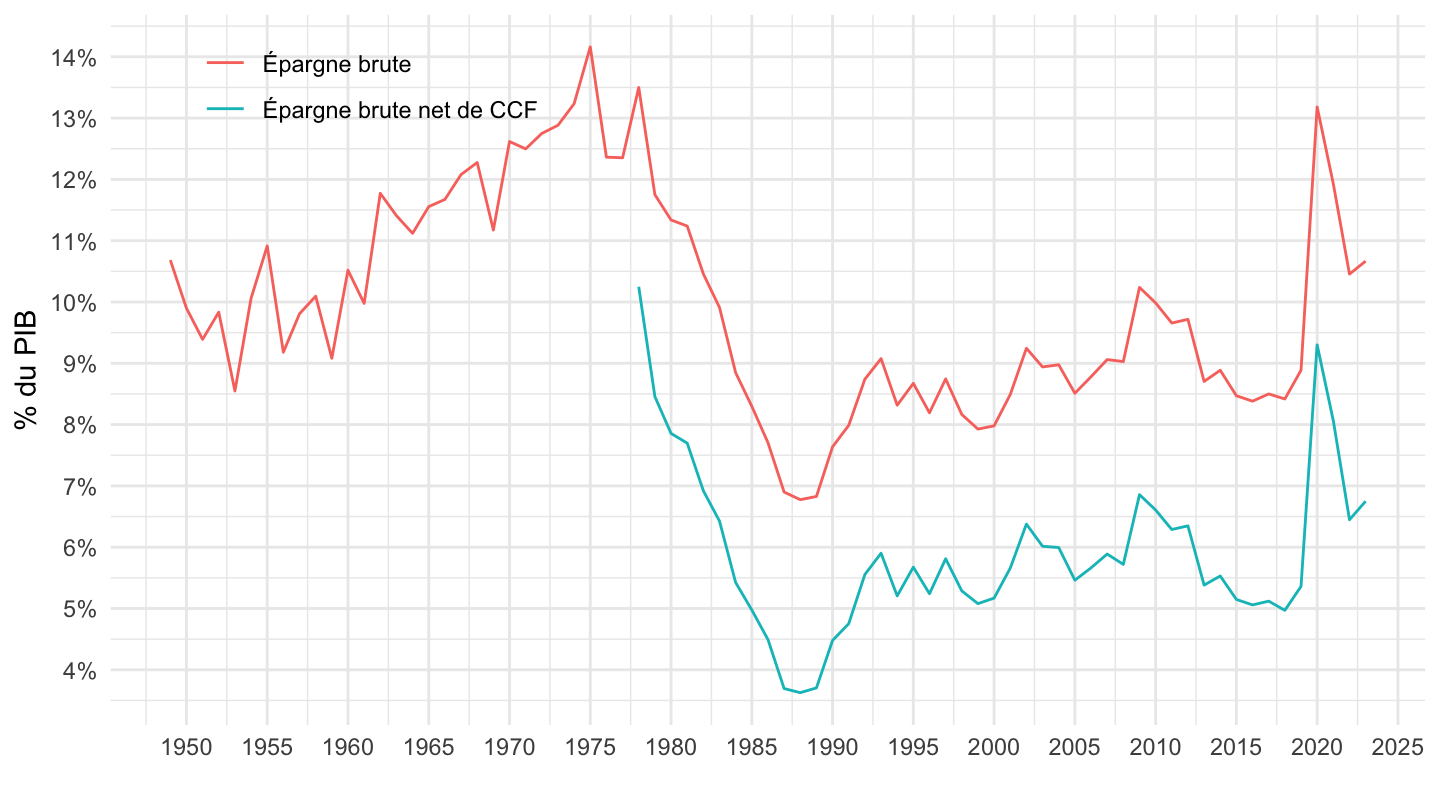
T_7401 |>
  filter(variable %in% c("B8G", "B8N"),
         line %in% c(100, 101)) |>
  left_join(gdp, by = "year") |>
  year_to_date2() |>
  filter(date >= as.Date("1978-01-01")) |>
  ggplot() + geom_line(aes(x = date, y = value / gdp, color = Variable)) +
  theme_minimal() + xlab("") + ylab("% du PIB") +
  scale_x_date(breaks = as.Date(paste0(seq(1940, 2100, 5), "-01-01")),
               labels = date_format("%Y")) +
  scale_y_continuous(breaks = 0.01*seq(-10, 100, 1),
                     labels = percent_format(accuracy = 1)) +

  theme(legend.position = c(0.8, 0.9),
        legend.title = element_blank())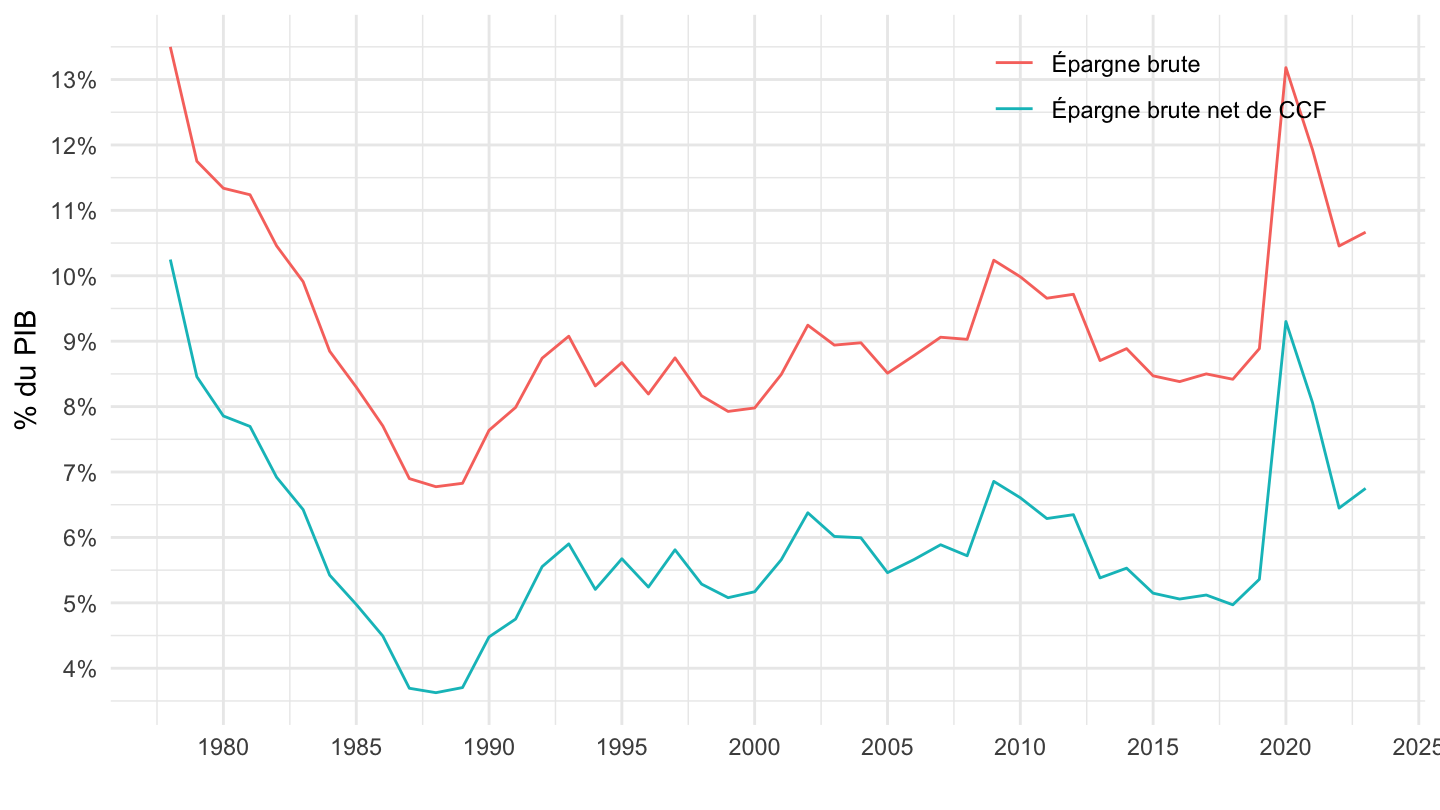
T_7401 |>
  filter(variable %in% c("B8G", "B8N", "P51C"),
         line %in% c(100, 101, 6)) |>
  left_join(gdp, by = "year") |>
  year_to_date2() |>
  ggplot() + geom_line(aes(x = date, y = value / gdp, color = Variable)) +
  theme_minimal() + xlab("") + ylab("% du PIB") +
  scale_x_date(breaks ="5 years",
               labels = date_format("%Y")) +
  scale_y_continuous(breaks = 0.01*seq(-10, 100, 1),
                     labels = percent_format(accuracy = 1)) +

  theme(legend.position = c(0.2, 0.9),
        legend.title = element_blank())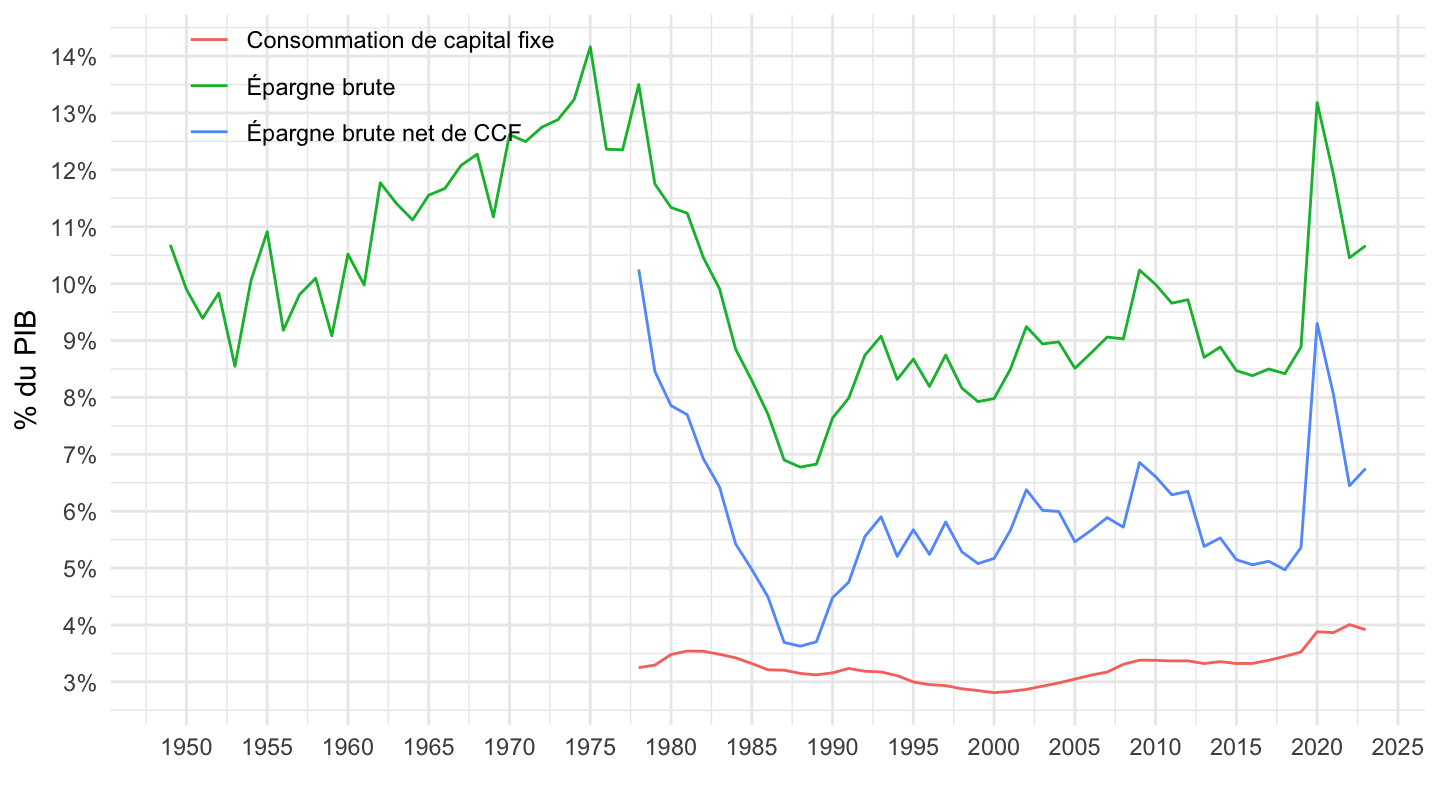
T_7401 |>
  filter(variable %in% c("B8G", "B8N", "P51C"),
         line %in% c(100, 101, 6)) |>
  left_join(gdp, by = "year") |>
  year_to_date2() |>
  filter(date >= as.Date("1978-01-01")) |>
  ggplot() + geom_line(aes(x = date, y = value / gdp, color = Variable)) +
  theme_minimal() + xlab("") + ylab("% du PIB") +
  scale_x_date(breaks = as.Date(paste0(seq(1940, 2100, 5), "-01-01")),
               labels = date_format("%Y")) +
  scale_y_continuous(breaks = 0.01*seq(-10, 100, 1),
                     labels = percent_format(accuracy = 1)) +

  theme(legend.position = c(0.8, 0.9),
        legend.title = element_blank())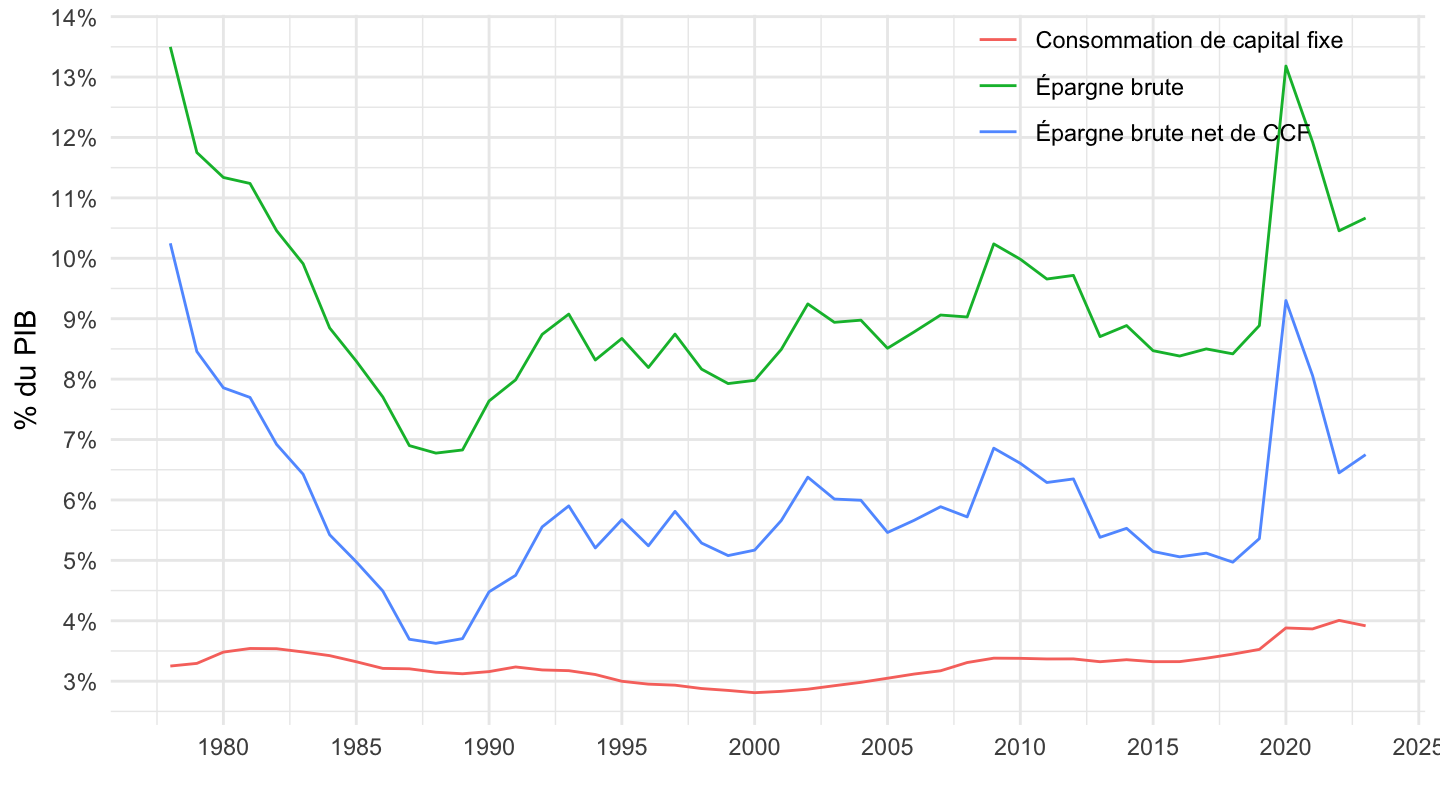
T_7401 |>
  filter(variable %in% c("P51C"),
         line %in% c(100, 101, 6)) |>
  left_join(gdp, by = "year") |>
  year_to_date2() |>
  ggplot() + geom_line(aes(x = date, y = value / gdp, color = Variable)) +
  theme_minimal() + xlab("") + ylab("% du PIB") +
  scale_x_date(breaks ="5 years",
               labels = date_format("%Y")) +
  scale_y_continuous(breaks = 0.01*seq(-10, 100, .1),
                     labels = percent_format(accuracy = .1)) +

  theme(legend.position = c(0.2, 0.9),
        legend.title = element_blank())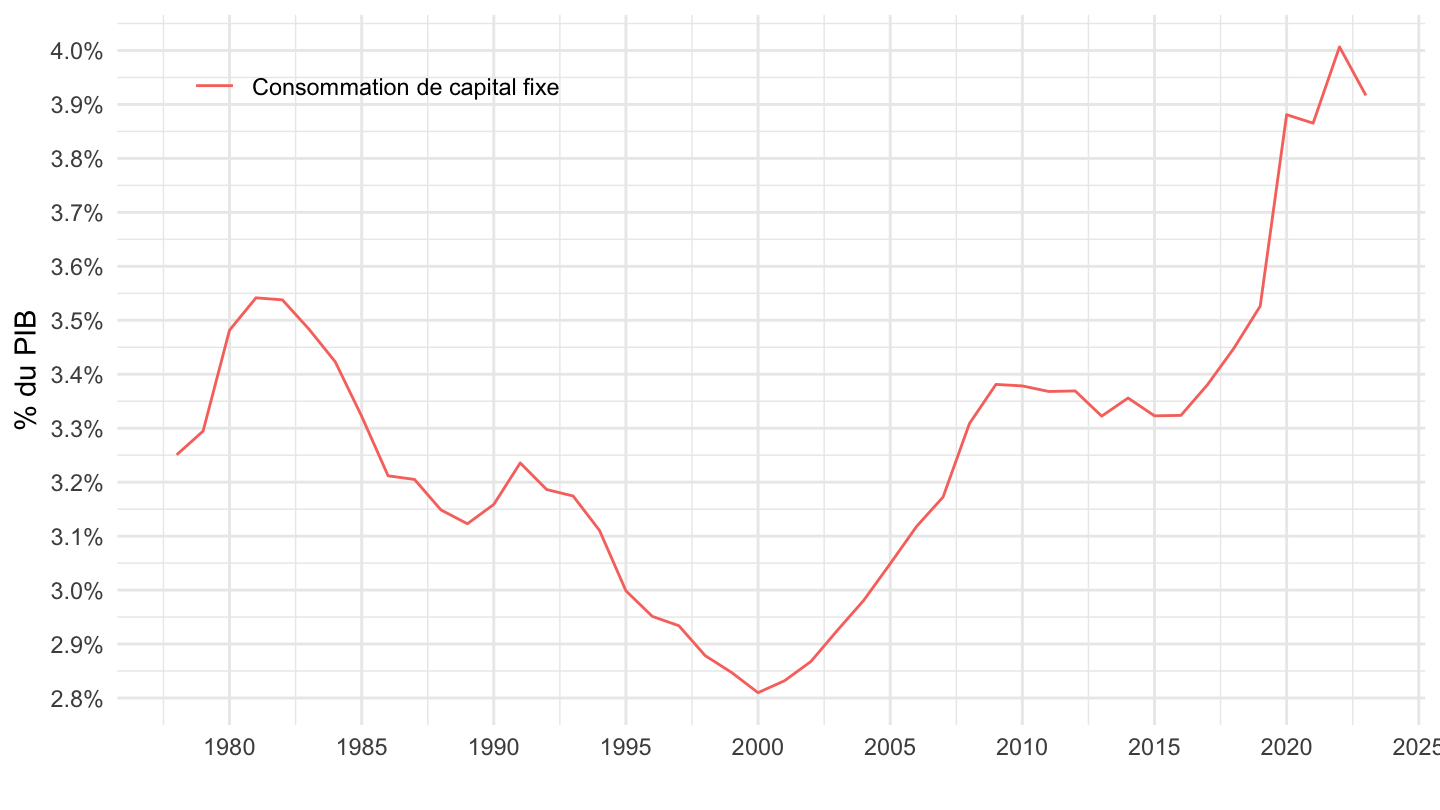
T_7401 |>
  filter(variable %in% c("P51C"),
         line %in% c(100, 101, 6)) |>
  left_join(gdp, by = "year") |>
  year_to_date2() |>
  filter(date >= as.Date("1999-01-01")) |>
  ggplot() + geom_line(aes(x = date, y = value / gdp, color = Variable)) +
  theme_minimal() + xlab("") + ylab("% du PIB") +
  scale_x_date(breaks = as.Date(paste0(seq(1940, 2100, 5), "-01-01")),
               labels = date_format("%Y")) +
  scale_y_continuous(breaks = 0.01*seq(-10, 100, .1),
                     labels = percent_format(accuracy = .1)) +

  theme(legend.position = c(0.8, 0.9),
        legend.title = element_blank())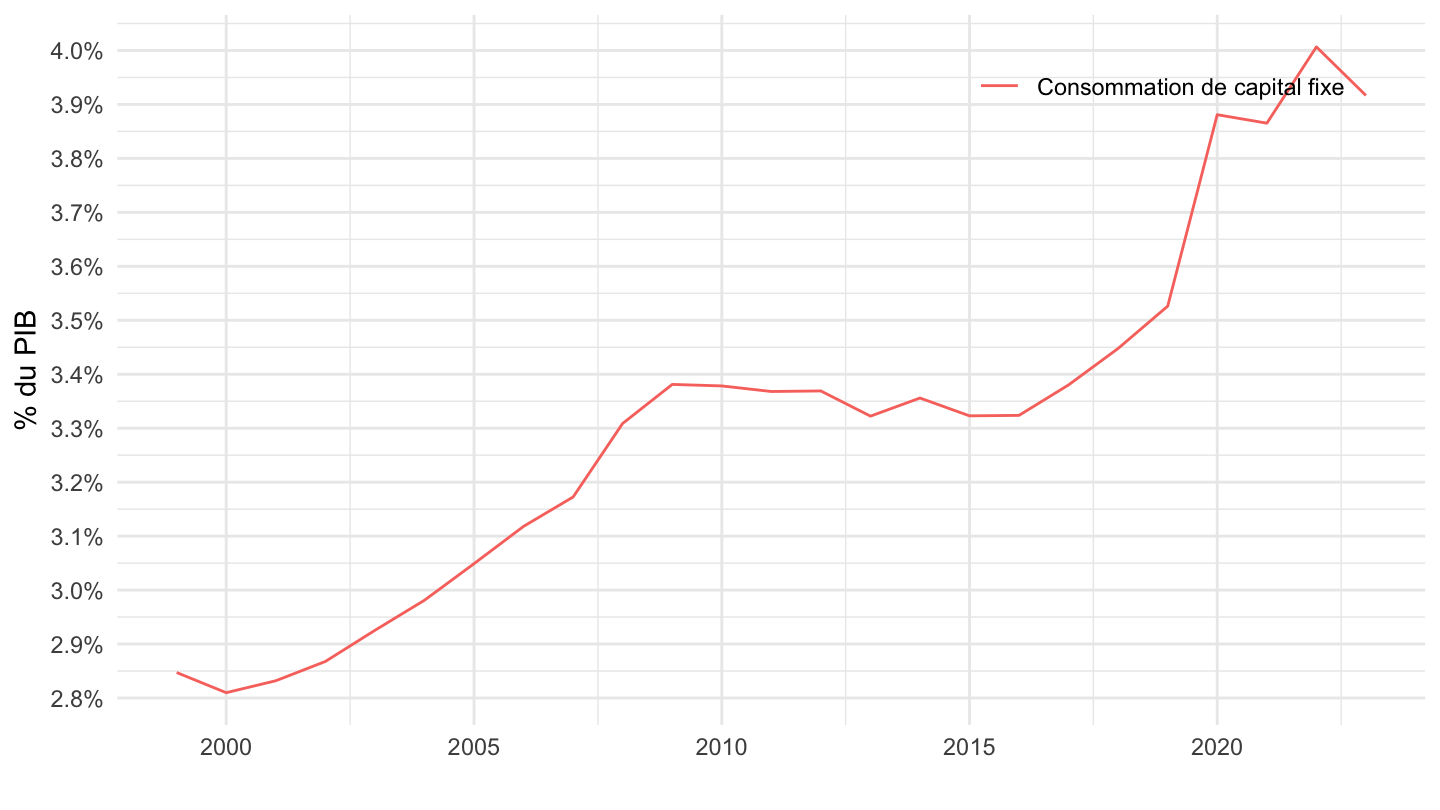
T_7401 |>
  filter(variable %in% c("D4", "D42", "D44"),
         line %in% c(30, 32, 35)) |>
  left_join(gdp, by = "year") |>
  year_to_date2() |>
  ggplot() + geom_line(aes(x = date, y = value / gdp, color = Variable)) +
  theme_minimal() + xlab("") + ylab("% du PIB") +
  scale_x_date(breaks ="5 years",
               labels = date_format("%Y")) +
  scale_y_continuous(breaks = 0.01*seq(-10, 100, 1),
                     labels = percent_format(accuracy = 1)) +

  theme(legend.position = c(0.2, 0.9),
        legend.title = element_blank())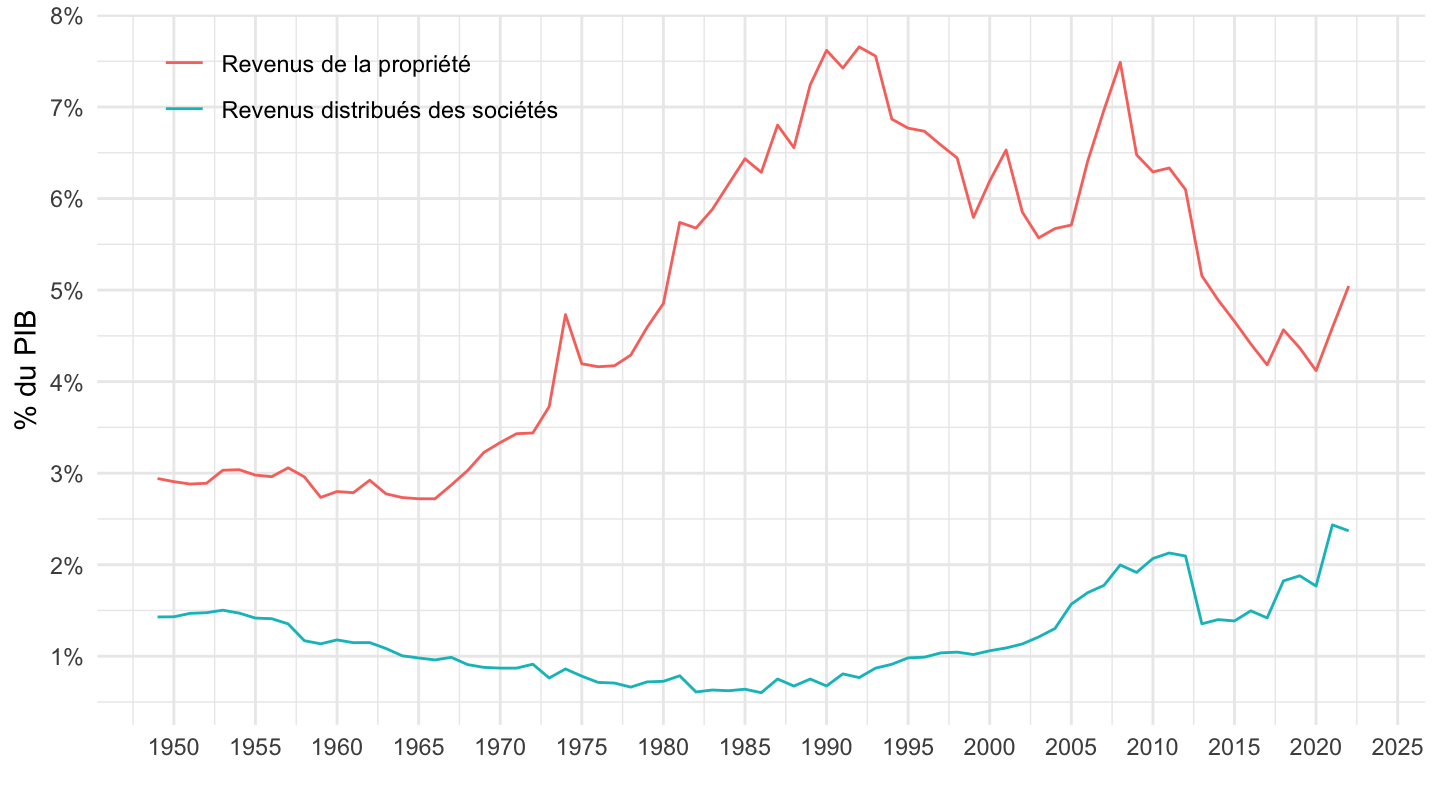
T_7401 |>
  filter(variable %in% c("D4", "D42", "D44"),
         line %in% c(30, 32, 35)) |>
  left_join(gdp, by = "year") |>
  year_to_date2() |>
  filter(date >= as.Date("1995-01-01")) |>
  ggplot() + geom_line(aes(x = date, y = value / gdp, color = Variable)) +
  theme_minimal() + xlab("") + ylab("% du PIB") +
  scale_x_date(breaks = as.Date(paste0(seq(1940, 2100, 2), "-01-01")),
               labels = date_format("%Y")) +
  scale_y_continuous(breaks = 0.01*seq(-10, 100, 1),
                     labels = percent_format(accuracy = 1)) +

  theme(legend.position = c(0.8, 0.9),
        legend.title = element_blank())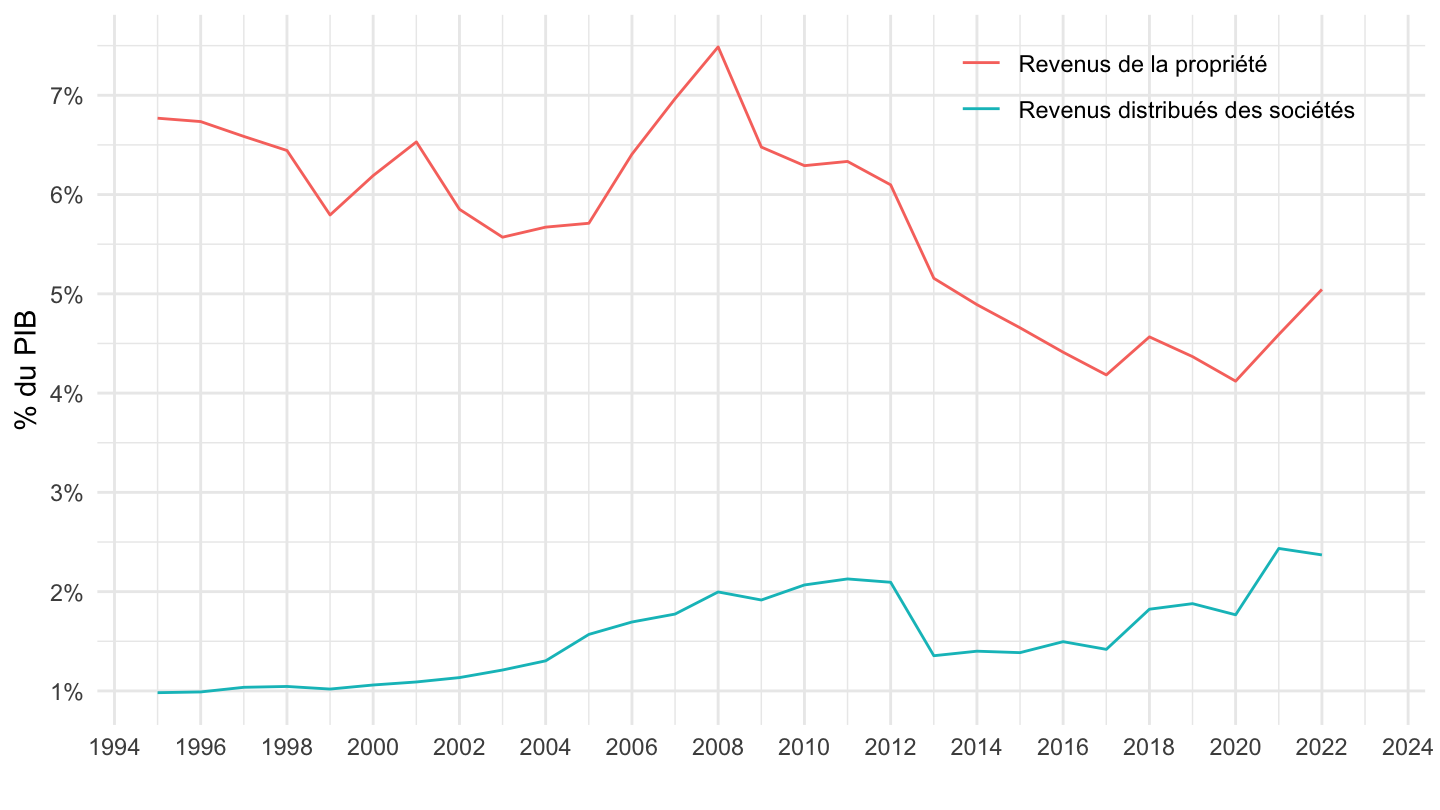
T_7401 |>
  filter(variable %in% c("D4", "D42", "D44"),
         line %in% c(30, 32, 35)) |>
  left_join(gdp, by = "year") |>
  year_to_date2() |>
  filter(date >= as.Date("2017-01-01")) |>
  ggplot() + geom_line(aes(x = date, y = value / gdp, color = Variable)) +
  theme_minimal() + xlab("") + ylab("% du PIB") +
  scale_x_date(breaks = as.Date(paste0(seq(1940, 2100, 1), "-01-01")),
               labels = date_format("%Y")) +
  scale_y_continuous(breaks = 0.01*seq(-10, 100, 1),
                     labels = percent_format(accuracy = 1)) +

  theme(legend.position = c(0.8, 0.9),
        legend.title = element_blank())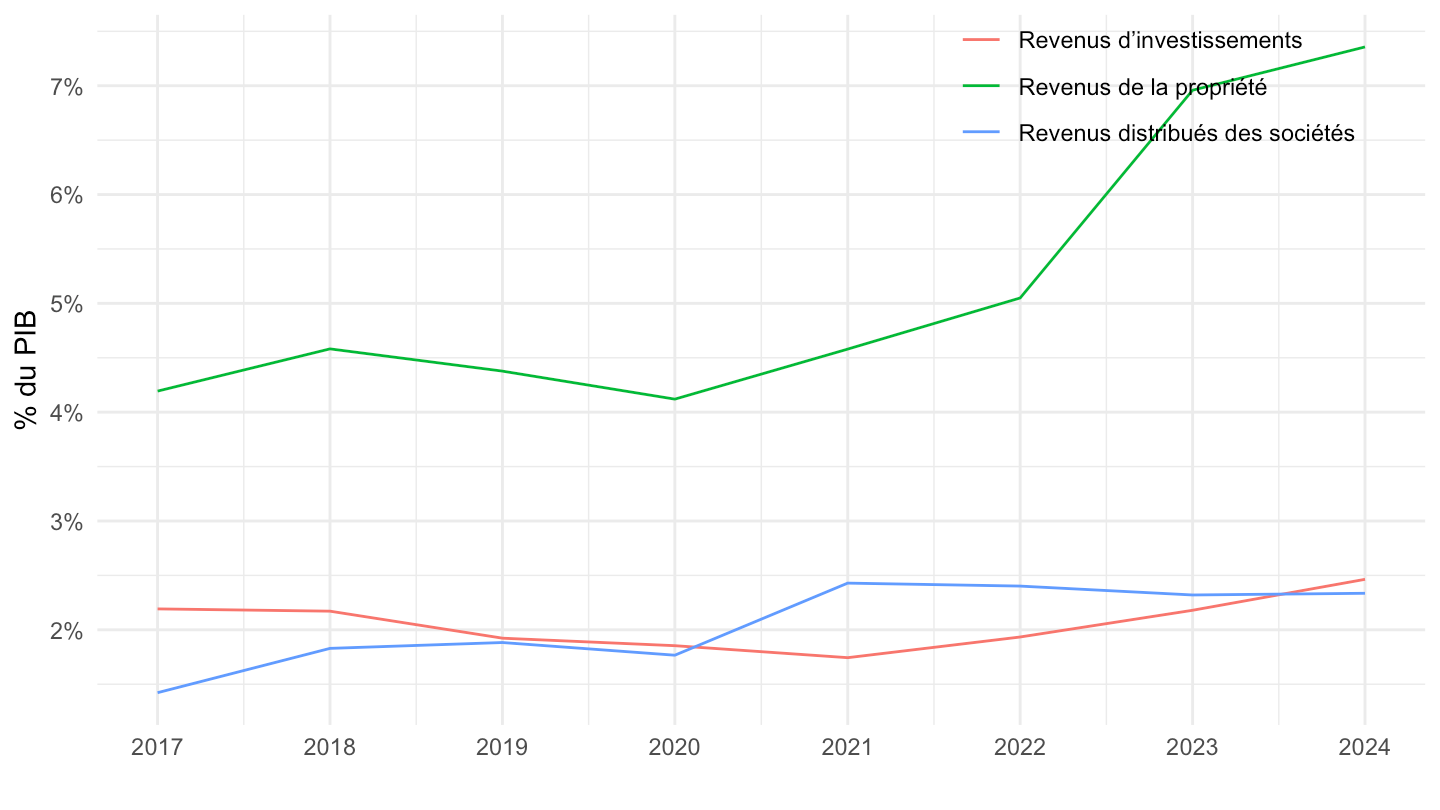
T_7401 |>
  filter(variable %in% c("D4", "D42")) |>
  year_to_date2() |>
  filter(date >= as.Date("2017-01-01")) |>
  group_by(Variable, line) |>
  arrange(date) |>
  mutate(value = 100*value/value[1]) |>
  ggplot() + geom_line(aes(x = date, y = value, color = paste0(Variable, " - Ligne ", line))) +
  theme_minimal() + xlab("") + ylab("") +
  scale_x_date(breaks = as.Date(paste0(seq(1940, 2100, 1), "-01-01")),
               labels = date_format("%Y")) +
  scale_y_continuous(breaks = seq(0, 1000, 50)) +

  theme(legend.position = c(0.3, 0.7),
        legend.title = element_blank())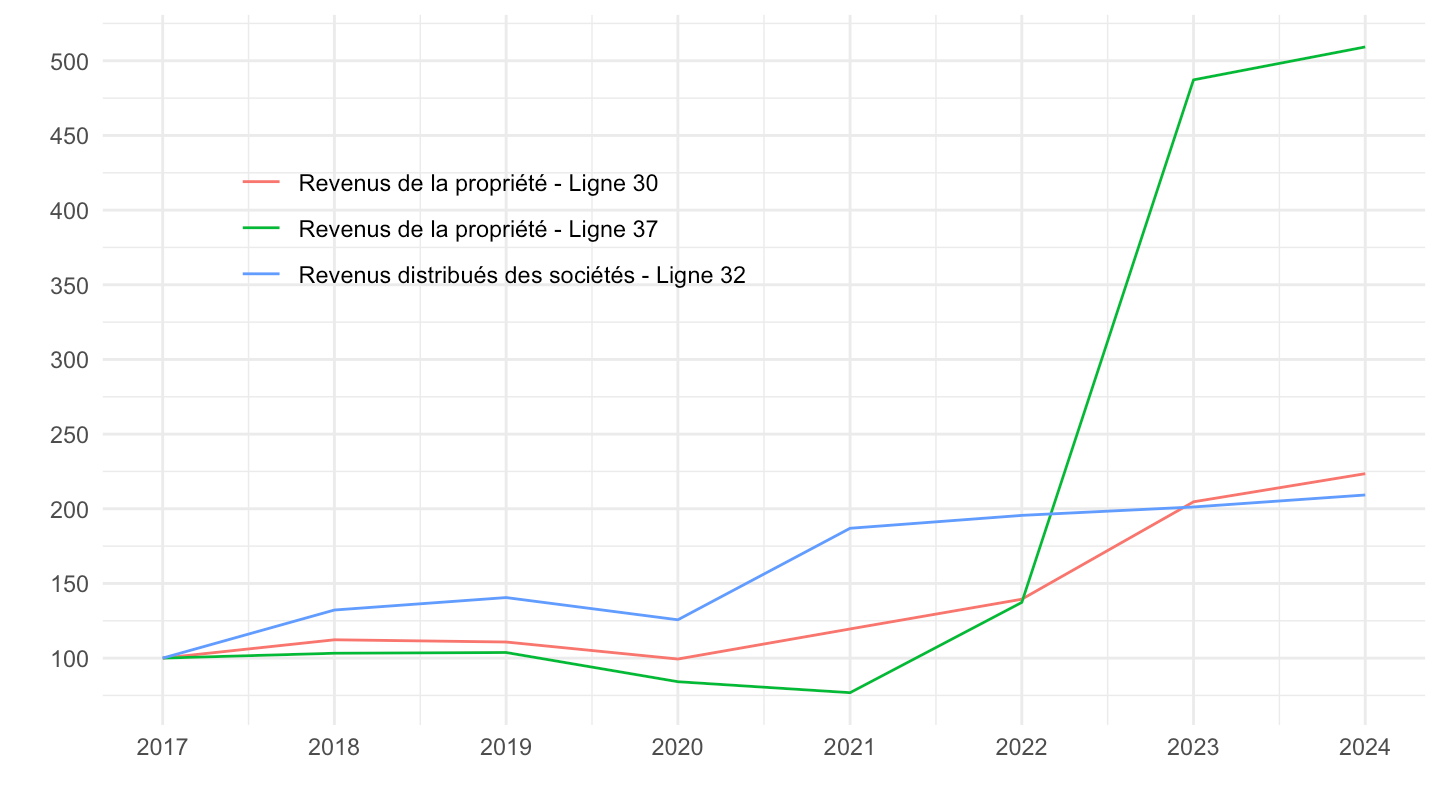
T_7401 |>
  filter(variable %in% c("D72", "D71")) |>
  left_join(rdb2, by = "year") |>
  year_to_date2() |>
  ggplot() + geom_line(aes(x = date, y = value / rdb, color = Variable)) +
  theme_minimal() + xlab("") + ylab("% du RDB") +
  scale_x_date(breaks = as.Date(paste0(seq(1940, 2100, 5), "-01-01")),
               labels = date_format("%Y")) +
  scale_y_continuous(breaks = 0.01*seq(-10, 100, 0.1),
                     labels = percent_format(accuracy = .1)) +

  theme(legend.position = c(0.2, 0.9),
        legend.title = element_blank())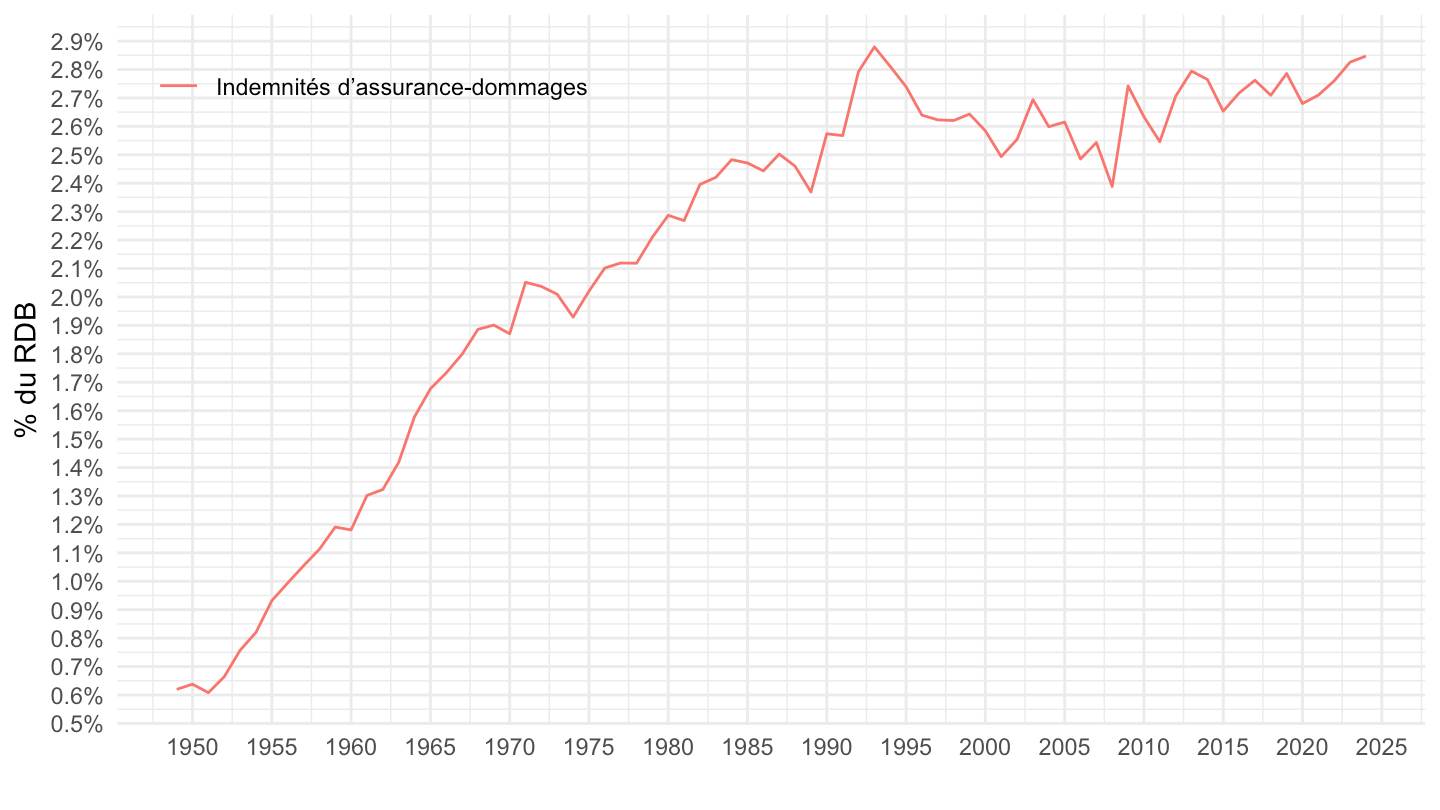
T_7401 |>
  filter(variable %in% c("D72", "D71")) |>
  left_join(rdb2, by = "year") |>
  year_to_date2() |>
  ggplot() + geom_line(aes(x = date, y = value / rdb, color = Variable)) +
  theme_minimal() + xlab("") + ylab("% du RDB") +
  scale_x_date(breaks = as.Date(paste0(seq(1940, 2100, 5), "-01-01")),
               labels = date_format("%Y")) +
  scale_y_continuous(breaks = 0.01*seq(-10, 100, 0.1),
                     labels = percent_format(accuracy = .1)) +

  theme(legend.position = c(0.2, 0.9),
        legend.title = element_blank())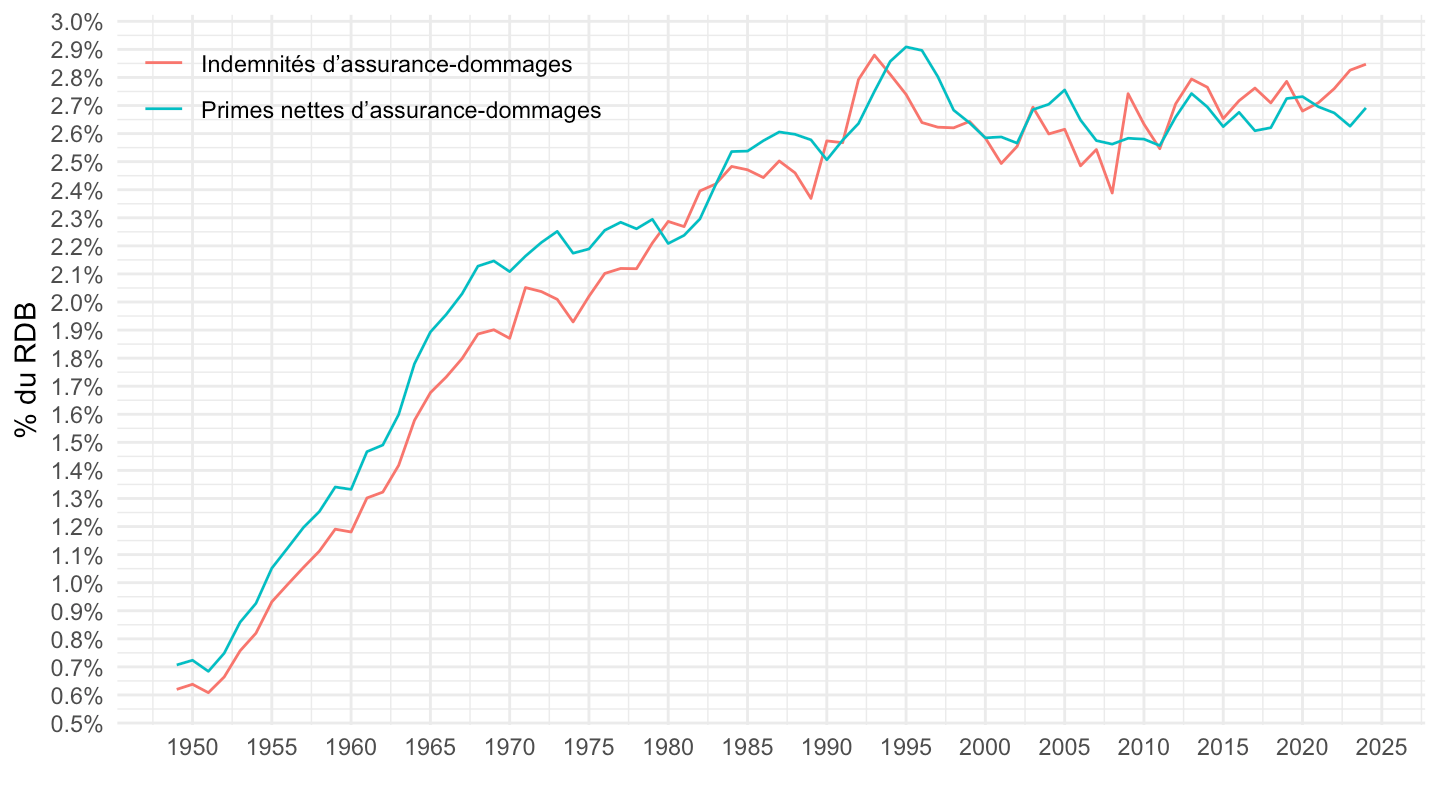
T_7401 |>
  filter(variable %in% c("D72", "D71")) |>
  left_join(gdp, by = "year") |>
  year_to_date2() |>
  ggplot() + geom_line(aes(x = date, y = value / gdp, color = Variable)) +
  theme_minimal() + xlab("") + ylab("% du PIB") +
  scale_x_date(breaks = as.Date(paste0(seq(1940, 2100, 5), "-01-01")),
               labels = date_format("%Y")) +
  scale_y_continuous(breaks = 0.01*seq(-10, 100, 0.1),
                     labels = percent_format(accuracy = .1)) +

  theme(legend.position = c(0.2, 0.9),
        legend.title = element_blank())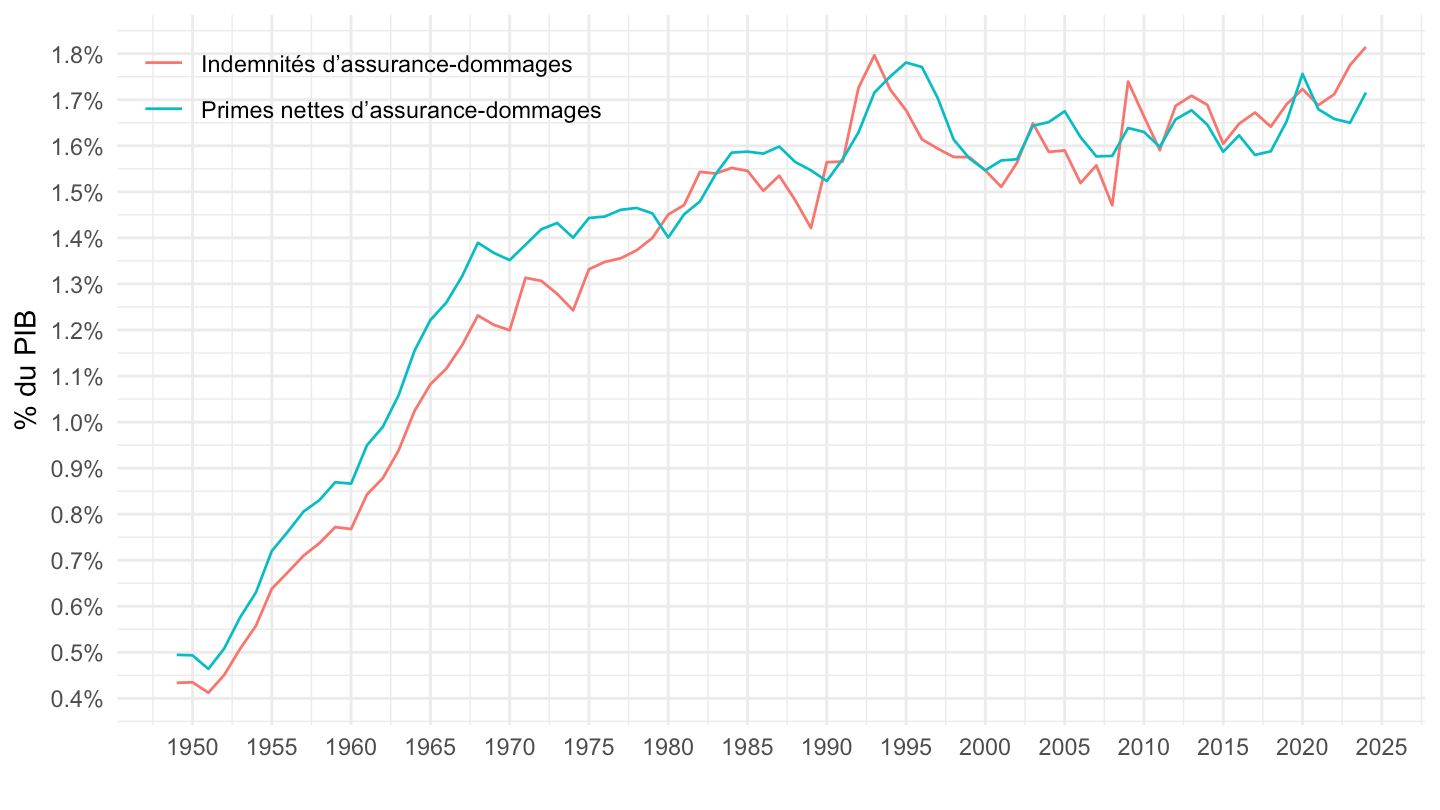
T_7401 |>
  filter(line %in% c(18, 26, 42)) |>
  bind_rows(T_2101 |>
              filter(line == 3) |>
              mutate(Variable = "Salaires et traitements nets")) |>
  left_join(gdp, by = "year") |>
  year_to_date2() |>
  ggplot() + geom_line(aes(x = date, y = value, color = Variable)) +
  theme_minimal() + xlab("") + ylab("Milliards d'€") +
  scale_x_date(breaks = as.Date(paste0(seq(1940, 2100, 5), "-01-01")),
               labels = date_format("%Y")) +
  scale_y_continuous(breaks = seq(0, 10000, 100),
                     labels = dollar_format(accuracy = 1, pre = "", su ="Mds€")) +
  theme(legend.position = c(0.3, 0.9),
        legend.title = element_blank())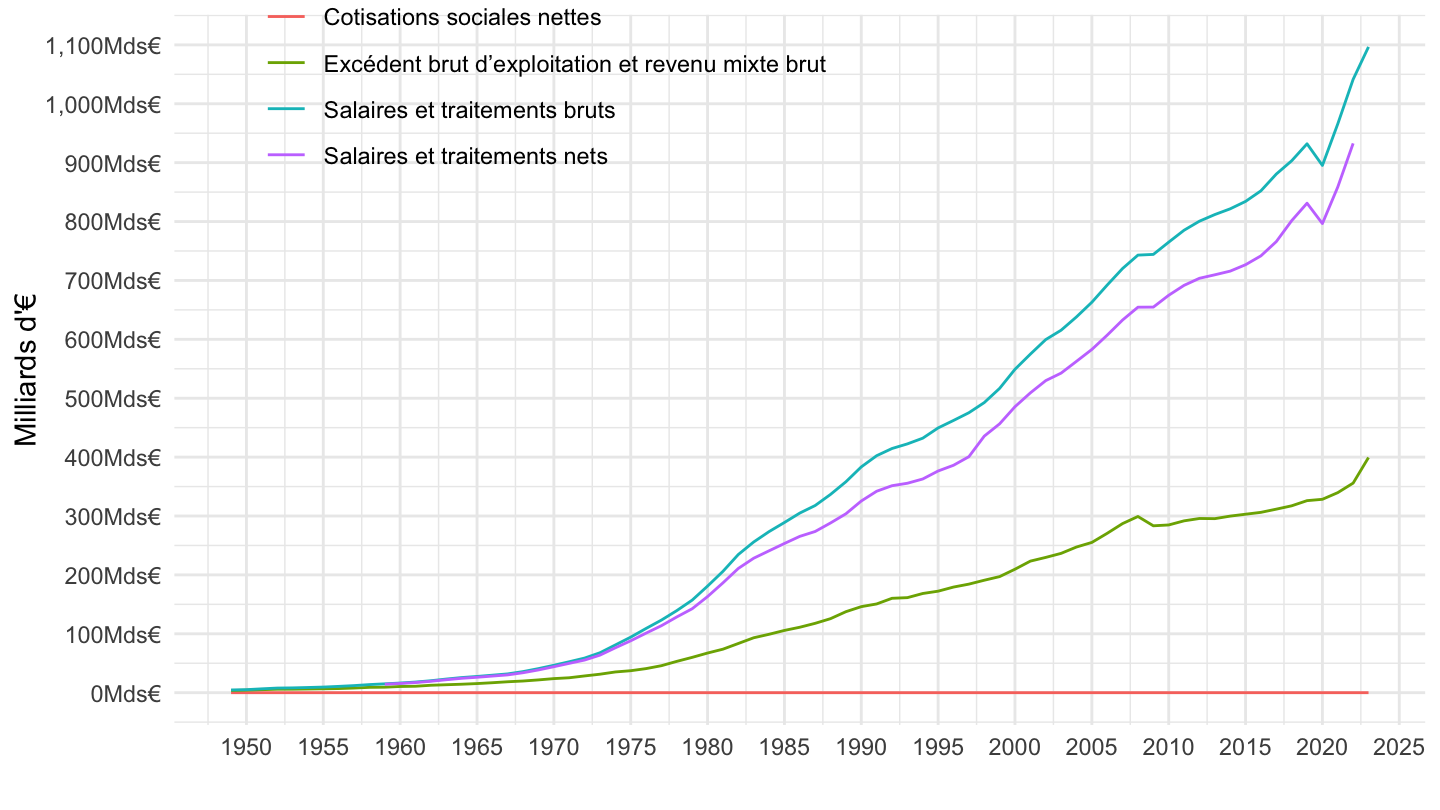
T_7401 |>
  filter(line %in% c(18, 26, 42)) |>
  bind_rows(T_2101 |>
              filter(line == 3) |>
              mutate(Variable = "Salaires et traitements nets")) |>
  left_join(gdp, by = "year") |>
  year_to_date2() |>
  ggplot() + geom_line(aes(x = date, y = value, color = Variable)) +
  theme_minimal() + xlab("") + ylab("Milliards d'€") +
  scale_x_date(breaks = as.Date(paste0(seq(1940, 2100, 5), "-01-01")),
               labels = date_format("%Y")) +
  scale_y_log10(breaks = c(1,2,5,8,10,20, 50, 80, 100, 200, 500, 1000, 1200, 2000, 3000, 5000, 10000),
                     labels = dollar_format(accuracy = 1, pre = "", su ="Mds€")) +
  theme(legend.position = c(0.3, 0.9),
        legend.title = element_blank())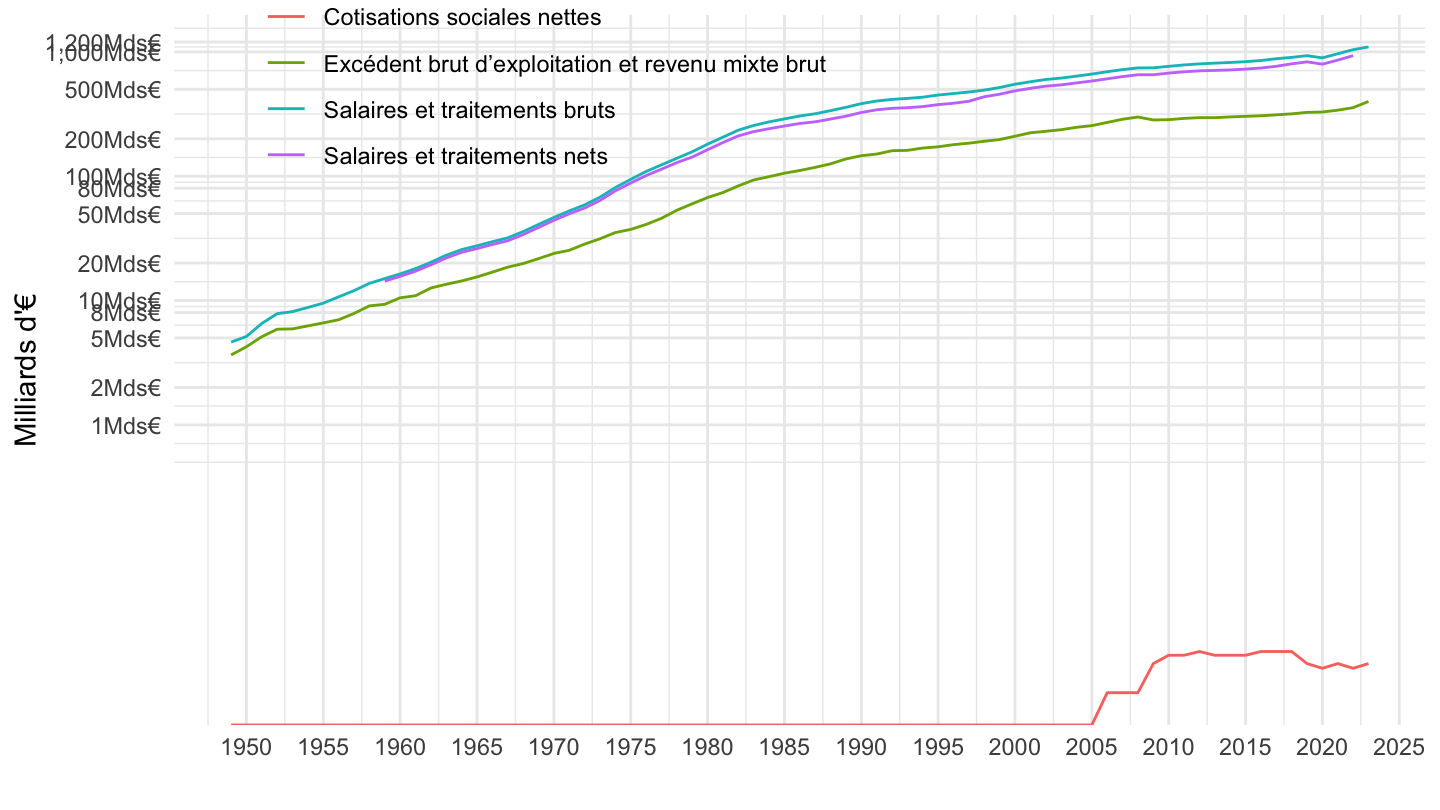
T_7401 |>
  filter(line %in% c(18, 26, 42)) |>
  bind_rows(T_2101 |>
              filter(line == 3) |>
              mutate(Variable = "Salaires et traitements nets")) |>
  left_join(gdp, by = "year") |>
  year_to_date2() |>
  filter(date >= as.Date("1995-01-01")) |>
  ggplot() + geom_line(aes(x = date, y = value, color = Variable)) +
  theme_minimal() + xlab("") + ylab("Milliards d'€") +
  scale_x_date(breaks = as.Date(paste0(seq(1940, 2100, 2), "-01-01")),
               labels = date_format("%Y")) +
  scale_y_continuous(breaks = seq(0, 10000, 100),
                     labels = dollar_format(accuracy = 1, pre = "", su ="Mds€")) +
  theme(legend.position = c(0.3, 0.9),
        legend.title = element_blank())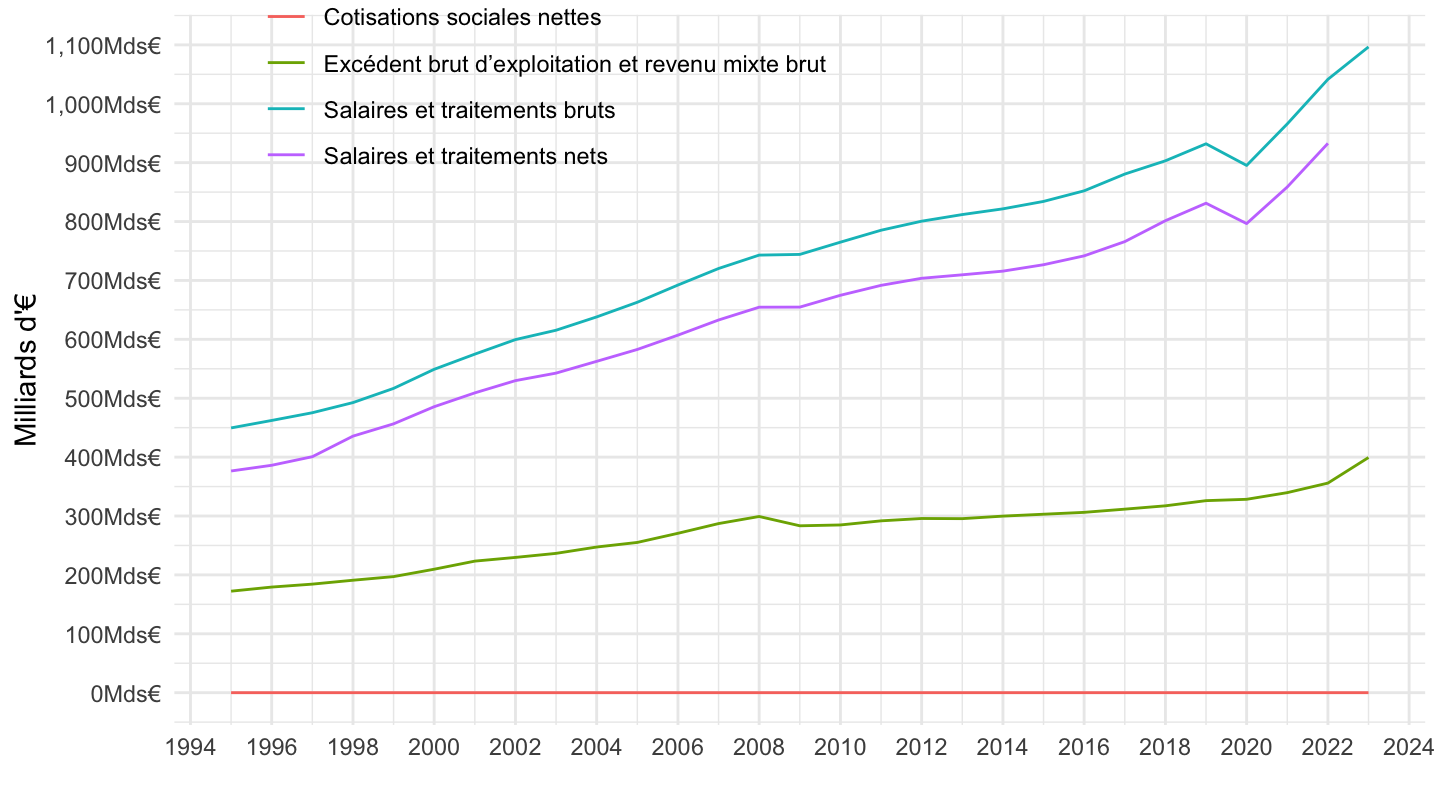
T_7401 |>
  filter(line %in% c(18, 26)) |>
  bind_rows(T_2101 |>
              filter(line == 3) |>
              mutate(Variable = "Salaires et traitements nets")) |>
  left_join(gdp, by = "year") |>
  year_to_date2() |>
  filter(date >= as.Date("1995-01-01")) |>
  ggplot() + geom_line(aes(x = date, y = value, color = Variable)) +
  theme_minimal() + xlab("") + ylab("Milliards d'€") +
  scale_x_date(breaks = as.Date(paste0(seq(1940, 2100, 2), "-01-01")),
               labels = date_format("%Y")) +
  scale_y_log10(breaks = seq(0, 1500, 100),
                     labels = dollar_format(accuracy = 1, pre = "", su ="Mds€")) +
  theme(legend.position = c(0.3, 0.9),
        legend.title = element_blank())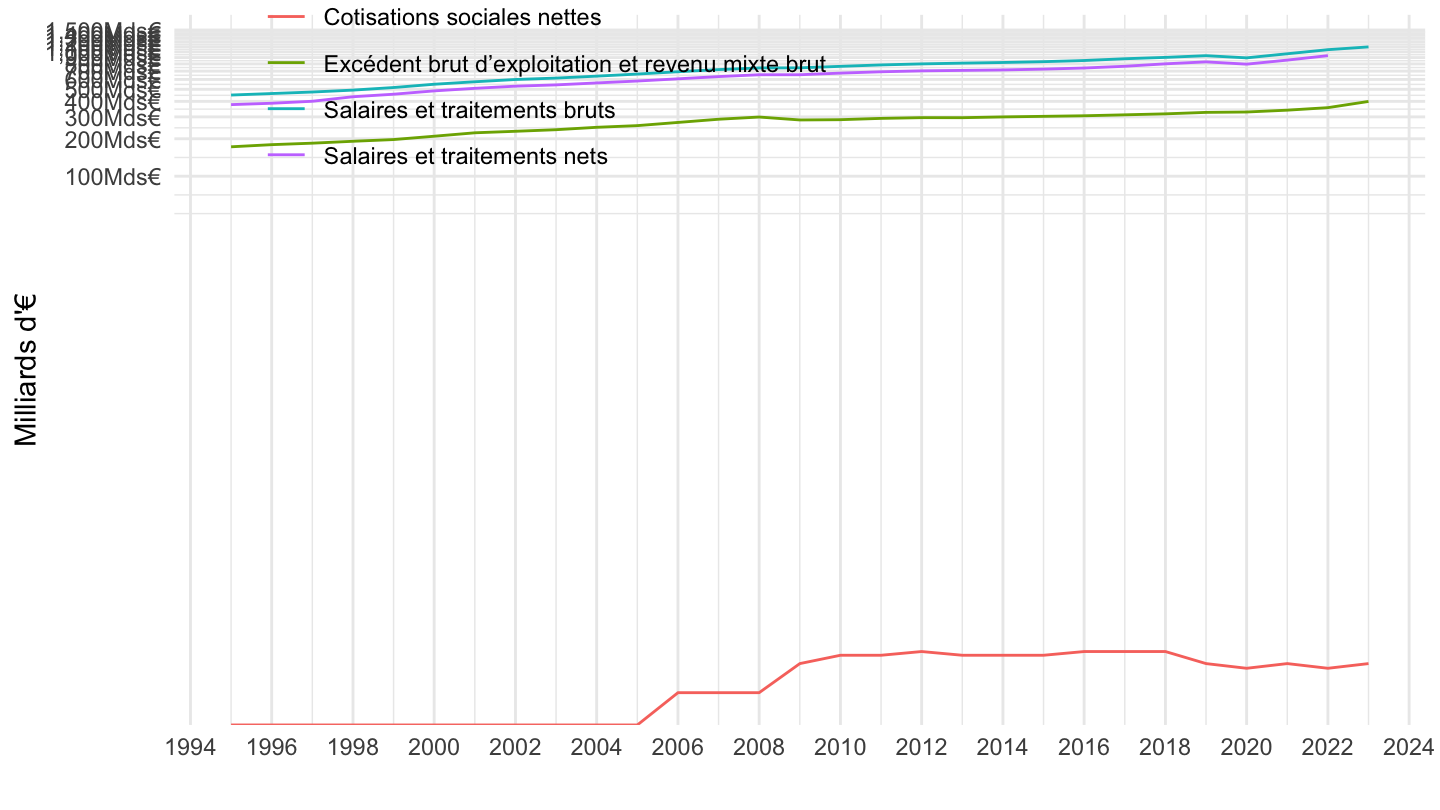
T_7401 |>
  filter(line %in% c(18, 26, 42)) |>
  bind_rows(T_2101 |>
              filter(line == 3) |>
              mutate(Variable = "Salaires et traitements nets")) |>
  left_join(gdp, by = "year") |>
  year_to_date2() |>
  filter(date >= as.Date("2017-01-01")) |>
  ggplot() + geom_line(aes(x = date, y = value, color = Variable)) +
  theme_minimal() + xlab("") + ylab("Milliards d'€") +
  scale_x_date(breaks = as.Date(paste0(seq(1940, 2100, 1), "-01-01")),
               labels = date_format("%Y")) +
  scale_y_continuous(breaks = seq(0, 10000, 100),
                     labels = dollar_format(accuracy = 1, pre = "", su ="Mds€")) +
  theme(legend.position = c(0.3, 0.9),
        legend.title = element_blank())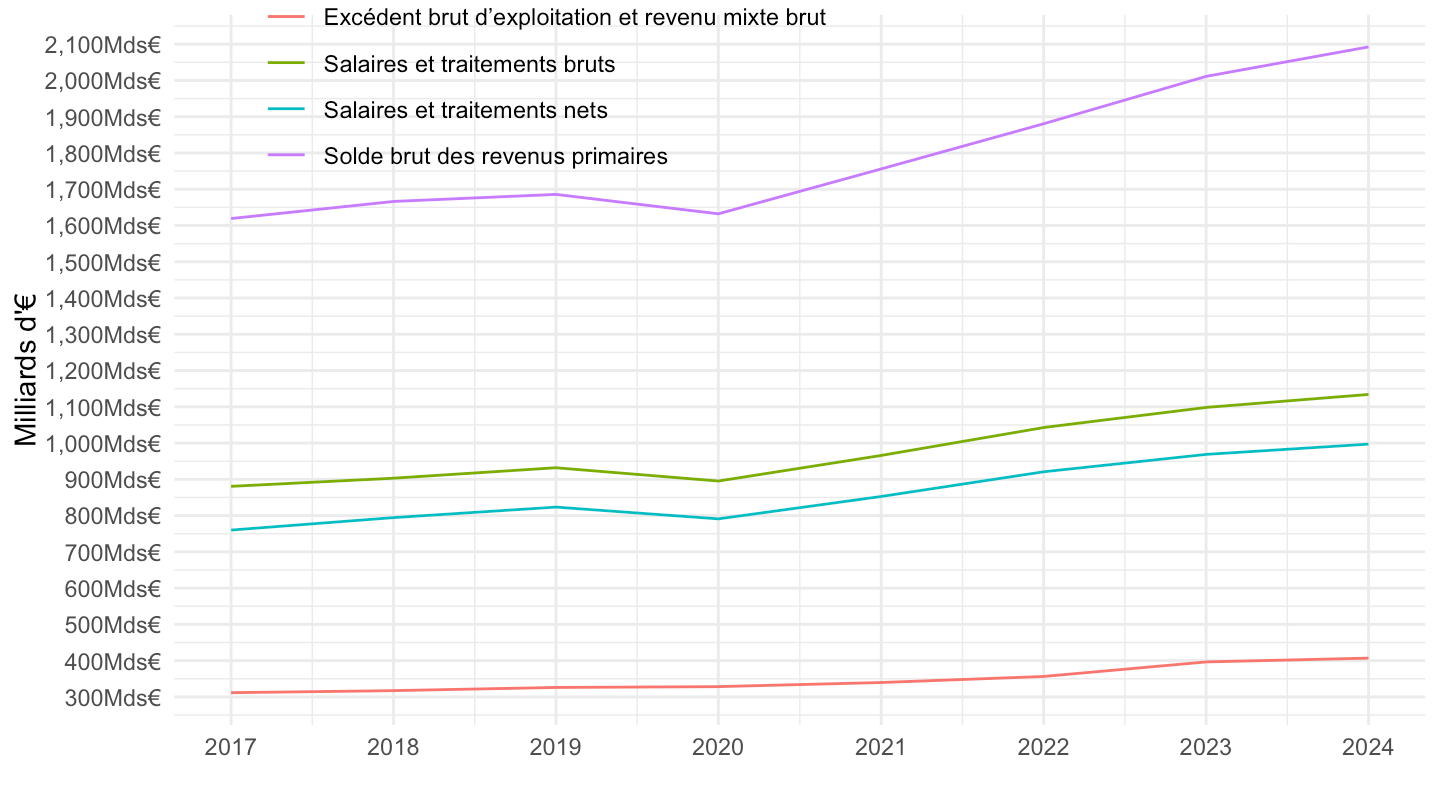
T_7401 |>
  filter(line %in% c(18, 26)) |>
  bind_rows(T_2101 |>
              filter(line == 3) |>
              mutate(Variable = "Salaires et traitements nets")) |>
  left_join(gdp, by = "year") |>
  year_to_date2() |>
  filter(date >= as.Date("2017-01-01")) |>
  ggplot() + geom_line(aes(x = date, y = value, color = Variable)) +
  theme_minimal() + xlab("") + ylab("Milliards d'€") +
  scale_x_date(breaks = as.Date(paste0(seq(1940, 2100, 1), "-01-01")),
               labels = date_format("%Y")) +
  scale_y_log10(breaks = seq(0, 1500, 100),
                     labels = dollar_format(accuracy = 1, pre = "", su ="Mds€")) +
  theme(legend.position = c(0.3, 0.9),
        legend.title = element_blank())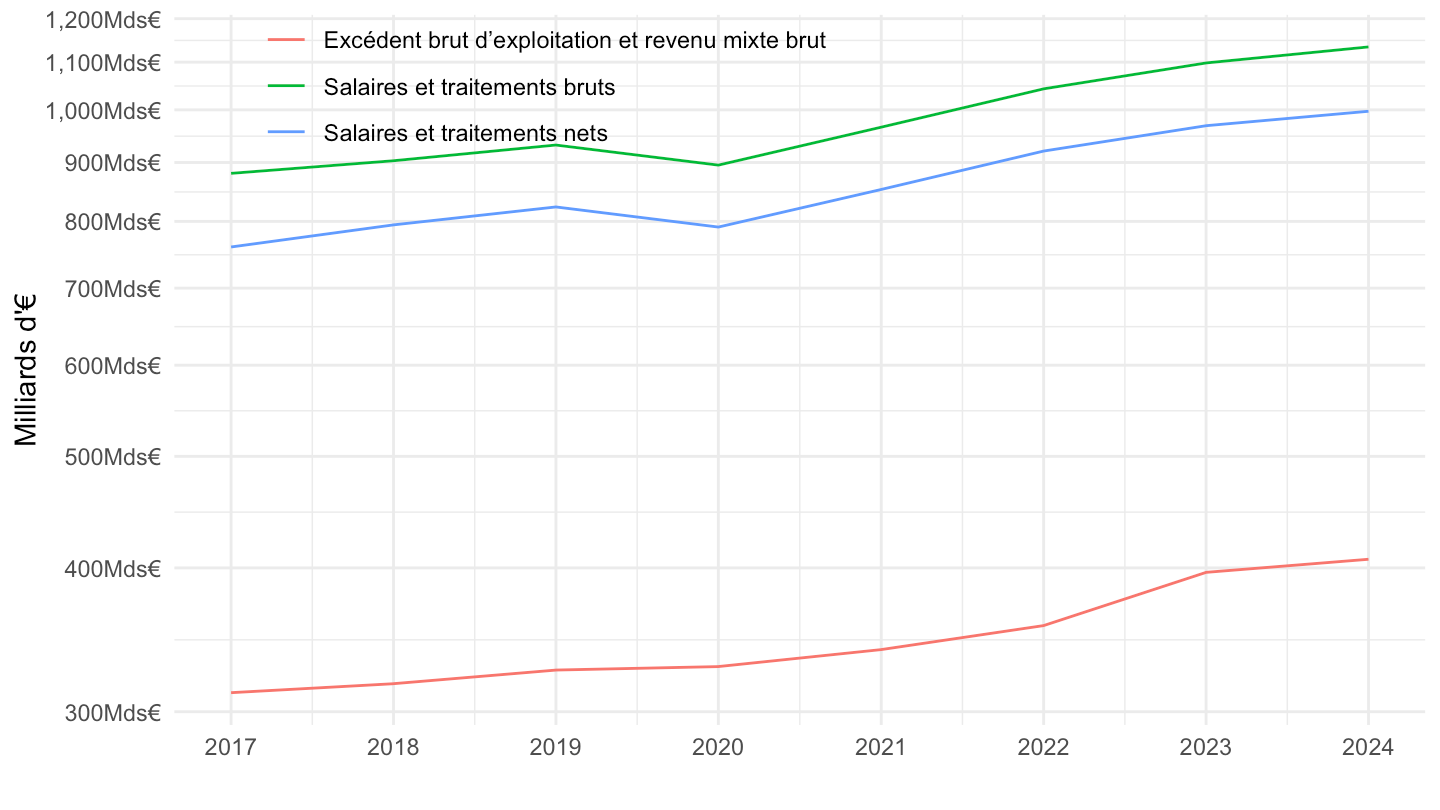
T_7401 |>
  filter(variable %in% c("D1", "D11"),
         line %in% c(25, 26)) |>
  bind_rows(T_2101 |>
              filter(line == 3) |>
              mutate(Variable = "Salaires et traitements nets")) |>
  left_join(gdp, by = "year") |>
  year_to_date2() |>
  ggplot() + geom_line(aes(x = date, y = value / gdp, color = Variable)) +
  theme_minimal() + xlab("") + ylab("% du PIB") +
  scale_x_date(breaks = as.Date(paste0(seq(1940, 2100, 5), "-01-01")),
               labels = date_format("%Y")) +
  scale_y_continuous(breaks = 0.01*seq(-10, 100, 2),
                     labels = percent_format(accuracy = 1)) +

  theme(legend.position = c(0.2, 0.9),
        legend.title = element_blank())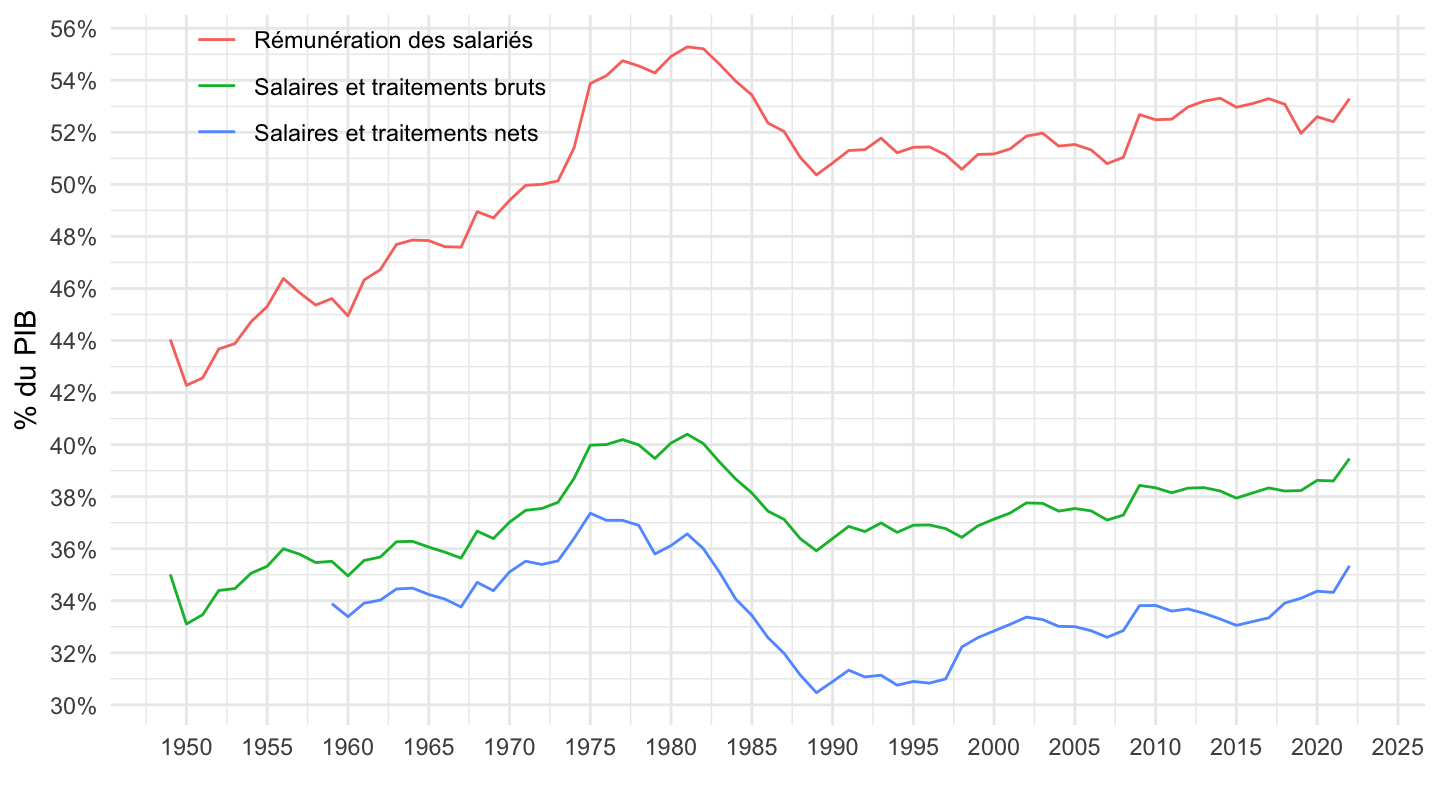
T_7401 |>
  filter(variable %in% c("D1", "D11"),
         line %in% c(25, 26)) |>
  bind_rows(T_2101 |>
              filter(line == 3) |>
              mutate(Variable = "Salaires et traitements nets")) |>
  left_join(gdp, by = "year") |>
  year_to_date2() |>
  filter(date >= as.Date("1995-01-01")) |>
  ggplot() + geom_line(aes(x = date, y = value / gdp, color = Variable)) +
  theme_minimal() + xlab("") + ylab("% du PIB") +
  scale_x_date(breaks = as.Date(paste0(seq(1940, 2100, 5), "-01-01")),
               labels = date_format("%Y")) +
  scale_y_continuous(breaks = 0.01*seq(-10, 100, 2),
                     labels = percent_format(accuracy = 1)) +

  theme(legend.position = c(0.2, 0.7),
        legend.title = element_blank())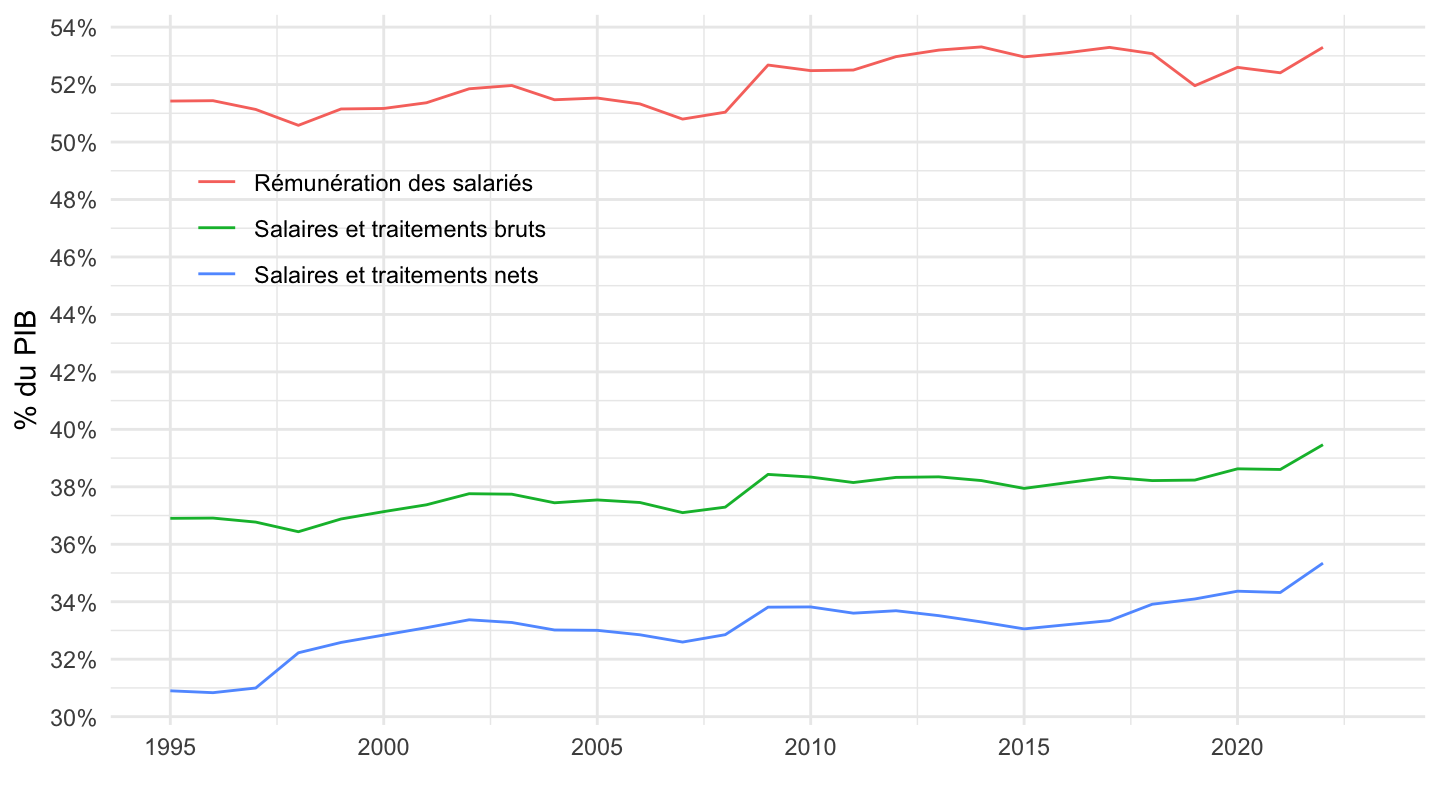
T_7401 |>
  filter(variable %in% c("D1", "D11"),
         line %in% c(25, 26)) |>
  bind_rows(T_2101 |>
              filter(line == 3) |>
              mutate(Variable = "Salaires et traitements nets")) |>
  left_join(rdb2, by = "year") |>
  year_to_date2() |>
  ggplot() + geom_line(aes(x = date, y = value / rdb, color = Variable)) +
  theme_minimal() + xlab("") + ylab("% du RDB") +
  scale_x_date(breaks = as.Date(paste0(seq(1940, 2100, 5), "-01-01")),
               labels = date_format("%Y")) +
  scale_y_continuous(breaks = 0.01*seq(-10, 100, 2),
                     labels = percent_format(accuracy = 1)) +

  theme(legend.position = c(0.2, 0.9),
        legend.title = element_blank())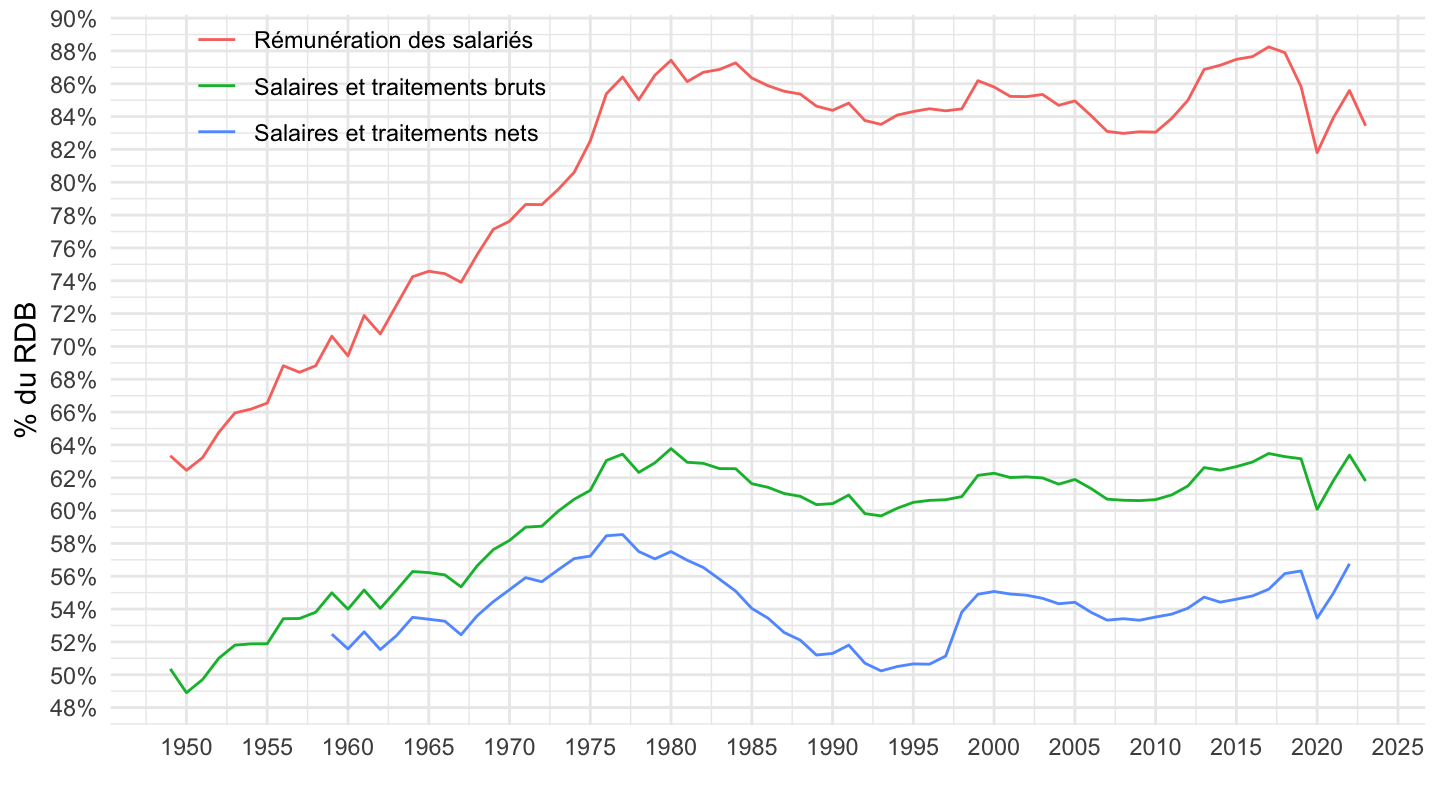
T_7401 |>
  filter(variable %in% c("D1", "D11"),
         line %in% c(25, 26)) |>
  bind_rows(T_2101 |>
              filter(line == 3) |>
              mutate(Variable = "Salaires et traitements nets")) |>
  left_join(rdb2, by = "year") |>
  year_to_date2() |>
  filter(date >= as.Date("1995-01-01")) |>
  ggplot() + geom_line(aes(x = date, y = value / rdb, color = Variable)) +
  theme_minimal() + xlab("") + ylab("% du PIB") +
  scale_x_date(breaks = as.Date(paste0(seq(1940, 2100, 2), "-01-01")),
               labels = date_format("%Y")) +
  scale_y_continuous(breaks = 0.01*seq(-10, 100, 2),
                     labels = percent_format(accuracy = 1)) +

  theme(legend.position = c(0.2, 0.7),
        legend.title = element_blank())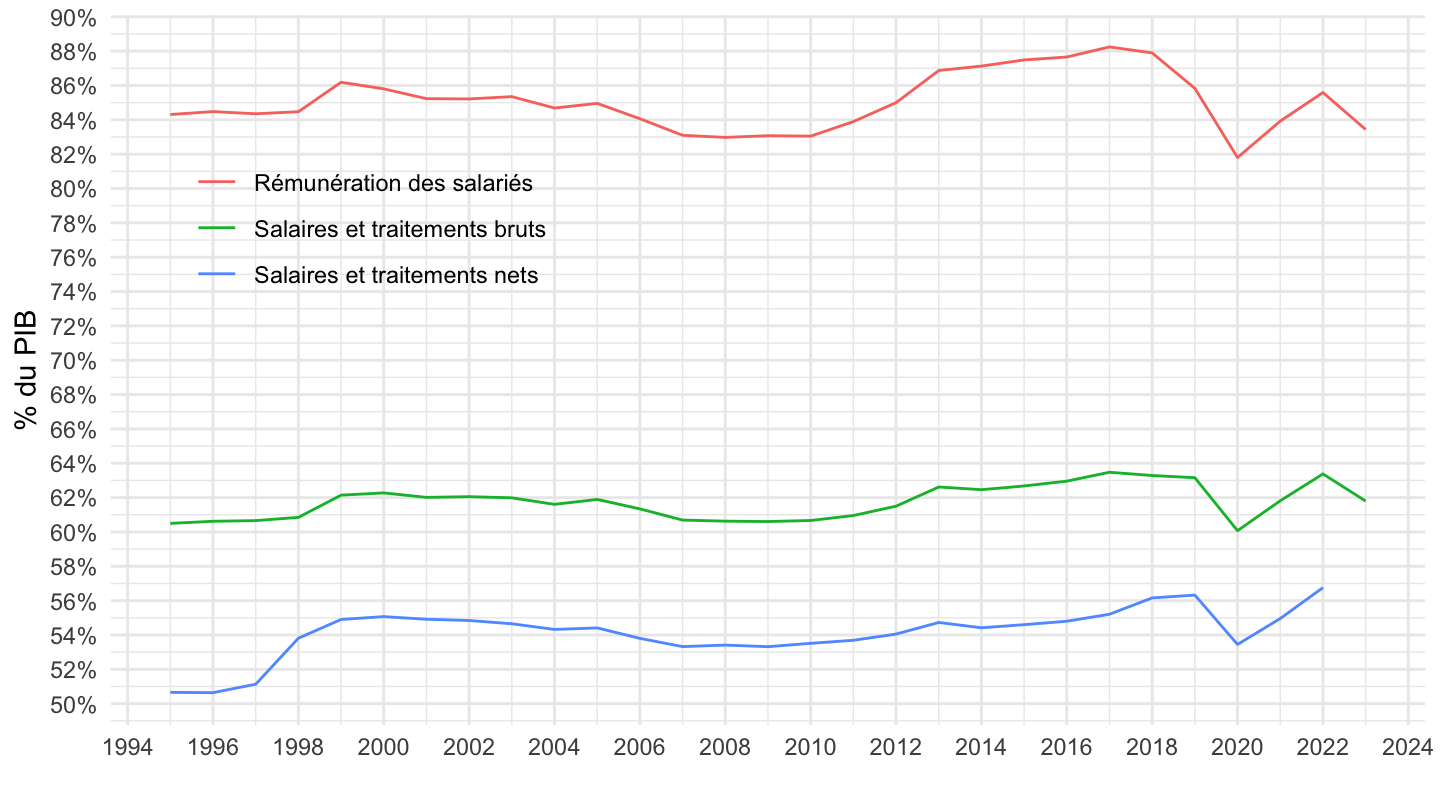
T_7401 |>
  filter(variable %in% c("B6G", "P31")) |>
  left_join(gdp, by = "year") |>
  year_to_date2() |>
  ggplot() + geom_line(aes(x = date, y = value / gdp, color = Variable)) +
  theme_minimal() + xlab("") + ylab("% du PIB") +
  scale_x_date(breaks = as.Date(paste0(seq(1940, 2100, 5), "-01-01")),
               labels = date_format("%Y")) +
  scale_y_continuous(breaks = 0.01*seq(-10, 100, 2),
                     labels = percent_format(accuracy = 1)) +

  theme(legend.position = c(0.7, 0.9),
        legend.title = element_blank())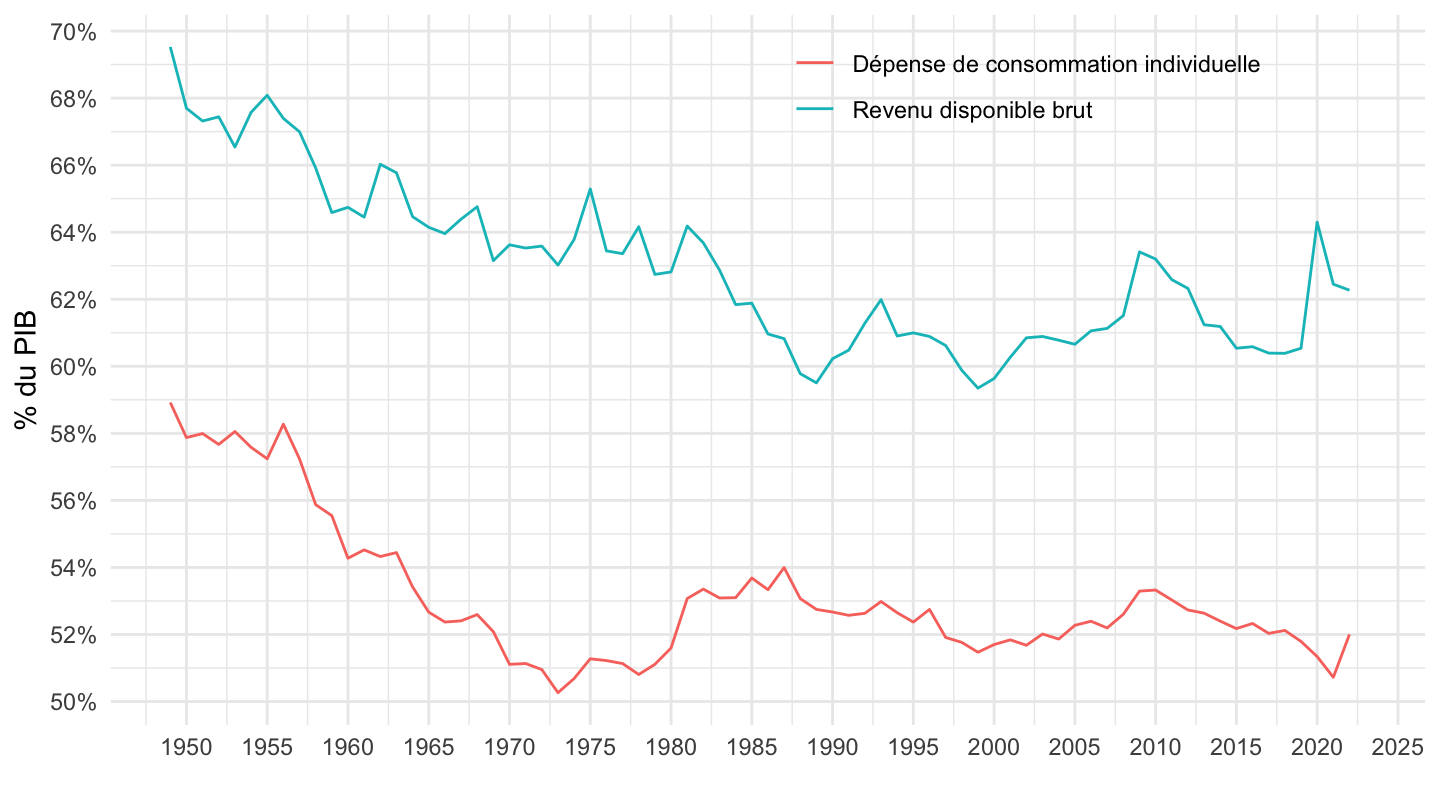
T_7401 |>
  filter(variable %in% c("B6G", "P31")) |>
  left_join(gdp, by = "year") |>
  year_to_date2() |>
  ggplot() + geom_line(aes(x = date, y = value / gdp, color = Variable)) +
  theme_minimal() + xlab("") + ylab("% du PIB") +
  scale_x_date(breaks = as.Date(paste0(seq(1940, 2100, 5), "-01-01")),
               labels = date_format("%Y")) +
  scale_y_continuous(breaks = 0.01*seq(-10, 100, 5),
                     labels = percent_format(accuracy = 1),
                     limits = c(0, 0.72)) +

  theme(legend.position = c(0.7, 0.3),
        legend.title = element_blank())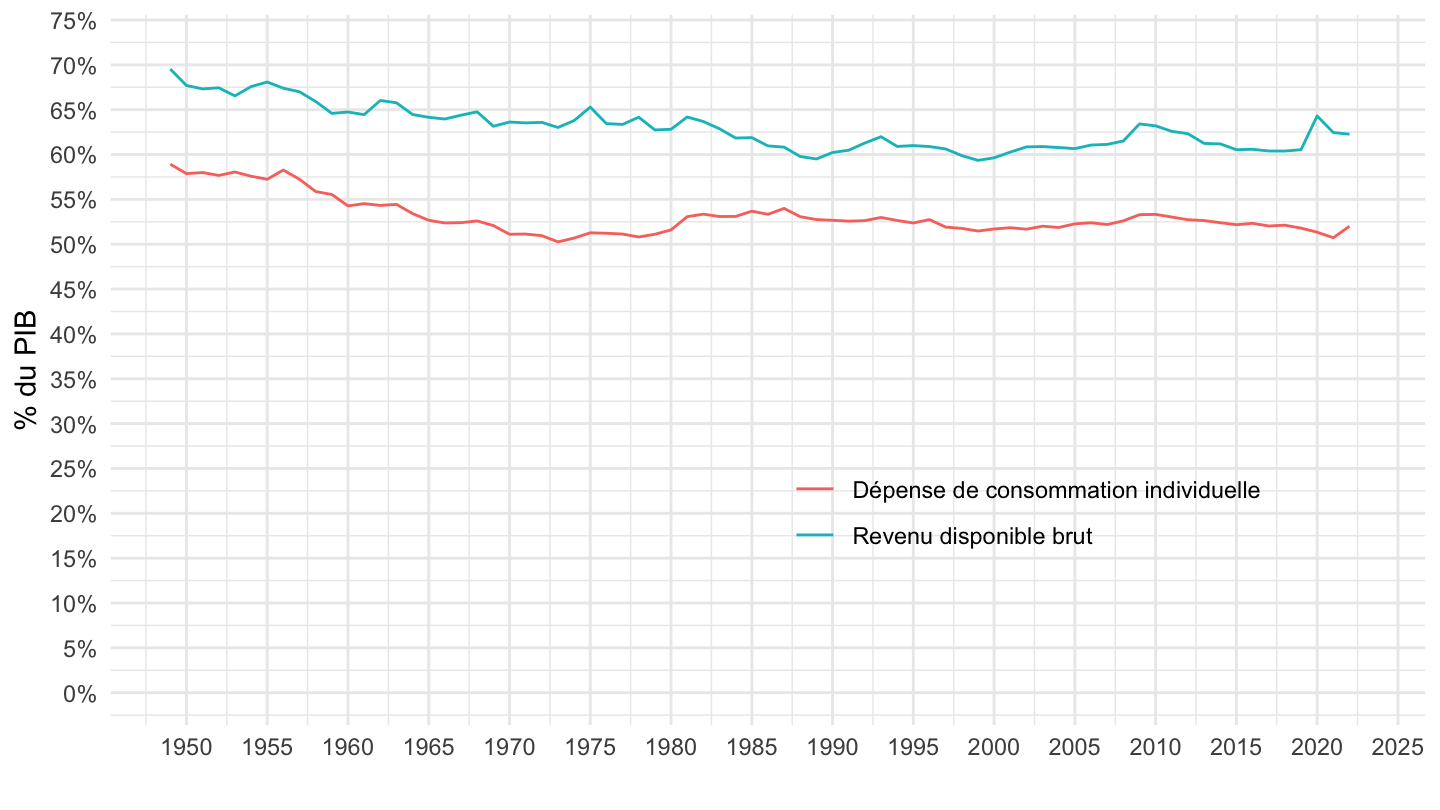
| source | dataset | Title | Updated |
|---|---|---|---|
| source | dataset | Title | Updated |
|---|---|---|---|
| source | dataset | Title | Updated |
|---|---|---|---|
| Page | Intitulé |
|---|---|
| Activité des branches - Emploi | |
| Activité des branches - FBCF, capital fixe et consommation | |
| Activité des branches - Production et consommation intermédiaire | |
| Activité des branches - Valeur ajoutée et rémunération | |
| Consommation des ménages | |
| Finances publiques - Dette et déficit (Maastricht) | |
| Finances publiques - Dépenses et recettes | |
| Ménages - Revenu et pouvoir d’achat | |
| PIB et grands agrégats économiques | |
| Patrimoine - Comptes de patrimoine | |
| Patrimoine - Comptes financiers | |
| Ressources et emplois - Consommation des APU et ISBLSM | |
| Ressources et emplois - FBCF et variation de stocks | |
| Ressources et emplois - Production et consommation intermédiaire | |
| Secteurs institutionnels - Administrations publiques | |
| Secteurs institutionnels - Entreprises non financières | |
| Secteurs institutionnels - ISBLSM | |
| Secteurs institutionnels - Ménages | |
| Secteurs institutionnels - Reste du monde | |
| Secteurs institutionnels - Sociétés financières | |
| Tableaux de synthèse - TES et TEE | |
| Échanges extérieurs | |


