Last observation: 2023 (N = 3)
First observation: 1960 (N = 3)
Last data update: 02 août 2026, 11:05
Last compile: 10 oct. 2026, 01:25
`reve-conso-evo-dep-pa` |>
  group_by(variable) |>
  summarise(Nobs = n()) |>
  arrange(-Nobs) |>
print_table_conditional()| variable | Nobs |
|---|---|
| Dépense de consommation finale (en volume) | 64 |
| Pouvoir d'achat arbitrable | 64 |
| Pouvoir d'achat du RDB | 64 |
`reve-conso-evo-dep-pa` |>
  year_to_date2() |>
  group_by(date) |>
  summarise(Nobs = n()) |>
  arrange(desc(date)) |>
print_table_conditional()`reve-conso-evo-dep-pa` |>
arrange(year) |>
add_row(year = "1959", variable = "Dépense de consommation finale (en volume)", value = NA) |>
add_row(year = "1959", variable = "Pouvoir d'achat du RDB", value = NA) |>
add_row(year = "1959", variable = "Pouvoir d'achat arbitrable", value = NA) |>
year_to_date2() |>
filter(date >= as.Date("1959-01-01")) |>
group_by(variable) |>
arrange(date) |>
mutate(index = c(100, 100*cumprod(1 + value[-1]/100))) |>
ggplot() + geom_line(aes(x = date, y = index, color = variable)) +
xlab("") + ylab("") + theme_minimal() +
scale_x_date(breaks = as.Date(paste0(seq(1959, 2100, 5), "-01-01")),
labels = date_format("%Y")) +
theme(legend.position = c(0.3, 0.85),
legend.title = element_blank()) +
scale_y_log10(breaks = seq(100, 1000, 100)) +
geom_label_repel(data = . %>% filter(date == max(date)),
aes(x = date, y = index, color = variable, label = round(index, 1)))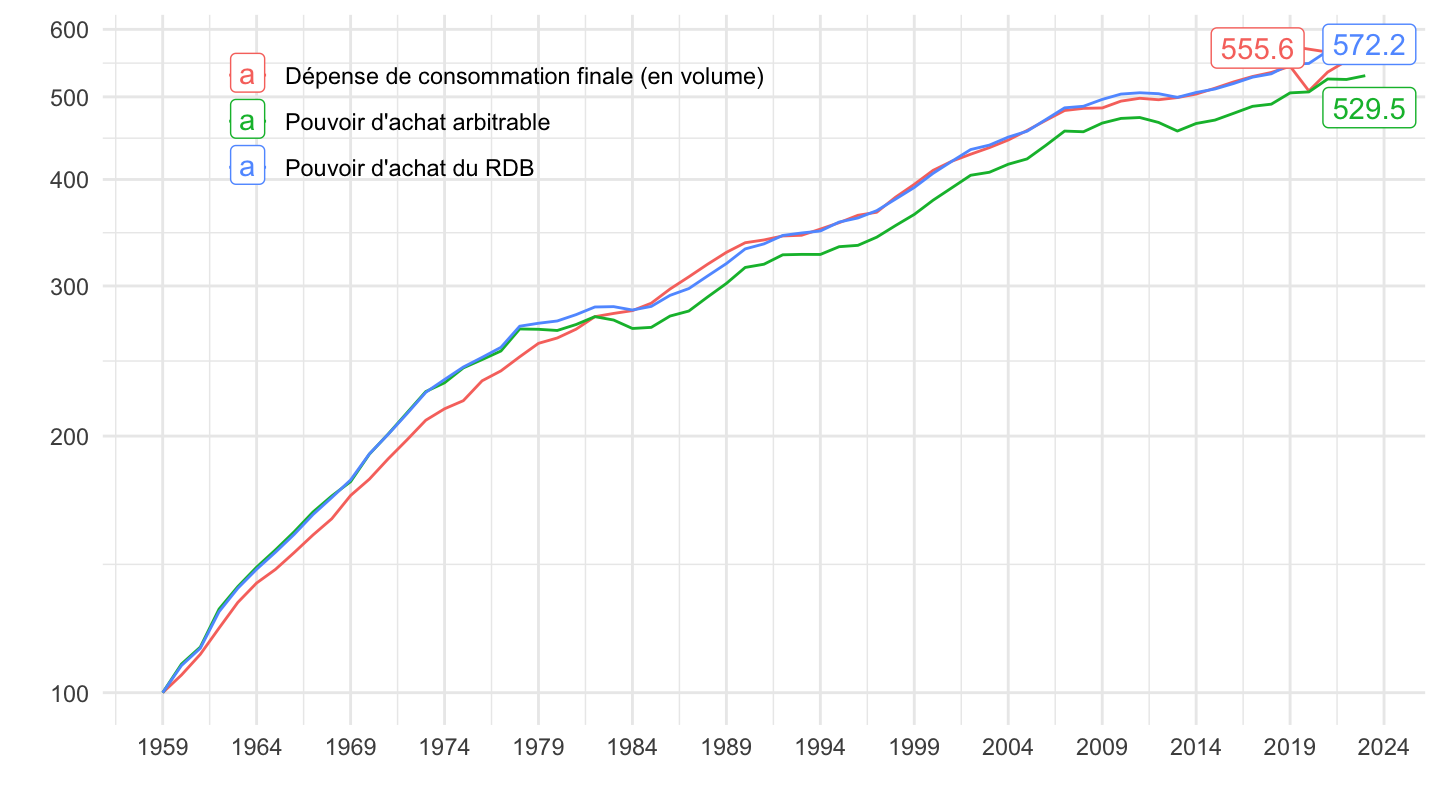
`reve-conso-evo-dep-pa` |>
  year_to_date2() |>
  filter(date >= as.Date("1990-01-01")) |>
  group_by(variable) |>
  arrange(date) |>
  mutate(index = c(100, 100*cumprod(1 + value[-1]/100))) |>
  ggplot() + geom_line(aes(x = date, y = index, color = variable)) +
  xlab("") + ylab("") + theme_minimal() +

  scale_x_date(breaks = as.Date(paste0(seq(1990, 2100, 5), "-01-01")),
               labels = date_format("%Y")) +
  theme(legend.position = c(0.3, 0.85),
        legend.title = element_blank()) +
  scale_y_log10(breaks = seq(100, 250, 5)) +
  geom_label_repel(data = . %>% filter(date == max(date)),
             aes(x = date, y = index, color = variable, label = round(index, 1)))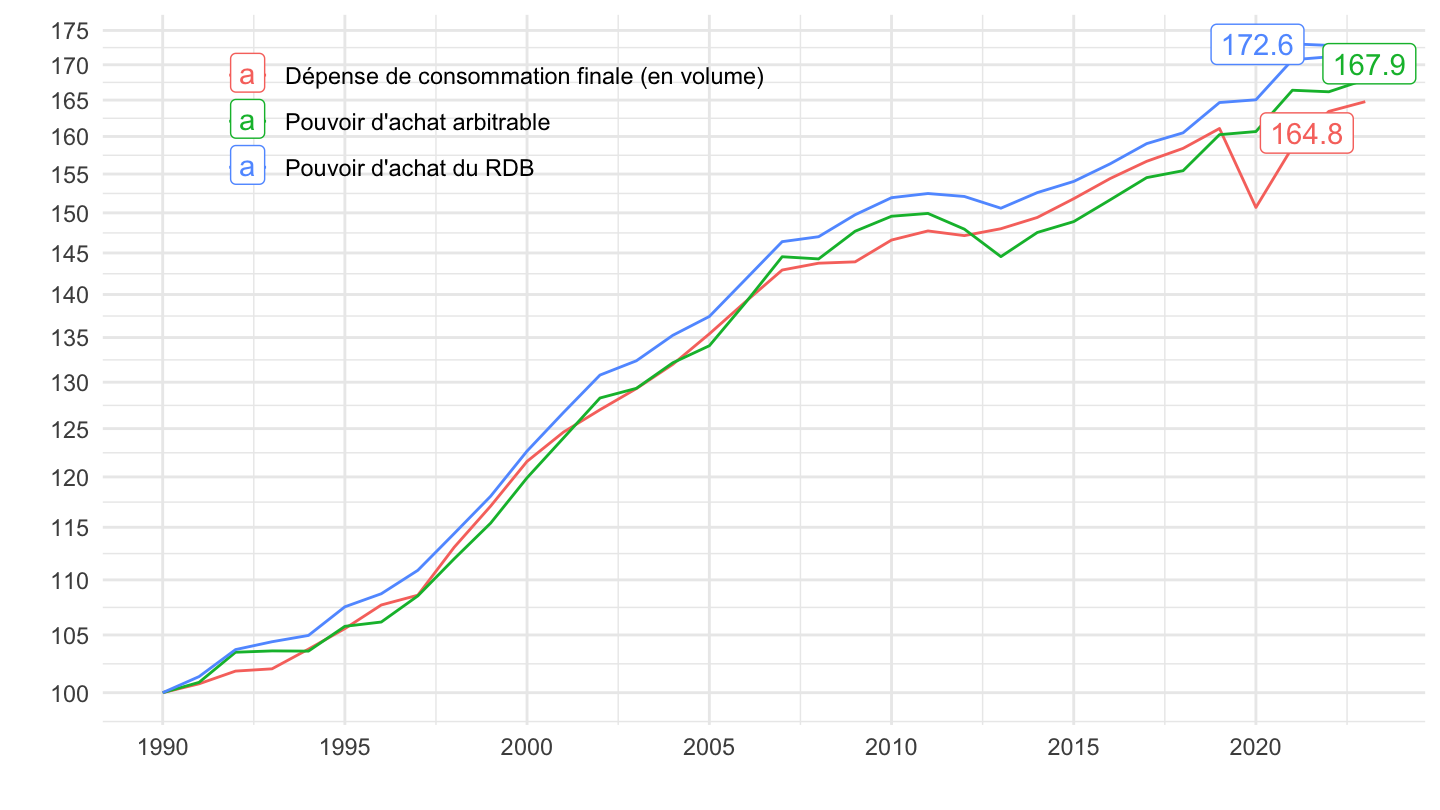
`reve-conso-evo-dep-pa` |>
  year_to_date2() |>
  filter(date >= as.Date("1999-01-01")) |>
  group_by(variable) |>
  arrange(date) |>
  mutate(index = c(100, 100*cumprod(1 + value[-1]/100))) |>
  ggplot() + geom_line(aes(x = date, y = index, color = variable)) +
  xlab("") + ylab("") + theme_minimal() +

  scale_x_date(breaks = as.Date(paste0(seq(1999, 2100, 5), "-01-01")),
               labels = date_format("%Y")) +
  theme(legend.position = c(0.3, 0.85),
        legend.title = element_blank()) +
  scale_y_log10(breaks = seq(100, 150, 5)) +
  geom_label_repel(data = . %>% filter(date == max(date)),
             aes(x = date, y = index, color = variable, label = round(index, 1)))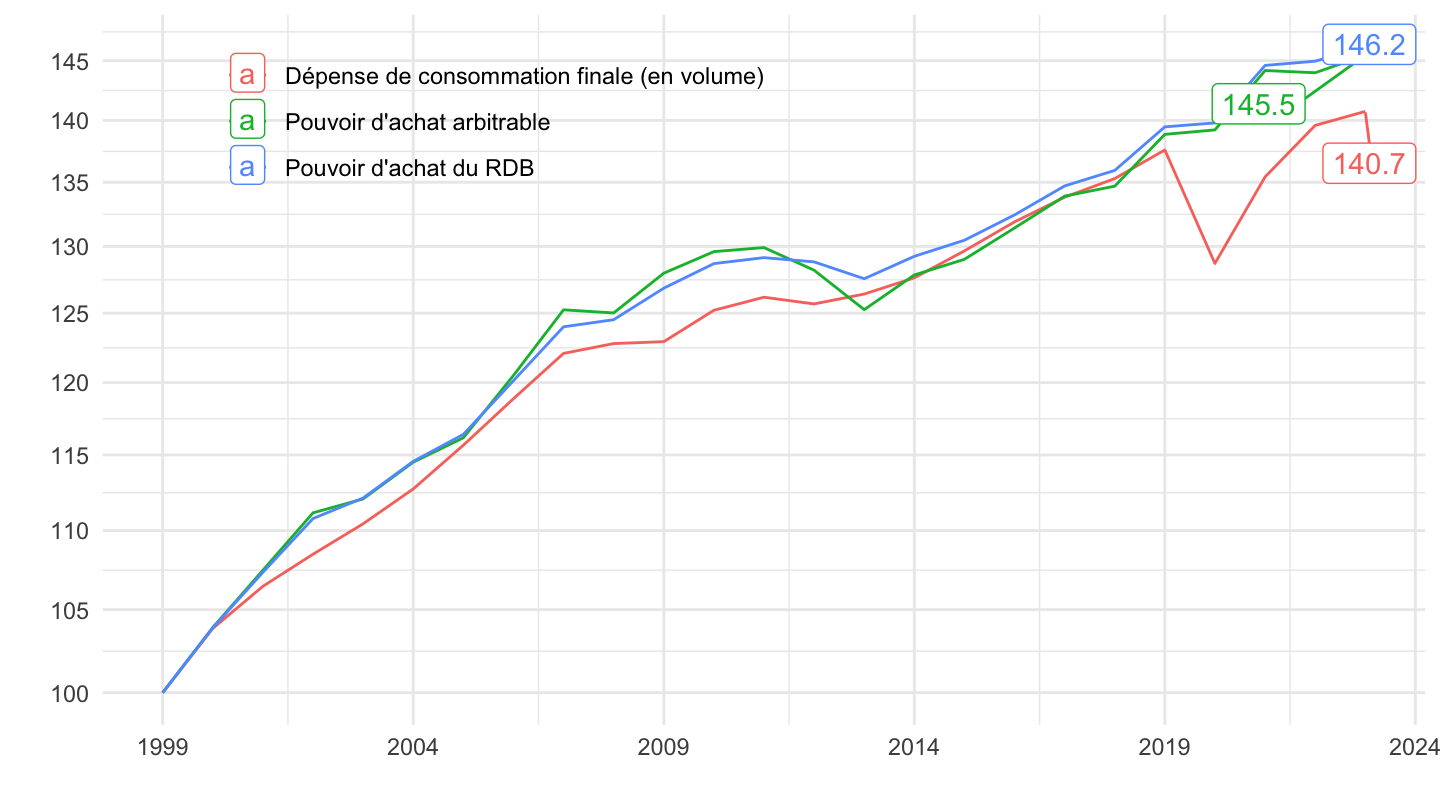
`reve-conso-evo-dep-pa` |>
  year_to_date2() |>
  filter(date >= as.Date("2007-01-01")) |>
  group_by(variable) |>
  arrange(date) |>
  mutate(index = c(100, 100*cumprod(1 + value[-1]/100))) |>
  ggplot() + geom_line(aes(x = date, y = index, color = variable)) +
  xlab("") + ylab("") + theme_minimal() +

  scale_x_date(breaks = as.Date(paste0(seq(1999, 2100, 1), "-01-01")),
               labels = date_format("%Y")) +
  theme(legend.position = c(0.3, 0.85),
        legend.title = element_blank()) +
  scale_y_log10(breaks = seq(100, 150, 2)) +
  geom_label_repel(data = . %>% filter(date == max(date)),
             aes(x = date, y = index, color = variable, label = round(index, 1)))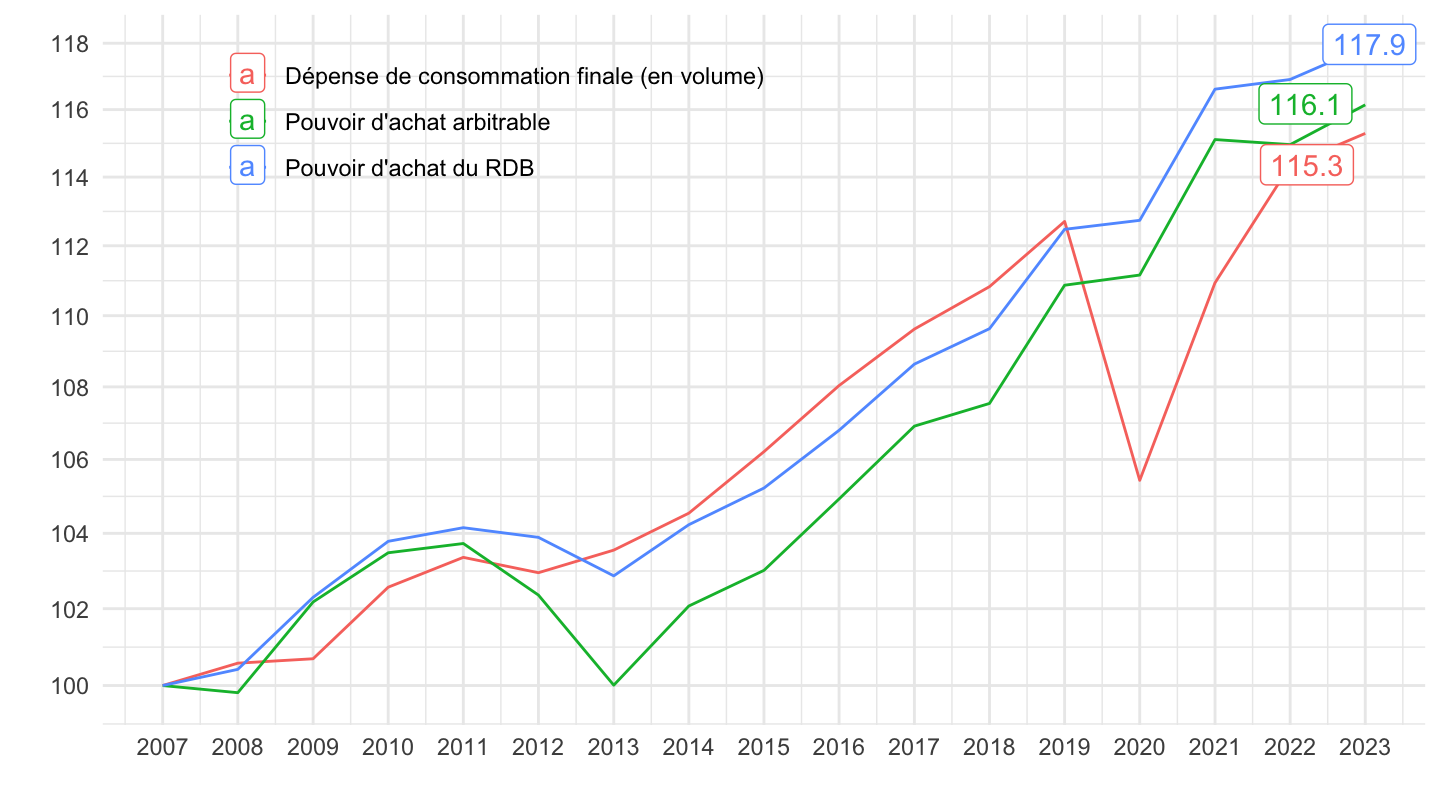
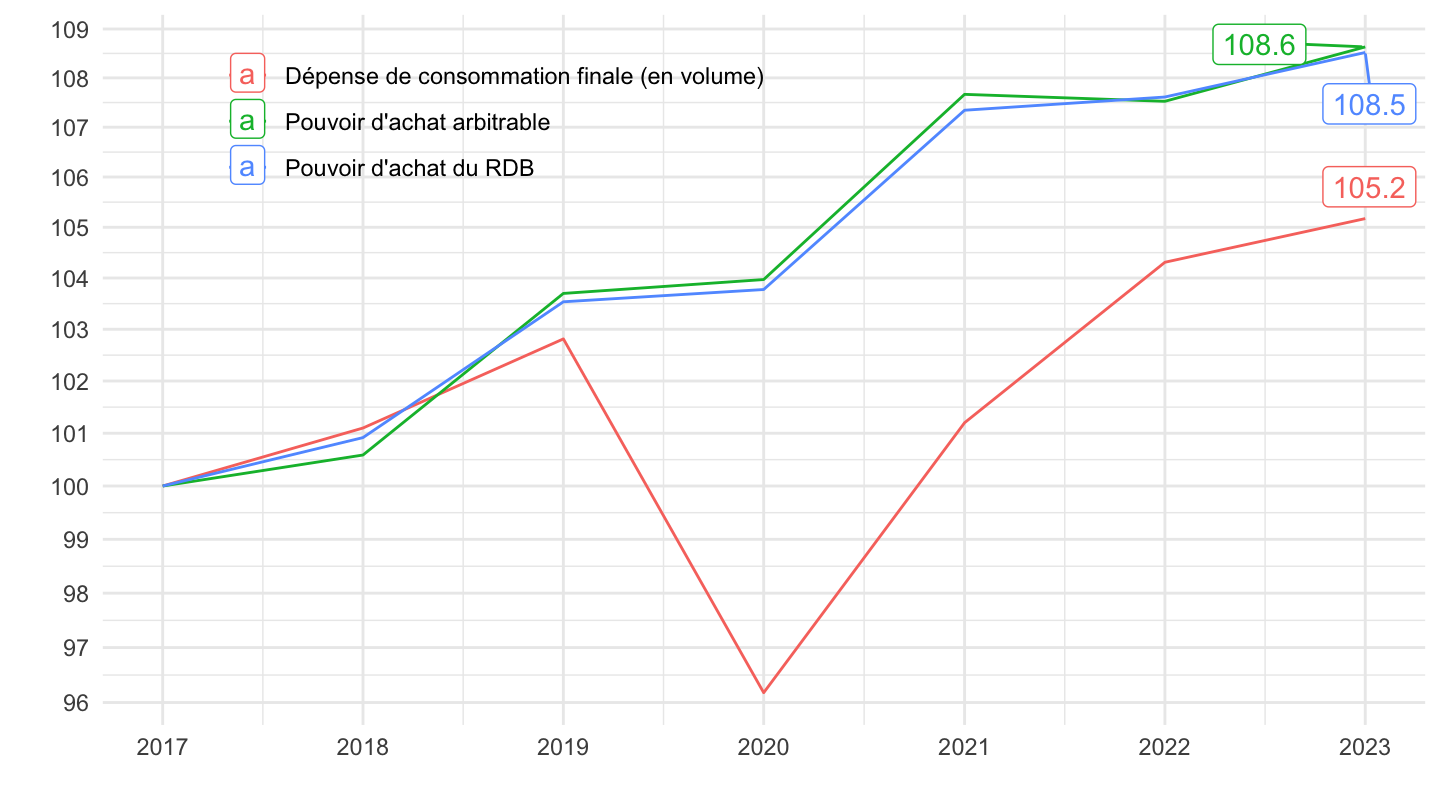
`reve-conso-evo-dep-pa` |>
  year_to_date2() |>
  filter(date >= as.Date("2017-01-01")) |>
  group_by(variable) |>
  arrange(date) |>
  mutate(index = c(100, 100*cumprod(1 + value[-1]/100))) |>
  ggplot() + geom_line(aes(x = date, y = index, color = variable)) +
  xlab("") + ylab("") + theme_minimal() +

  scale_x_date(breaks = as.Date(paste0(seq(1999, 2100, 1), "-01-01")),
               labels = date_format("%Y")) +
  theme(legend.position = c(0.3, 0.85),
        legend.title = element_blank()) +
  scale_y_log10(breaks = seq(50, 150, 1)) +
  geom_label_repel(data = . %>% filter(date == max(date)),
             aes(x = date, y = index, color = variable, label = round(index, 1)))