Saving
Data
Info
Data on saving
Title | source | dataset | .html | .RData |
---|---|---|---|---|
Comptes Financiers Trimestriels | bdf | CFT | 2024-09-30 | 2024-07-01 |
Table 5.1. Saving and Investment by Sector (A) (Q) | bea | T50100 | 2024-02-11 | 2024-03-13 |
Saving - saving | fred | saving | 2024-11-01 | 2024-11-01 |
National Accounts at a Glance - NAAG | oecd | NAAG | 2024-04-16 | 2024-03-13 |
Gross domestic savings (% of GDP) - NY.GDS.TOTL.ZS | wdi | NY.GDS.TOTL.ZS | 2022-09-27 | 2024-09-18 |
Gross savings (% of GDP) - NY.GNS.ICTR.ZS | wdi | NY.GNS.ICTR.ZS | 2022-09-27 | 2024-09-18 |
Données sur l’épargne
Title | source | dataset | .html | .RData |
---|---|---|---|---|
Comptes Financiers Trimestriels | bdf | CFT | 2024-09-30 | 2024-07-01 |
Budget de famille 2017 | insee | bdf2017 | 2024-11-05 | 2023-11-21 |
Plus d’épargne chez les plus aisés, plus de dépenses contraintes chez les plus modestes - ip1815 | insee | ip1815 | 2024-09-06 | 2023-10-05 |
7.401 – Compte des ménages (S14) (En milliards d'euros) | insee | T_7401 | 2024-10-18 | 2024-10-18 |
Revenu, pouvoir d'achat et comptes des ménages - Valeurs aux prix courants | insee | t_men_val | 2024-11-05 | 2024-09-02 |
Pouvoir d'achat et ratios des comptes des ménages | insee | t_pouvachat_val | 2024-11-05 | 2024-09-04 |
Récapitulatif des séries des comptes d'agents | insee | t_recapAgent_val | 2024-11-05 | 2024-09-02 |
LAST_COMPILE
LAST_COMPILE |
---|
2024-11-06 |
U.S.
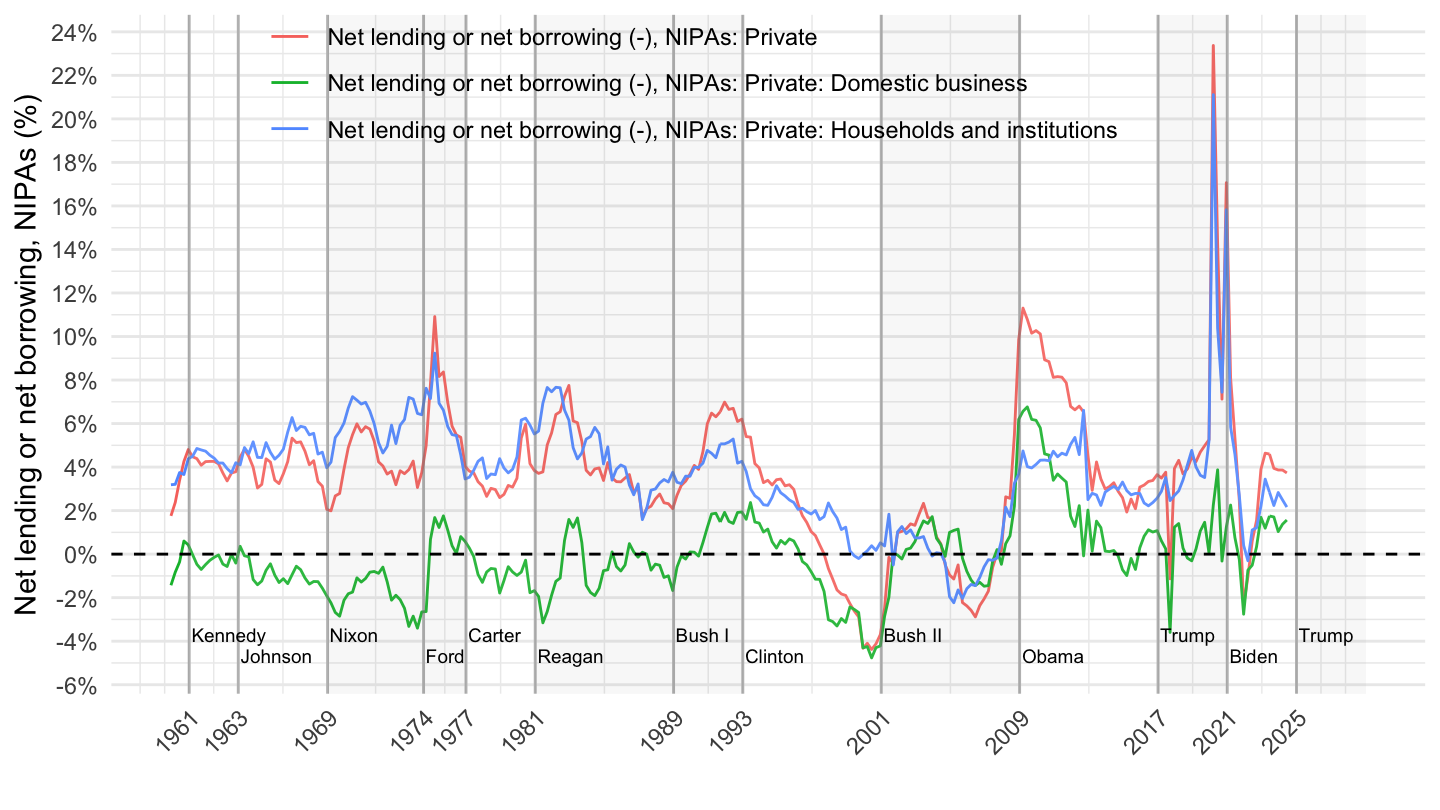
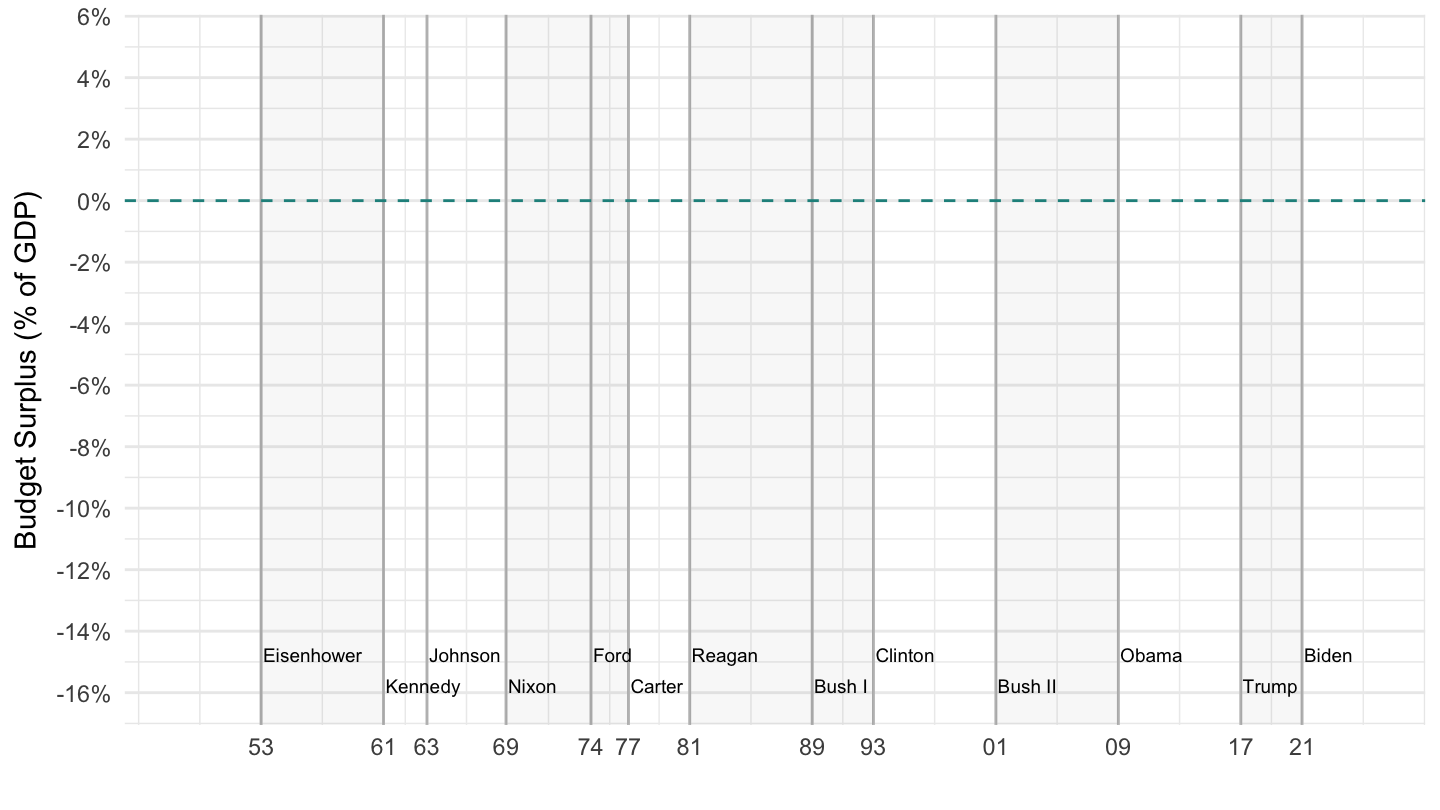
Public Deficit
ig_d("fred", "saving", "surplus-gdp-1947-2020")
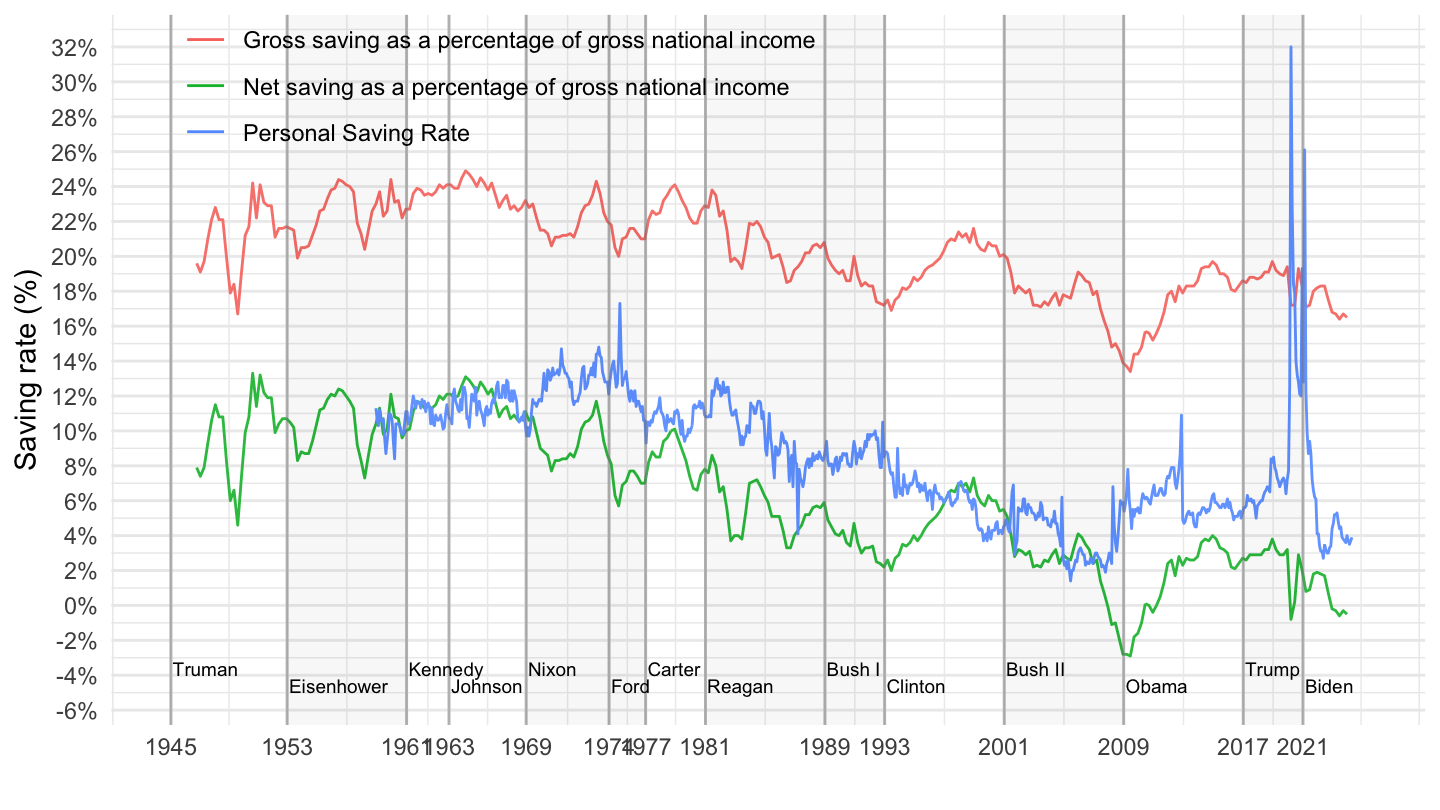
Gross/net saving
ig_d("bea", "T50100", "depreciation-net-saving")
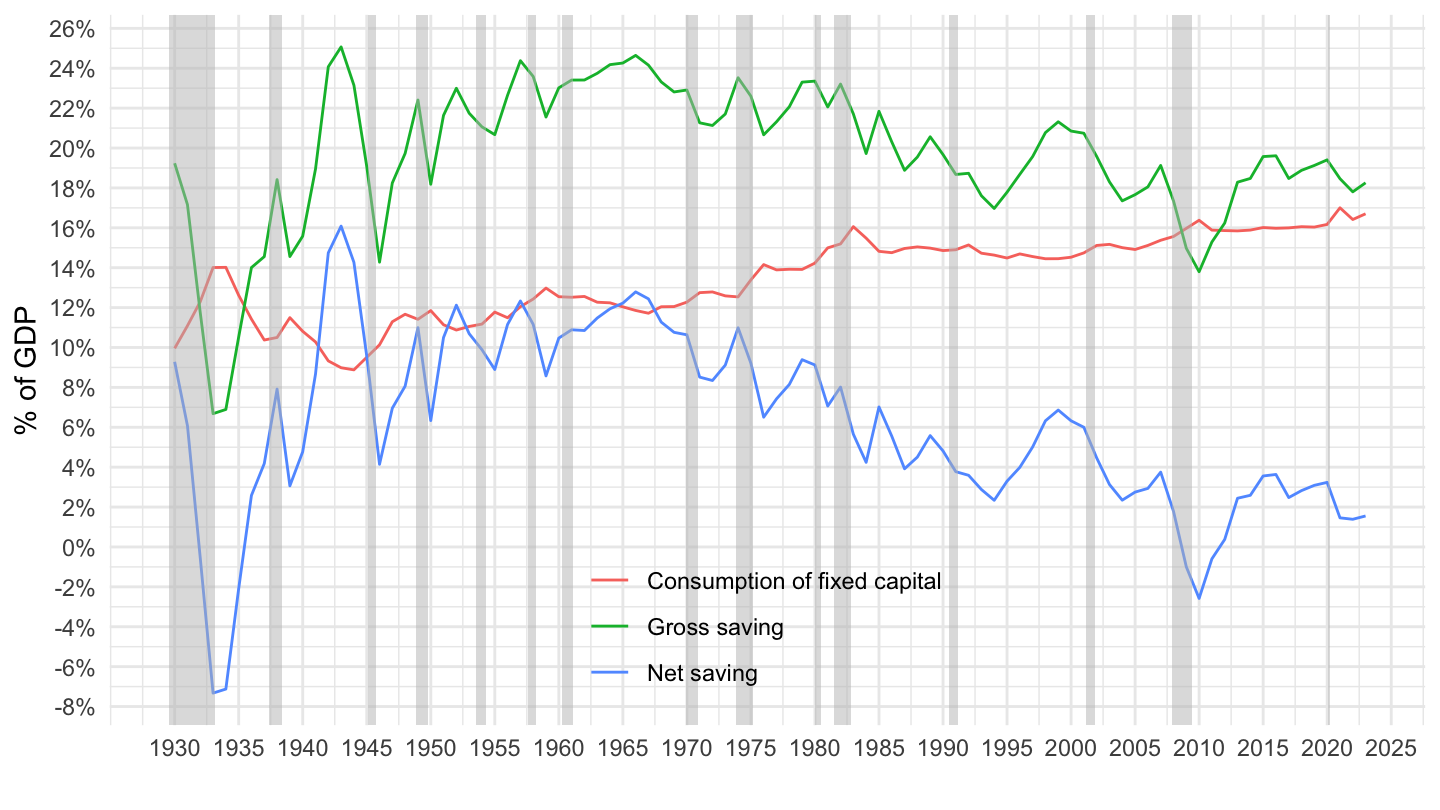
Gross/net saving
ig_d("bea", "T50100", "depreciation-net-saving")
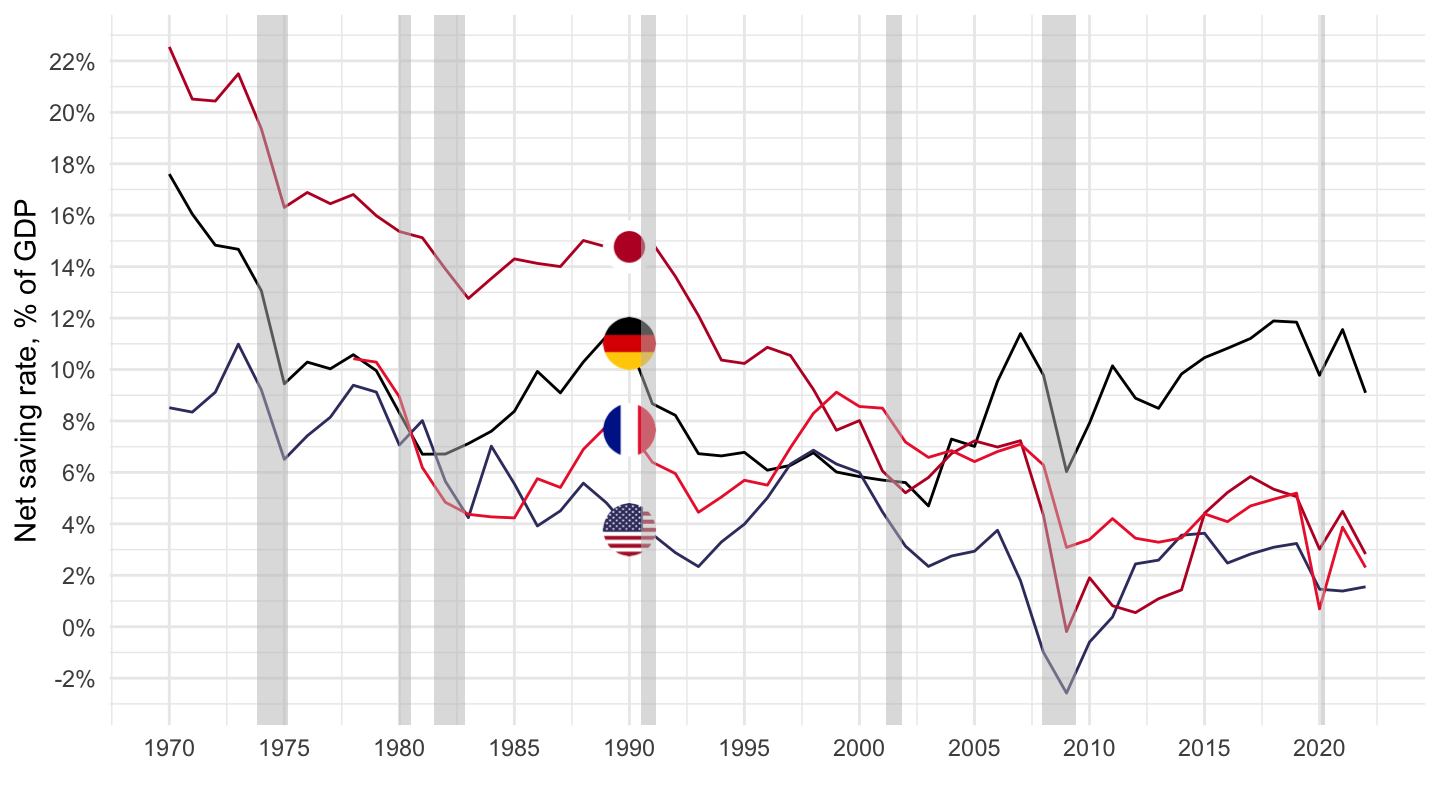
Net saving rate (% of GDP)
- Disposable income. [html] Disposable income is closest to the concept of income as generally understood in economics. Household disposable income is income available to households such as wages and salaries, income from self-employment and unincorporated enterprises, income from pensions and other social benefits, and income from financial investments (less any payments of tax, social insurance contributions and interest on financial liabilities). ‘Gross’ means that depreciation costs are not subtracted. For gross household disposable income per capita, growth rates (percentage change from previous period) are presented; these are ‘real’ growth rates adjusted to remove the effects of price changes. Information is also presented for gross household disposable income including social transfers in kind, such as health or education provided for free or at reduced prices by governments and not-for-profit organisations. This indicator is in US dollars per capita at current prices and PPPs. In the System of National Accounts, household disposable income including social transfers in kind is referred to as ‘adjusted household disposable income’. All OECD countries compile their data according to the 2008 System of National Accounts (SNA 2008).
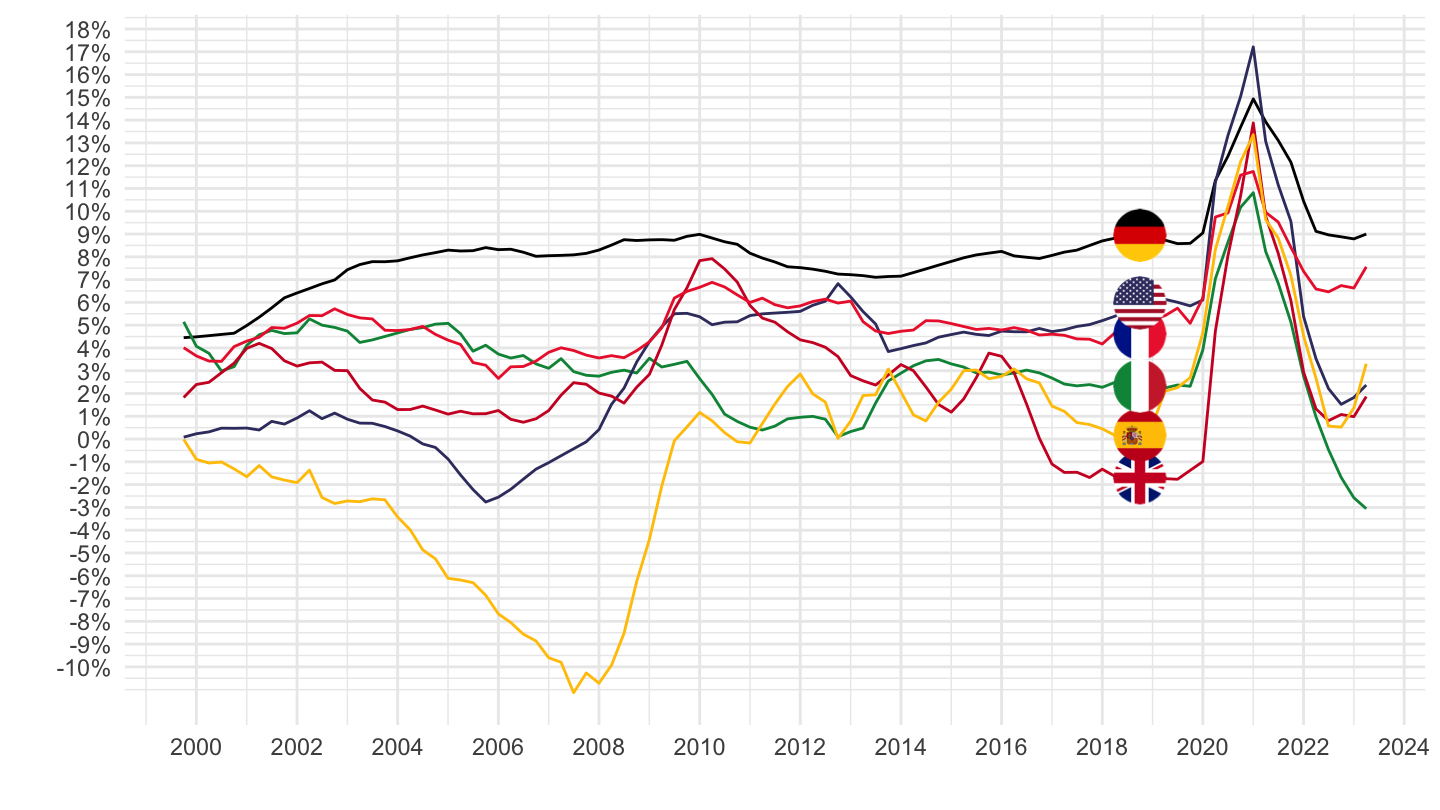
France, Germany, United States, Japan
ig_d("oecd", "NAAG", "B8NS-FRA-USA")
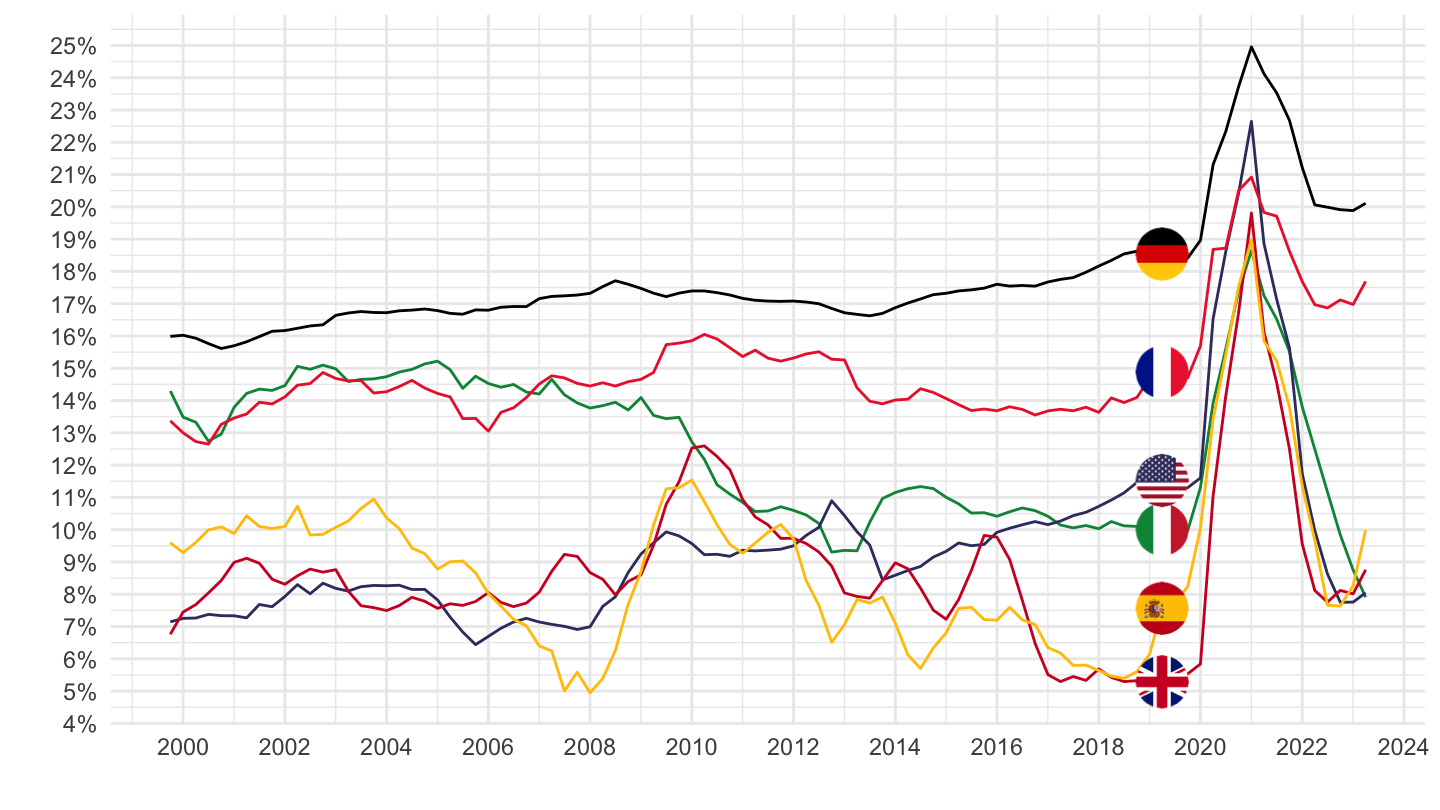
Germany, France, Spain, Italy
ig_d("oecd", "NAAG", "B8NS-ITA-ESP-FRA-DEU")
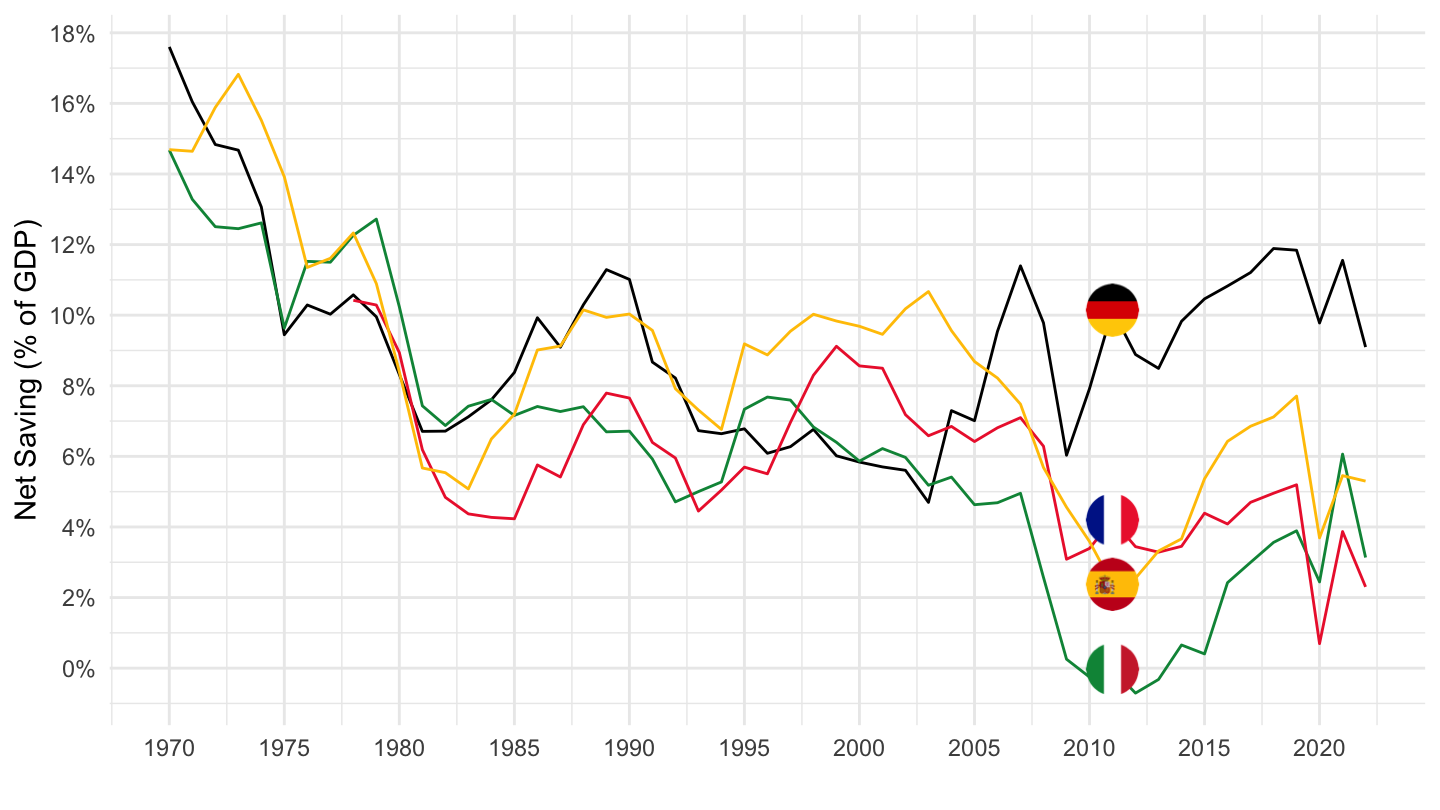
Saving rate (%)
United States
ig_d("fred", "saving", "PSAVERT")
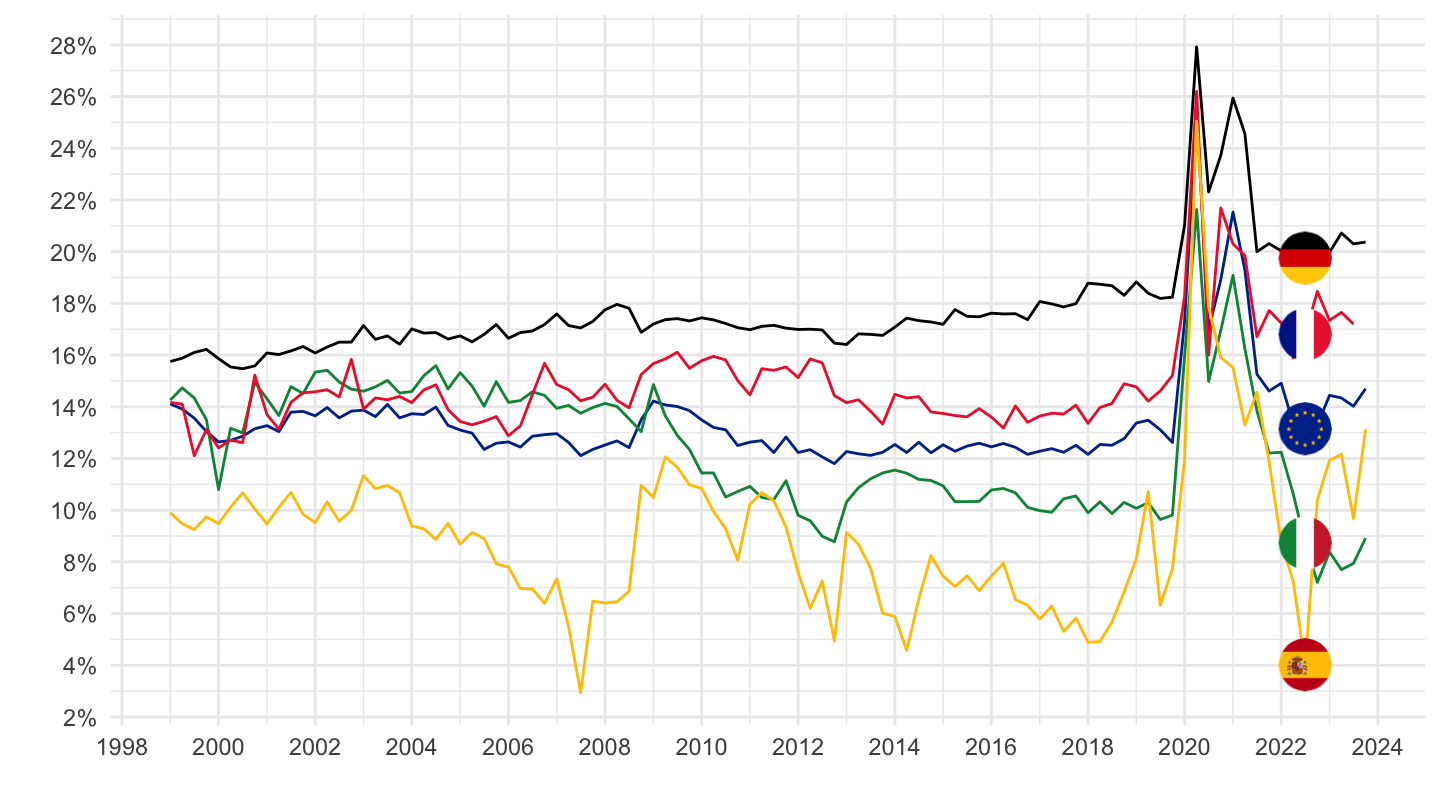
France, Germany, Italy, Europe
Key indicators
ig_d("eurostat", "nasq_10_ki", "SRGS14S15-FR-DE-IT-ES-EA20-2000")
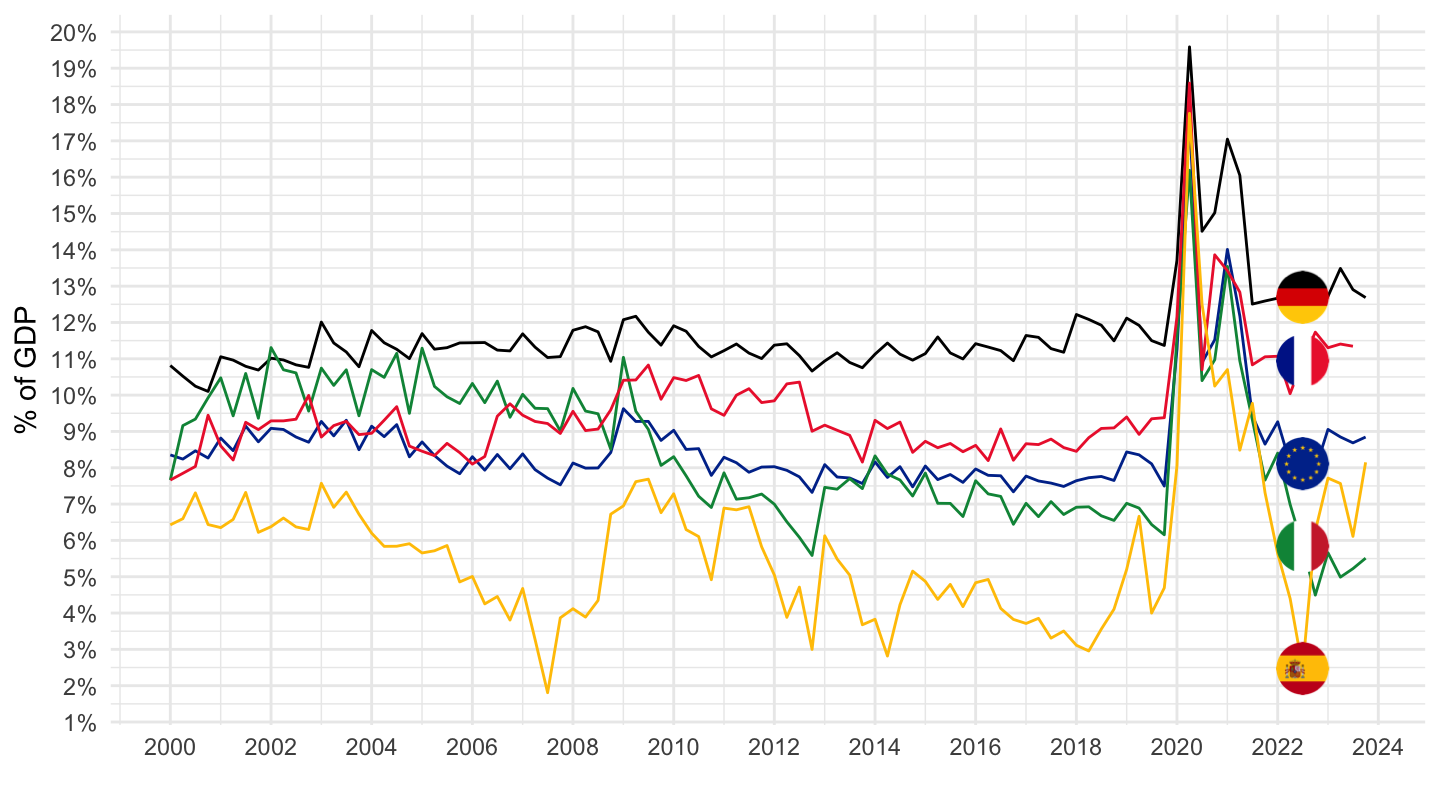
% of GDP
ig_d("eurostat", "nasq_10_nf_tr", "B8G-FR-DE-IT-ES-2000")
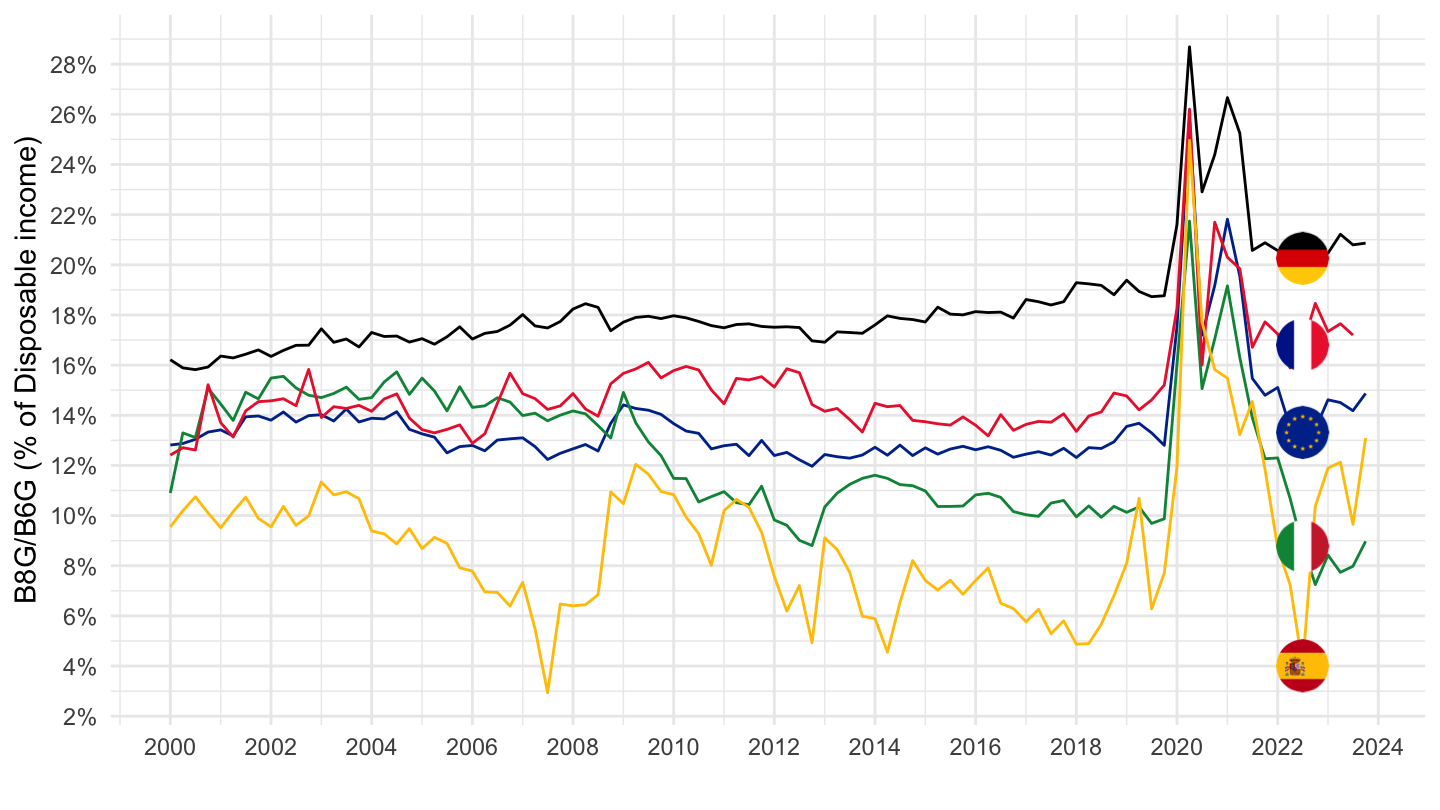
% of Disposable income
ig_d("eurostat", "nasq_10_nf_tr", "B8G-B6G-FR-DE-IT-ES-2000")
Bank of France
Saving Rate
ig_d("bdf", "CFT", "B8G")
Financial Saving Rate
ig_d("bdf", "CFT", "B9Z")
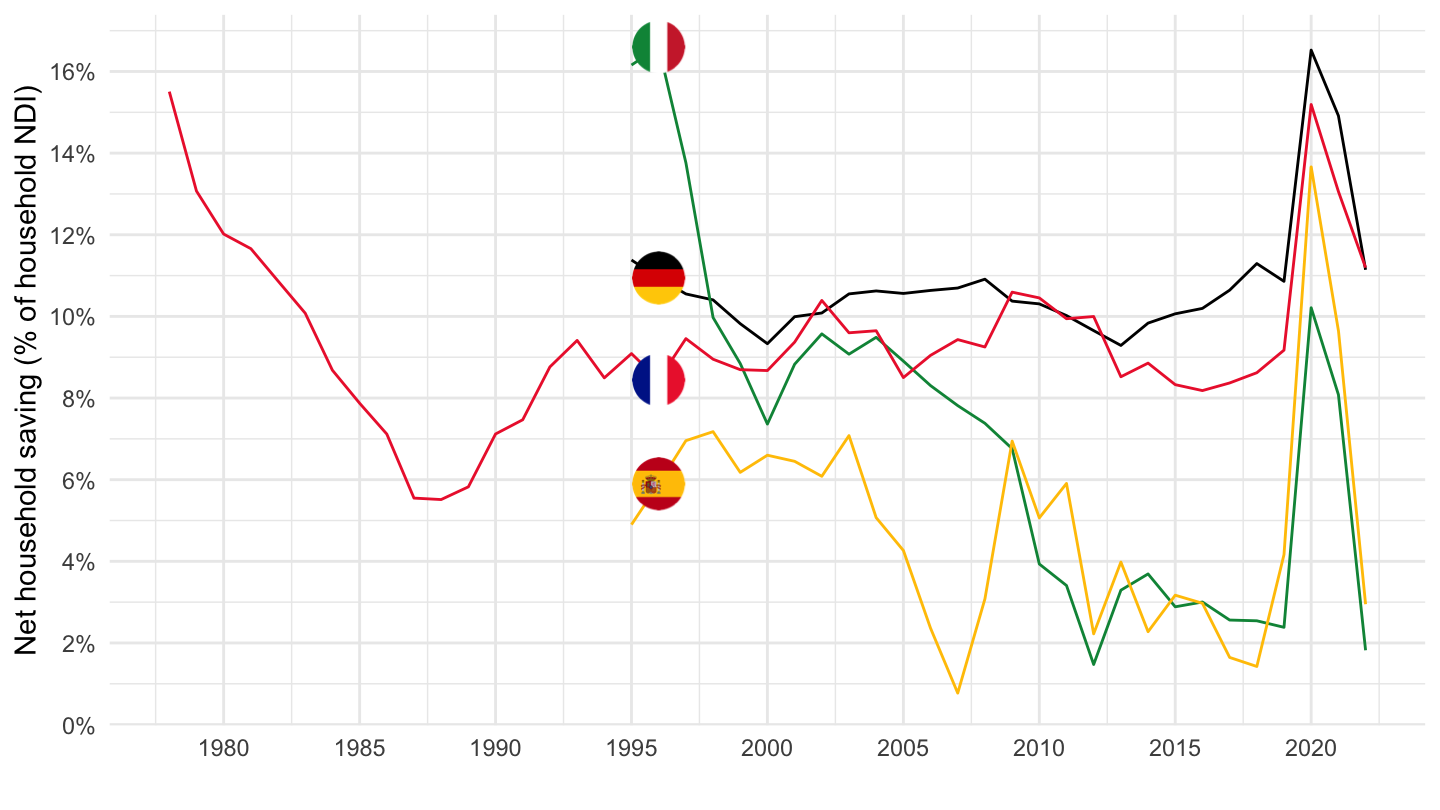
Net saving rate, % of NDI
OECD
ig_d("oecd", "NAAG", "B8NS14S15SB6NS14-ITA-ESP-FRA-DEU")
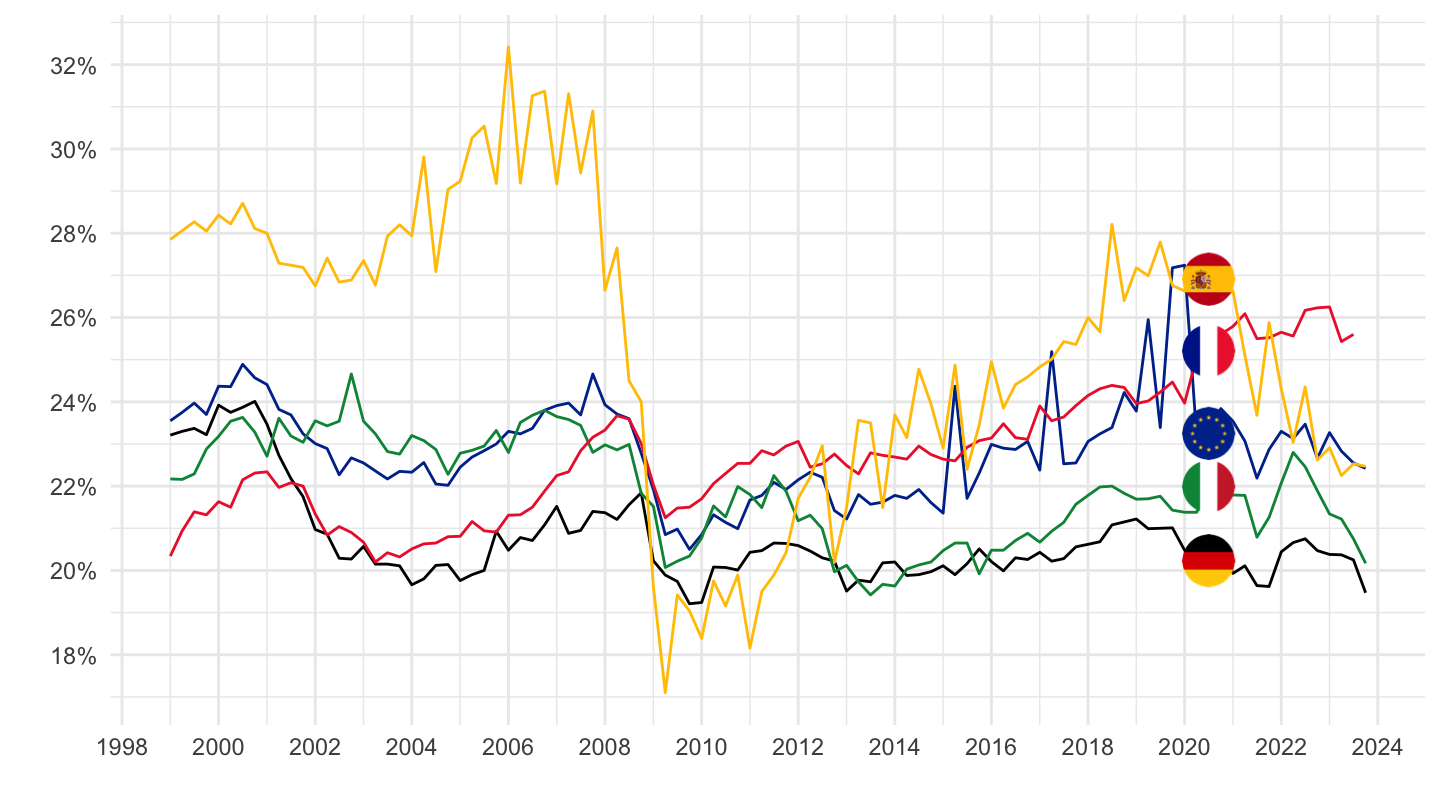
Investment rate (%)
France, Germany, Italy, Europe
ig_d("eurostat", "nasq_10_ki", "IRGS11-FR-DE-IT-ES-EA20-2000")