
Last observation: août 2026 (N = 130)
First observation: janv. 1990 (N = 145)
Last data update: 09 oct. 2026, 22:54
Last compile: 10 oct. 2026, 01:20
`IPPMP-NF` |>
  filter(INDICATEUR == "CIMP",
         MATIERES_PREMIERES == "41") |>


  month_to_date() |>
  ggplot() + theme_minimal() + xlab("") + ylab("Pétrole brut  Brent (Londres) – par baril") +
  geom_line(aes(x = date, y = OBS_VALUE, color = Monnaie)) +
  scale_x_date(breaks = seq(1990, 2100, 5) |> paste0("-01-01") |> as.Date(),
               labels = date_format("%Y")) +
  scale_y_continuous(breaks = seq(0, 200, 10)) +
  theme(legend.position = c(0.3, 0.9),
        legend.title = element_blank())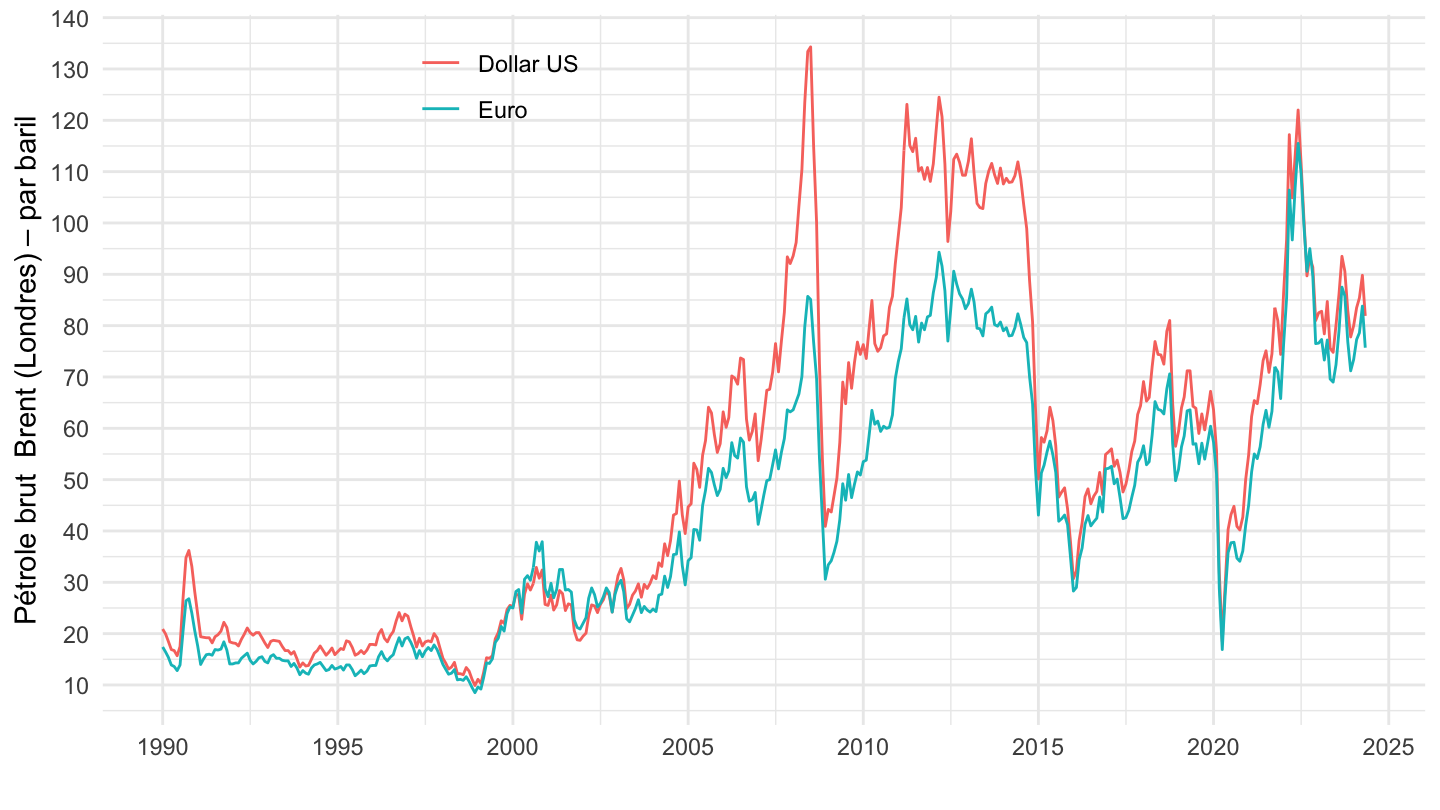
`IPPMP-NF` |>
  filter(INDICATEUR == "CIMP",
         MATIERES_PREMIERES == "41") |>


  month_to_date() |>
  ggplot() + theme_minimal() + xlab("") + ylab("Pétrole brut  Brent (Londres) – par baril") +
  geom_line(aes(x = date, y = OBS_VALUE, color = Monnaie)) +
  scale_x_date(breaks = seq(1990, 2100, 5) |> paste0("-01-01") |> as.Date(),
               labels = date_format("%Y")) +
  scale_y_log10(breaks = seq(0, 200, 10)) +
  theme(legend.position = c(0.3, 0.9),
        legend.title = element_blank())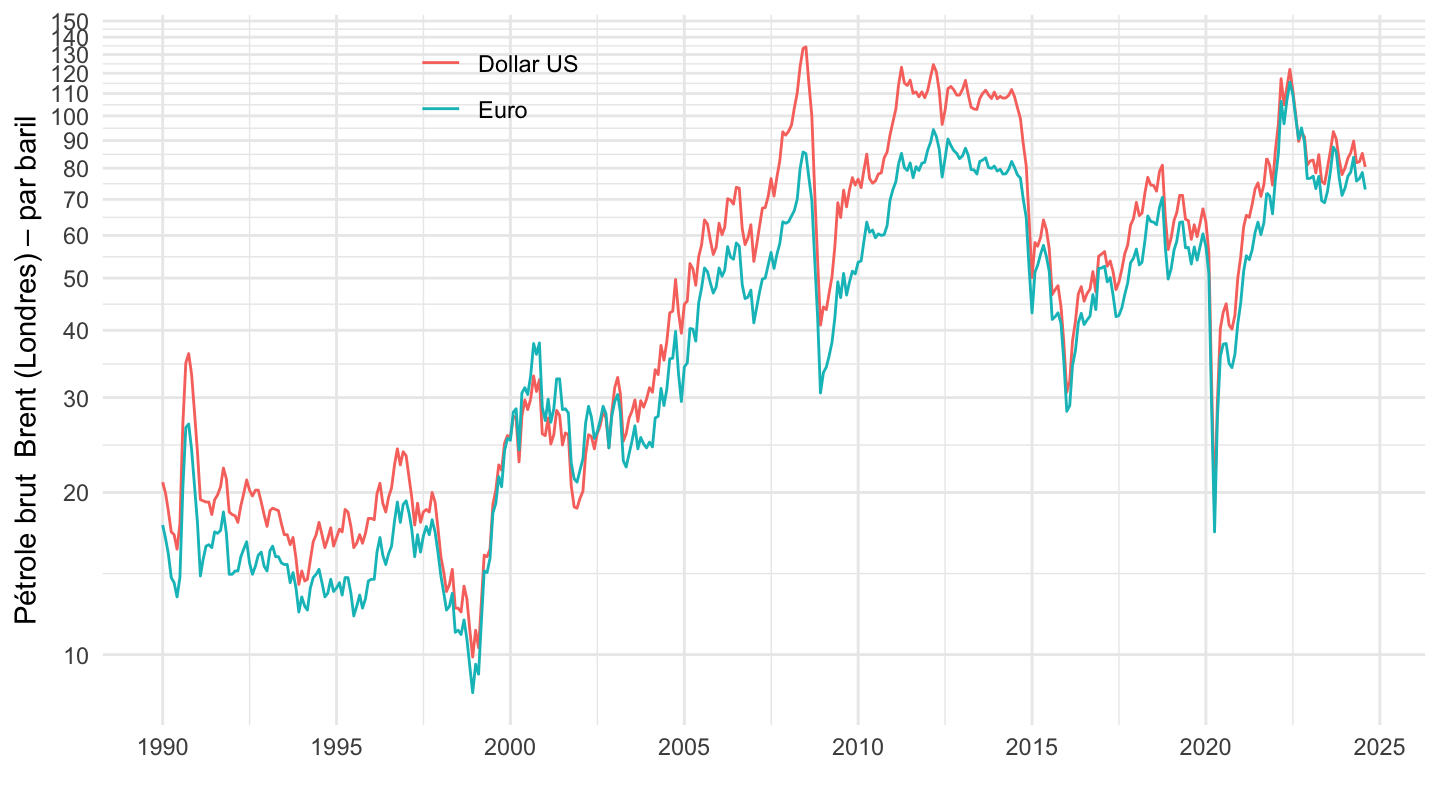
`IPPMP-NF` |>
  filter(INDICATEUR == "CIMP",
         MATIERES_PREMIERES == "41") |>


  month_to_date() |>
  filter(date >= as.Date("2004-01-01")) |>
  ggplot() + theme_minimal() + xlab("") + ylab("Pétrole brut  Brent (Londres) – par baril") +
  geom_line(aes(x = date, y = OBS_VALUE, color = Monnaie)) +
  scale_x_date(breaks = seq(1990, 2100, 2) |> paste0("-01-01") |> as.Date(),
               labels = date_format("%Y")) +
  scale_y_log10(breaks = seq(0, 200, 10)) +
  theme(legend.position = c(0.3, 0.2),
        legend.title = element_blank())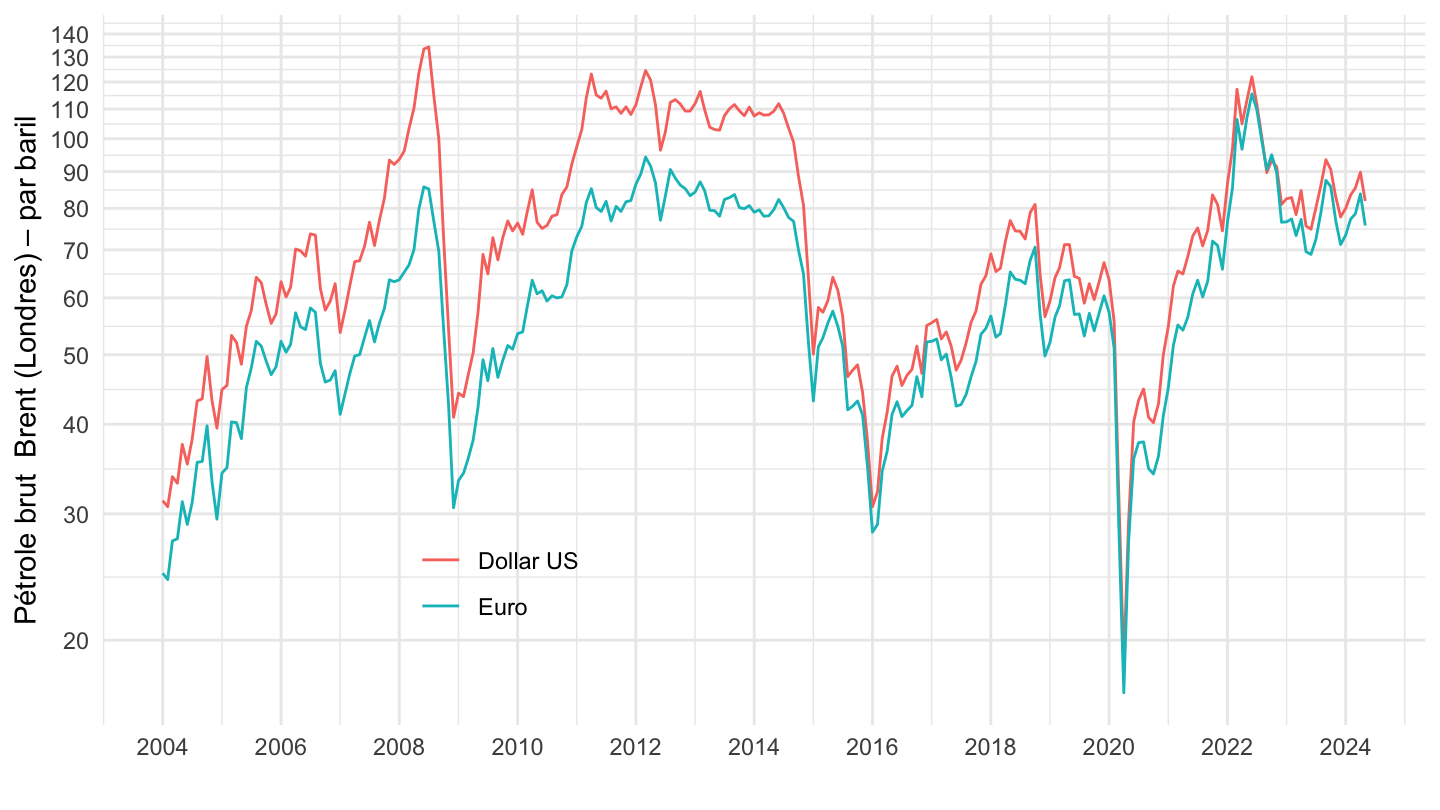
`IPPMP-NF` |>
  filter(INDICATEUR == "CIMP",
         MATIERES_PREMIERES == "41") |>


  month_to_date() |>
  filter(date >= as.Date("2004-01-01")) |>
  ggplot() + theme_minimal() + xlab("") + ylab("Pétrole brut  Brent (Londres) – par baril") +
  geom_line(aes(x = date, y = OBS_VALUE, color = Monnaie)) +
  scale_x_date(breaks = seq(1990, 2100, 1) |> paste0("-01-01") |> as.Date(),
               labels = date_format("%Y")) +
  scale_y_log10(breaks = seq(0, 200, 10)) +
  theme(legend.position = c(0.3, 0.2),
        legend.title = element_blank(),
        axis.text.x = element_text(angle = 45, vjust = 1, hjust = 1))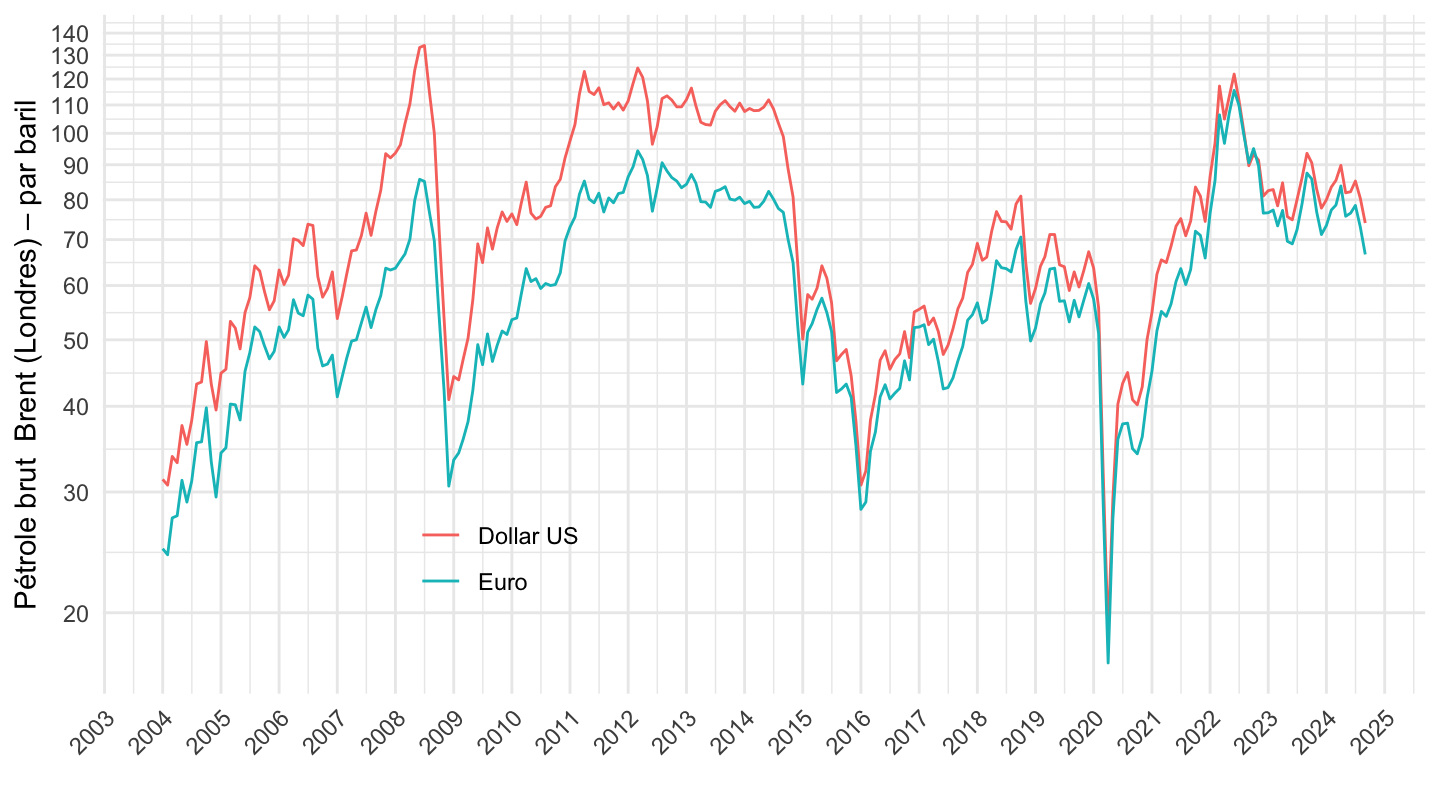
`IPPMP-NF` |>
  filter(INDICATEUR == "CIMP",
         MATIERES_PREMIERES == "41") |>


  month_to_date() |>
  filter(date >= Sys.Date() - years(2)) |>
  ggplot() + theme_minimal() + xlab("") + ylab("Pétrole brut  Brent (Londres) – par baril") +
  geom_line(aes(x = date, y = OBS_VALUE, color = Monnaie)) +
  scale_x_date(breaks = "2 months",
               labels = date_format("%b %Y")) +
  scale_y_log10(breaks = seq(0, 200, 10)) +
  theme(
    legend.position = "inside",
    legend.position.inside = c(.25, .8),
        legend.title = element_blank(),
        axis.text.x = element_text(angle = 45, vjust = 1, hjust = 1)) +
  geom_text(aes(x = date, y = OBS_VALUE, label = round(OBS_VALUE, 1), color = Monnaie),
                  fontface ="plain", size = 3)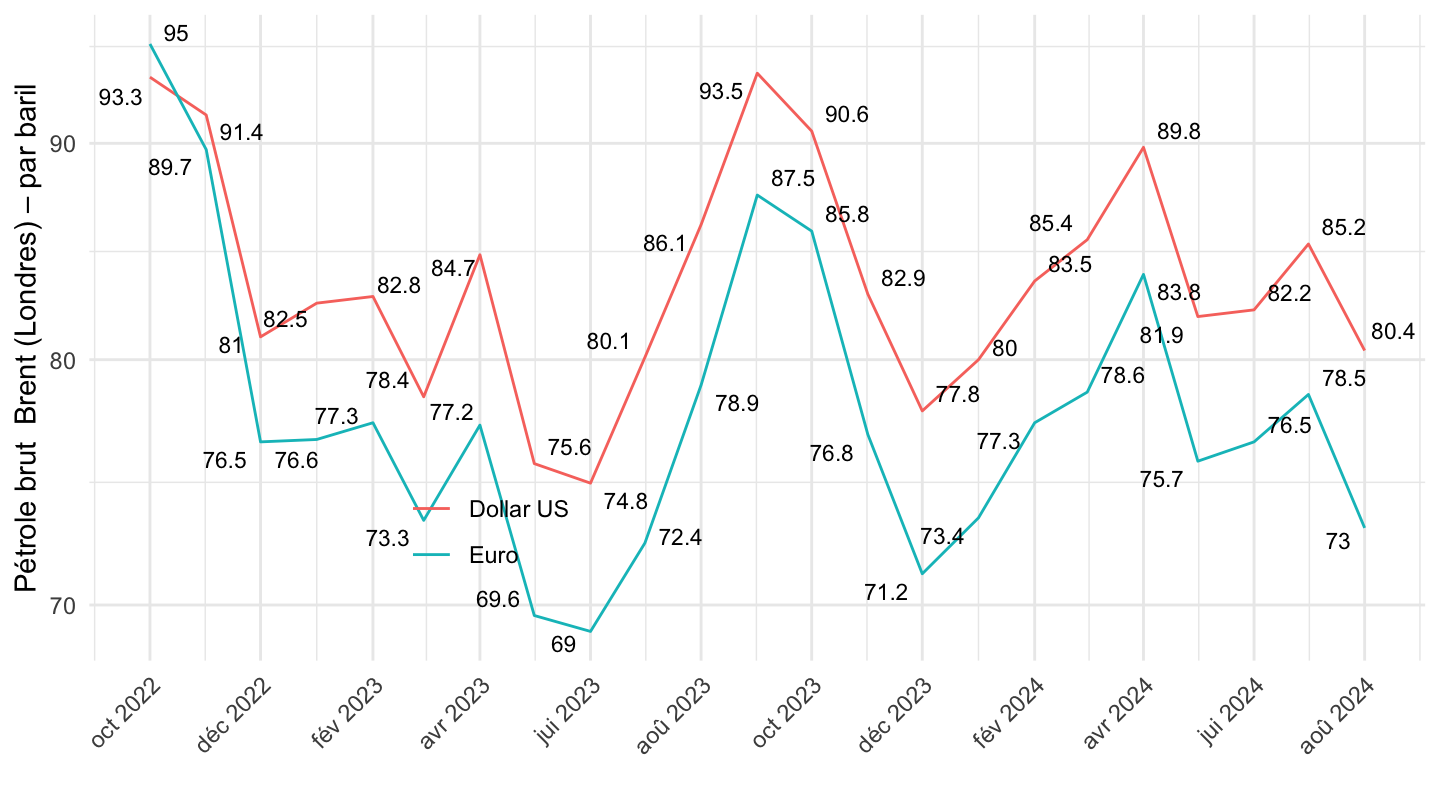
| source | dataset | Title | Updated |
|---|---|---|---|

