| source | dataset | Title | .html | .rData |
|---|---|---|---|---|
| insee | econ-gen-solde-ech-ext-2 | Solde des échanges extérieurs et principales composantes | 2026-07-23 | 2025-05-24 |
Solde des échanges extérieurs et principales composantes
Données - INSEE
Info
Données sur l’énergie
| source | dataset | Title | .html | .rData |
|---|---|---|---|---|
| cre | TRV_electricite | TRV électricité | 2024-10-27 | 2025-06-22 |
| cre | TRV_gaz | TRV gaz | 2024-10-07 | 2021-09-05 |
| insee | IPPMP-NF | Indices de prix et cours des matières premières | 2026-07-23 | 2026-07-23 |
| insee | econ-gen-solde-ech-ext-2 | Solde des échanges extérieurs et principales composantes | 2026-07-23 | 2025-05-24 |
| insee | t_5404 | 5.404 – Importations de biens et de services par produit à prix courants (En milliards d'euros) | 2026-07-23 | 2021-08-01 |
| sdes | bilan_energetique | Bilan énergétique | 2026-07-18 | 2025-06-26 |
Info
variable
Code
`econ-gen-solde-ech-ext-2` %>%
  left_join(`econ-gen-solde-ech-ext-2_var`, by = "variable") %>%
  group_by(variable, Variable) %>%
  summarise(Nobs = n()) %>%
  arrange(-Nobs) %>%
{if (is_html_output()) print_table(.) else .}| variable | Variable | Nobs |
|---|---|---|
| ALIM | Biens alimentaires | 75 |
| AUTR | Autres biens industriels | 75 |
| ENER | Energie | 75 |
| MATE | Matériels de transport | 75 |
| SERV | Services | 75 |
| SOLD | Solde du commerce extérieur | 75 |
date
Code
`econ-gen-solde-ech-ext-2` %>%
  group_by(year) %>%
  summarise(Nobs = n()) %>%
  arrange(-Nobs) %>%
  arrange(desc(year)) %>%
  {if (is_html_output()) datatable(., filter = 'top', rownames = F) else .}
Biens, Services, Biens et Services
All
Code
`econ-gen-solde-ech-ext-2` %>%
  year_to_date2 %>%
  left_join(gdp, by = "date") %>%
  mutate(value = value/gdp) %>%
  select(-gdp) %>%
  spread(variable, value) %>%
  transmute(date,
            Biens = ALIM + AUTR + ENER + MATE,
         Services = SERV,
         `Biens et Services` = SOLD) %>%
  gather(variable, value, -date) %>%
  ggplot(.) + theme_minimal() +
  geom_line(aes(x = date, y = value, color = variable)) +
  theme(legend.title = element_blank(),
        legend.position = c(0.2, 0.2)) +
  scale_x_date(breaks = seq(1950, 2100, 10) %>% paste0("-01-01") %>% as.Date,
               labels = date_format("%Y")) +
  scale_y_continuous(breaks = 0.01*seq(-7, 16, 1),
                     labels = scales::percent_format(accuracy = 1)) +
  xlab("") + ylab("% du PIB") +
  geom_hline(yintercept = 0, linetype = "dashed")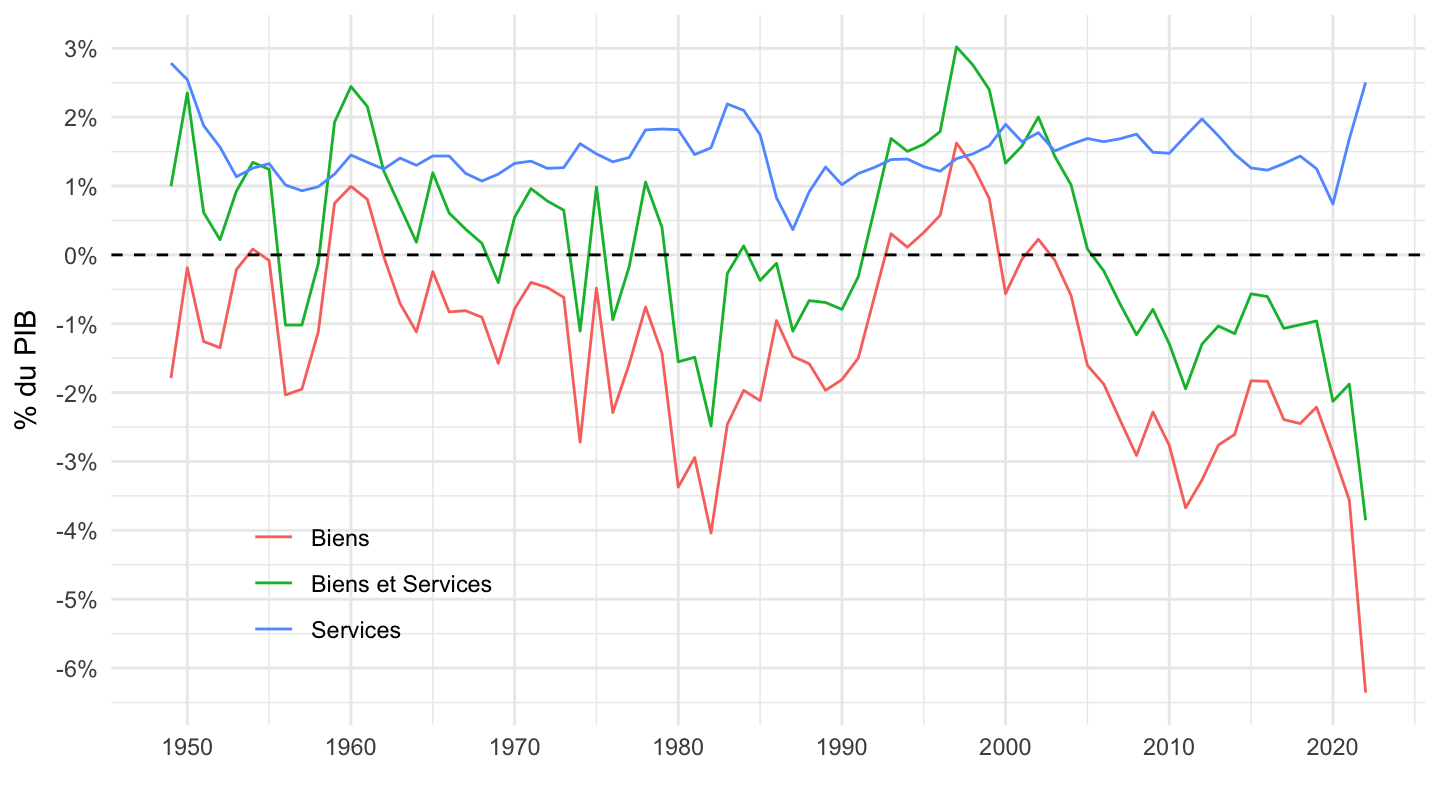
1975-
Code
`econ-gen-solde-ech-ext-2` %>%
  year_to_date2 %>%
  left_join(gdp, by = "date") %>%
  mutate(value = value/gdp) %>%
  select(-gdp) %>%
  spread(variable, value) %>%
  transmute(date,
            `Biens` = ALIM + AUTR + ENER + MATE,
         `Services` = SERV,
         `Biens et Services` = SOLD) %>%
  gather(variable, value, -date) %>%
  filter(date >= as.Date("1955-01-01")) %>%
  ggplot(.) + theme_minimal() +
  geom_line(aes(x = date, y = value, color = variable)) +
  theme(legend.title = element_blank(),
        legend.position = "none") +
  scale_x_date(breaks = seq(1950, 2100, 5) %>% paste0("-01-01") %>% as.Date,
               labels = date_format("%Y")) +
  scale_y_continuous(breaks = 0.01*seq(-7, 16, 1),
                     labels = scales::percent_format(accuracy = 1)) +
  xlab("") + ylab("Solde des échanges extérieurs (% du PIB)") +
  geom_hline(yintercept = 0, linetype = "dashed") +
  geom_label_repel(data = . %>% filter(date == max(date)), aes(x = date, y = value, label = variable, color = variable))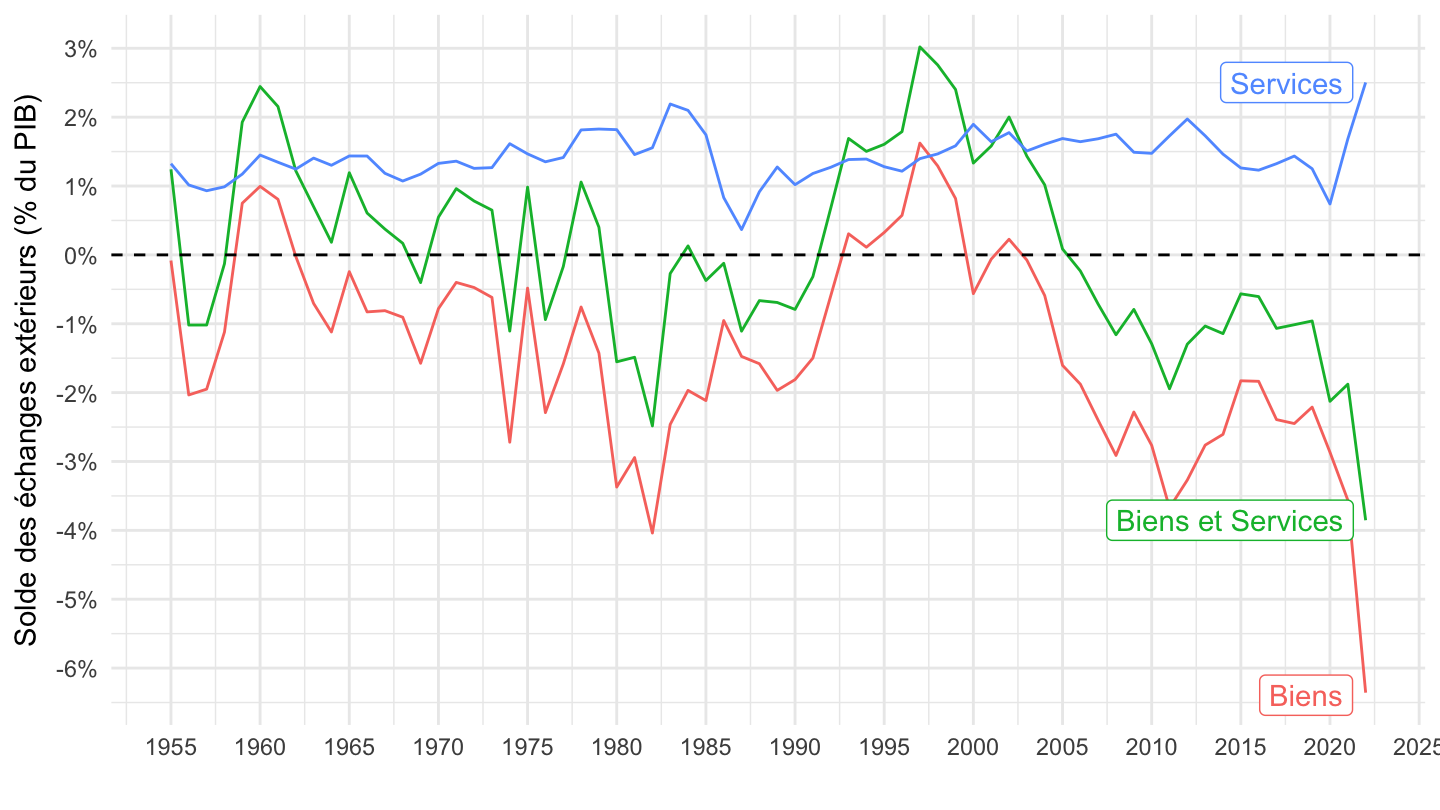
1975-
Code
`econ-gen-solde-ech-ext-2` %>%
  year_to_date2 %>%
  left_join(gdp, by = "date") %>%
  mutate(value = value/gdp) %>%
  select(-gdp) %>%
  spread(variable, value) %>%
  transmute(date,
            `Biens` = ALIM + AUTR + ENER + MATE,
         `Services` = SERV,
         `Biens et Services` = SOLD) %>%
  gather(variable, value, -date) %>%
  filter(date >= as.Date("1975-01-01")) %>%
  ggplot(.) + theme_minimal() +
  geom_line(aes(x = date, y = value, color = variable)) +
  theme(legend.title = element_blank(),
        legend.position = "none") +
  scale_x_date(breaks = seq(1950, 2100, 5) %>% paste0("-01-01") %>% as.Date,
               labels = date_format("%Y")) +
  scale_y_continuous(breaks = 0.01*seq(-7, 16, 1),
                     labels = scales::percent_format(accuracy = 1)) +
  xlab("") + ylab("Solde des échanges extérieurs (% du PIB)") +
  geom_hline(yintercept = 0, linetype = "dashed") +
  geom_label_repel(data = . %>% filter(date == max(date)), aes(x = date, y = value, label = variable, color = variable))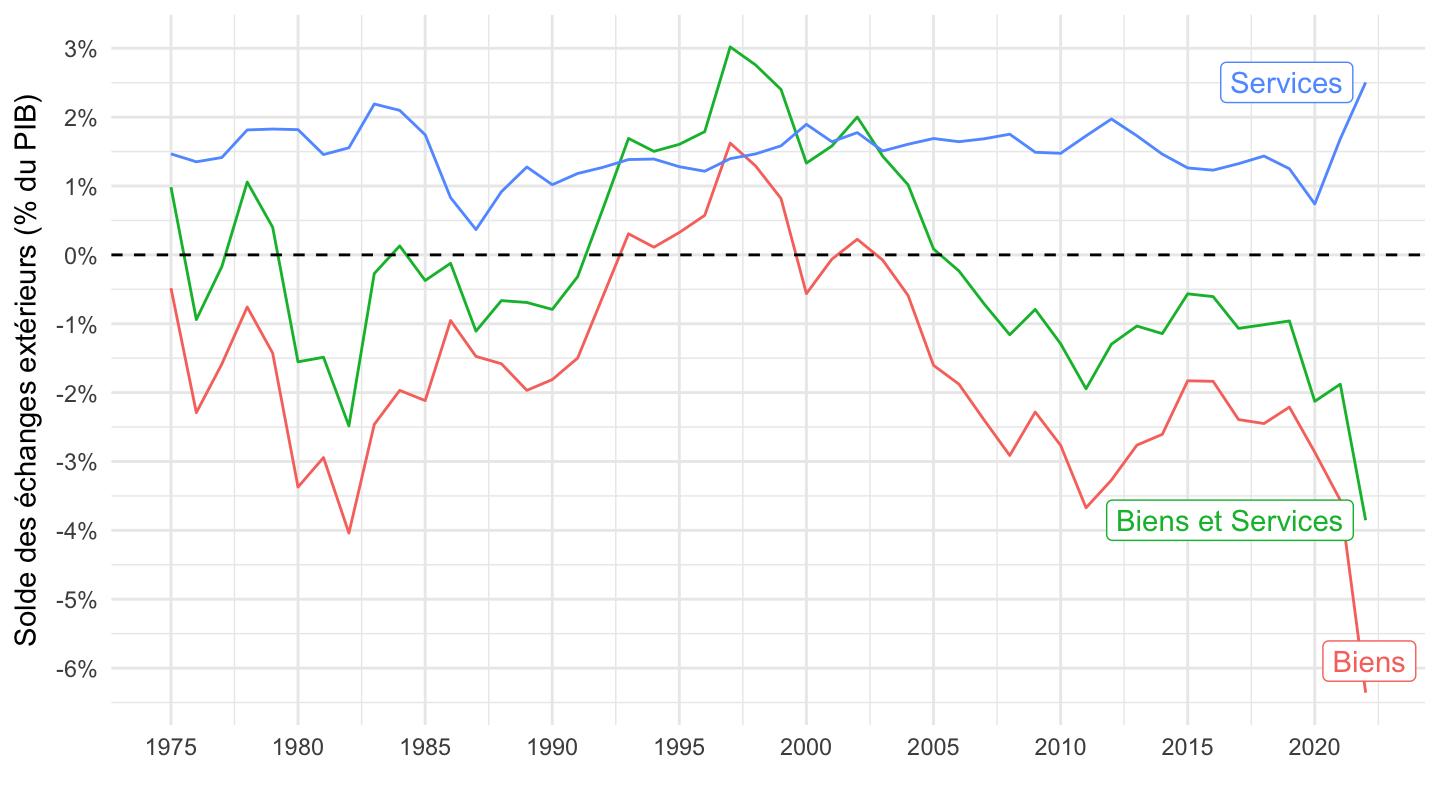
Energie, Services, Alimentation, Industrie, Transport
Code
`econ-gen-solde-ech-ext-2` %>%
  year_to_date2 %>%
  left_join(gdp, by = "date") %>%
  mutate(value = value/gdp) %>%
  filter(variable %in% c("ENER", "SERV", "AUTR", "ALIM", "MATE")) %>%
  left_join(`econ-gen-solde-ech-ext-2_var`, by = "variable") %>%
  ggplot(.) + theme_minimal() +
  geom_line(aes(x = date, y = value, color = Variable)) +
  theme(legend.title = element_blank(),
        legend.position = c(0.2, 0.2)) +
  scale_x_date(breaks = seq(1950, 2100, 5) %>% paste0("-01-01") %>% as.Date,
               labels = date_format("%Y")) +
  scale_y_continuous(breaks = 0.01*seq(-7, 16, 1),
                     labels = scales::percent_format(accuracy = 1)) +
  xlab("") + ylab("% du PIB") +
  geom_hline(yintercept = 0, linetype = "dashed")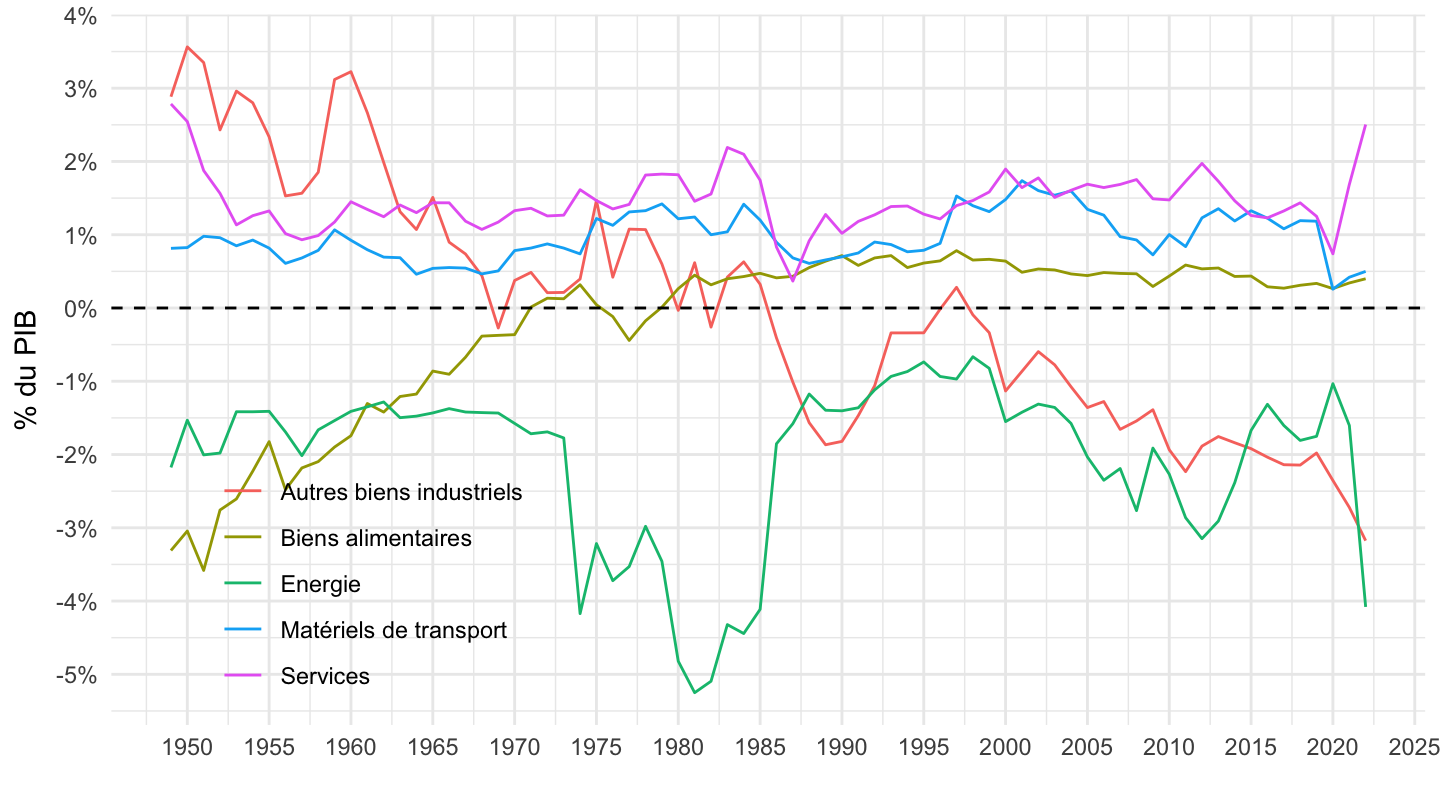
Paires & Solde Extérieur
Industrie, Energie, Solde Extérieur
Code
`econ-gen-solde-ech-ext-2` %>%
  year_to_date2 %>%
  left_join(gdp, by = "date") %>%
  mutate(value = value/gdp) %>%
  filter(variable %in% c("ENER", "SOLD", "AUTR")) %>%
  left_join(`econ-gen-solde-ech-ext-2_var`, by = "variable") %>%
  ggplot(.) + xlab("") + ylab("% du PIB") +
  theme_minimal() +
  geom_line(aes(x = date, y = value, color = Variable)) +
  theme(legend.title = element_blank(),
        legend.position = c(0.8, 0.15)) +
  scale_x_date(breaks = seq(1950, 2100, 5) %>% paste0("-01-01") %>% as.Date,
               labels = date_format("%Y")) +
  scale_y_continuous(breaks = 0.01*seq(-7, 16, 1),
                     labels = scales::percent_format(accuracy = 1)) +
  geom_hline(yintercept = 0, linetype = "dashed")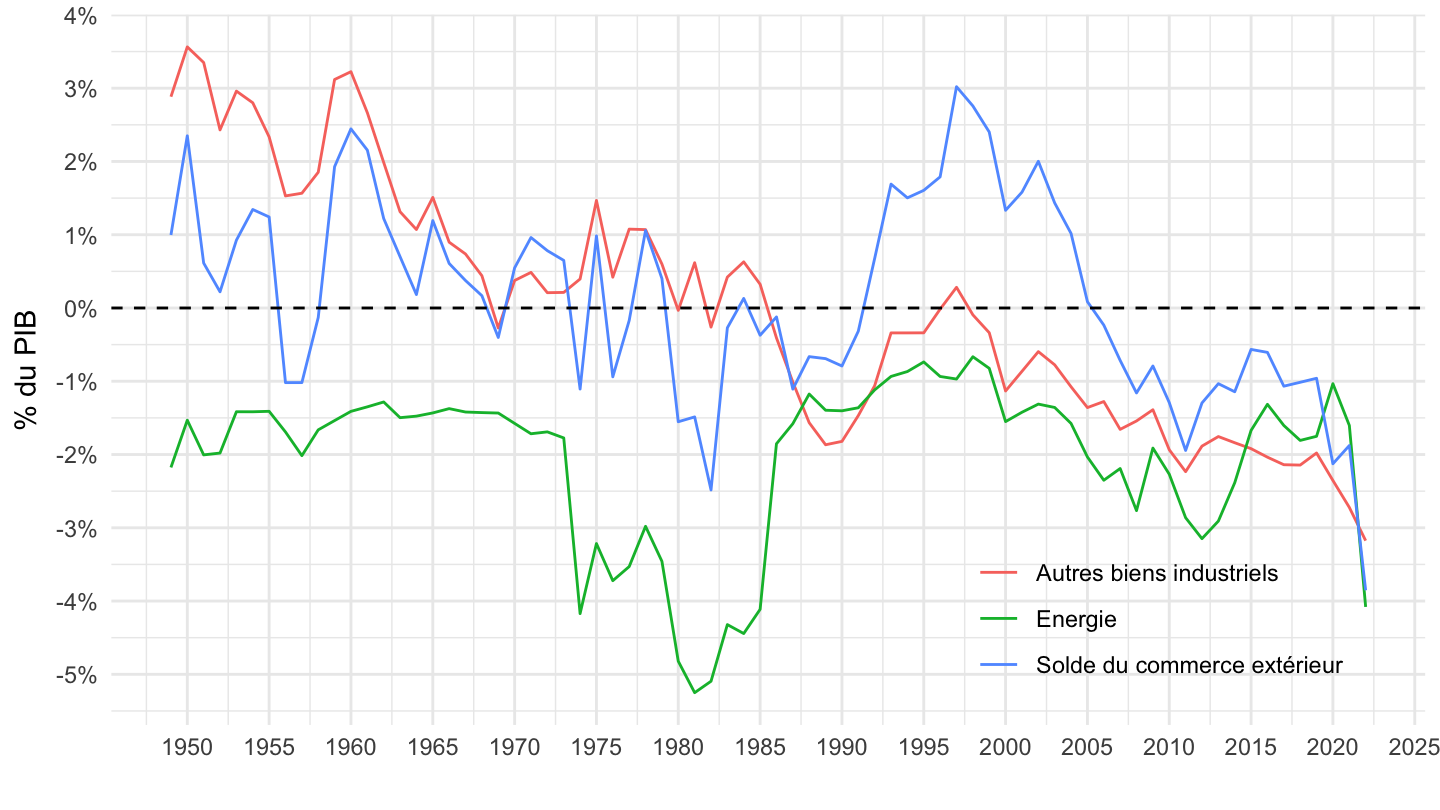
Alimentation, Transport, Solde Extérieur
Code
`econ-gen-solde-ech-ext-2` %>%
  year_to_date2 %>%
  left_join(gdp, by = "date") %>%
  mutate(value = value/gdp) %>%
  filter(variable %in% c("ALIM", "MATE", "SOLD")) %>%
  left_join(`econ-gen-solde-ech-ext-2_var`, by = "variable") %>%
  ggplot(.) + theme_minimal() +
  geom_line(aes(x = date, y = value, color = Variable)) +
  theme(legend.title = element_blank(),
        legend.position = c(0.8, 0.15)) +
  scale_x_date(breaks = seq(1950, 2100, 5) %>% paste0("-01-01") %>% as.Date,
               labels = date_format("%Y")) +
  scale_y_continuous(breaks = 0.01*seq(-7, 16, 1),
                     labels = scales::percent_format(accuracy = 1)) +
  xlab("") + ylab("% du PIB") +
  geom_hline(yintercept = 0, linetype = "dashed")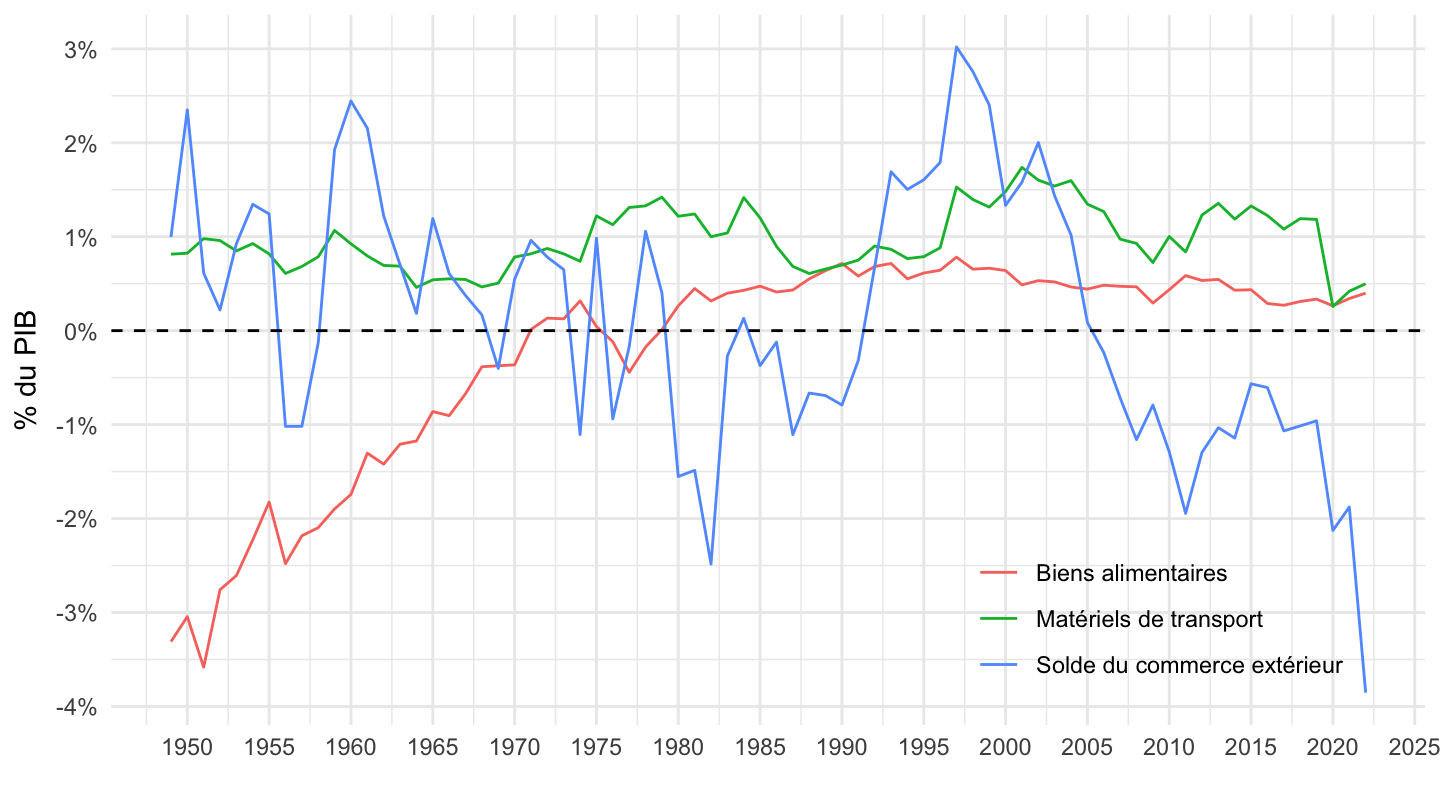
Individu & Solde Extérieur
Services, Solde Extérieur
Code
`econ-gen-solde-ech-ext-2` %>%
  year_to_date2 %>%
  left_join(gdp, by = "date") %>%
  mutate(value = value/gdp) %>%
  filter(variable %in% c("SERV", "SOLD")) %>%
  left_join(`econ-gen-solde-ech-ext-2_var`, by = "variable") %>%
  ggplot(.) + theme_minimal() +
  geom_line(aes(x = date, y = value, color = Variable)) +
  theme(legend.title = element_blank(),
        legend.position = c(0.2, 0.2)) +
  scale_x_date(breaks = seq(1950, 2100, 5) %>% paste0("-01-01") %>% as.Date,
               labels = date_format("%Y")) +
  scale_y_continuous(breaks = 0.01*seq(-7, 16, 1),
                     labels = scales::percent_format(accuracy = 1)) +
  xlab("") + ylab("% du PIB") +
  geom_hline(yintercept = 0, linetype = "dashed")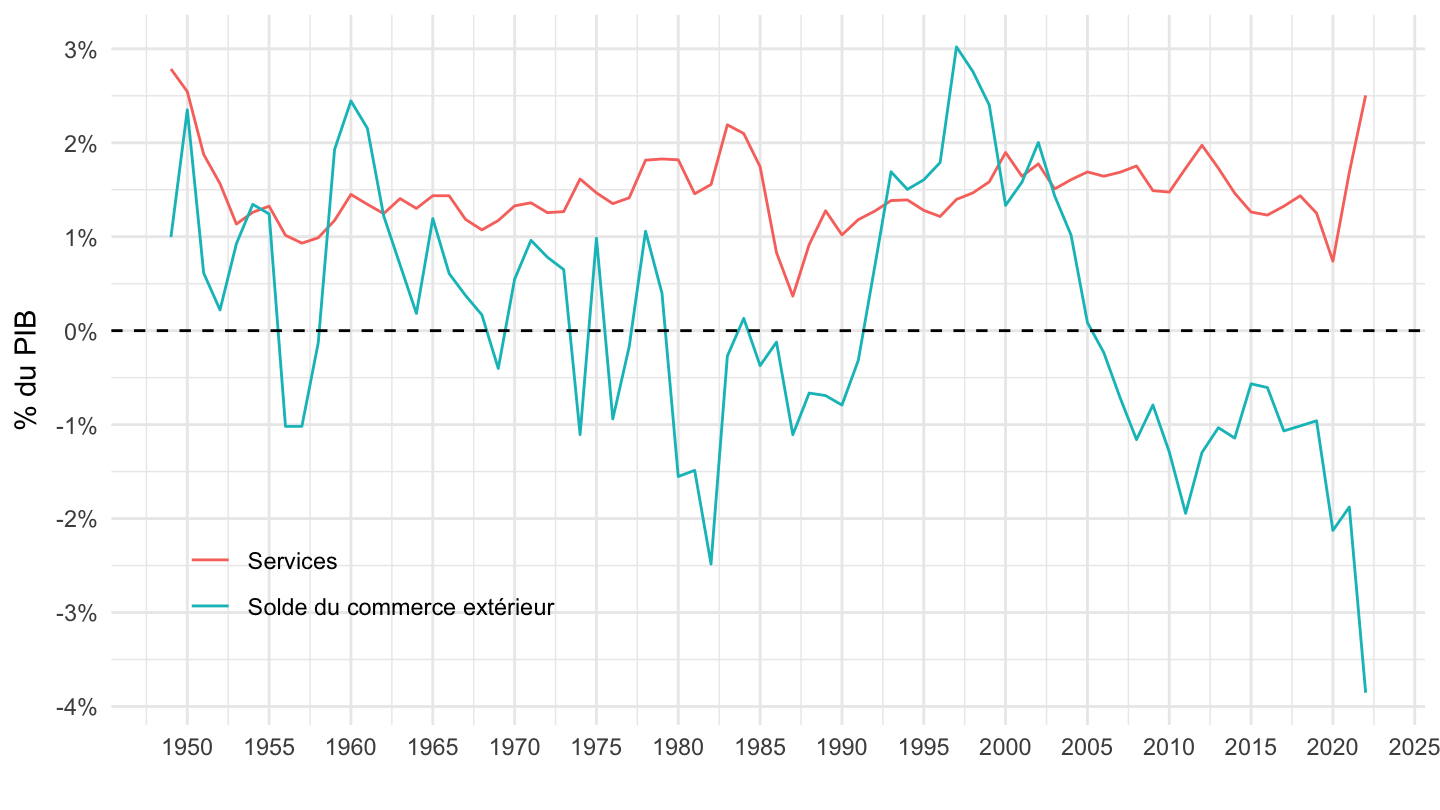
Alimentation, Solde Extérieur
Code
`econ-gen-solde-ech-ext-2` %>%
  year_to_date2 %>%
  left_join(gdp, by = "date") %>%
  mutate(value = value/gdp) %>%
  filter(variable %in% c("ALIM", "SOLD")) %>%
  left_join(`econ-gen-solde-ech-ext-2_var`, by = "variable") %>%
  ggplot(.) + theme_minimal() +
  geom_line(aes(x = date, y = value, color = Variable)) +
  theme(legend.title = element_blank(),
        legend.position = c(0.8, 0.15)) +
  scale_x_date(breaks = seq(1950, 2100, 5) %>% paste0("-01-01") %>% as.Date,
               labels = date_format("%Y")) +
  scale_y_continuous(breaks = 0.01*seq(-7, 16, 1),
                     labels = scales::percent_format(accuracy = 1)) +
  xlab("") + ylab("% du PIB") +
  geom_hline(yintercept = 0, linetype = "dashed")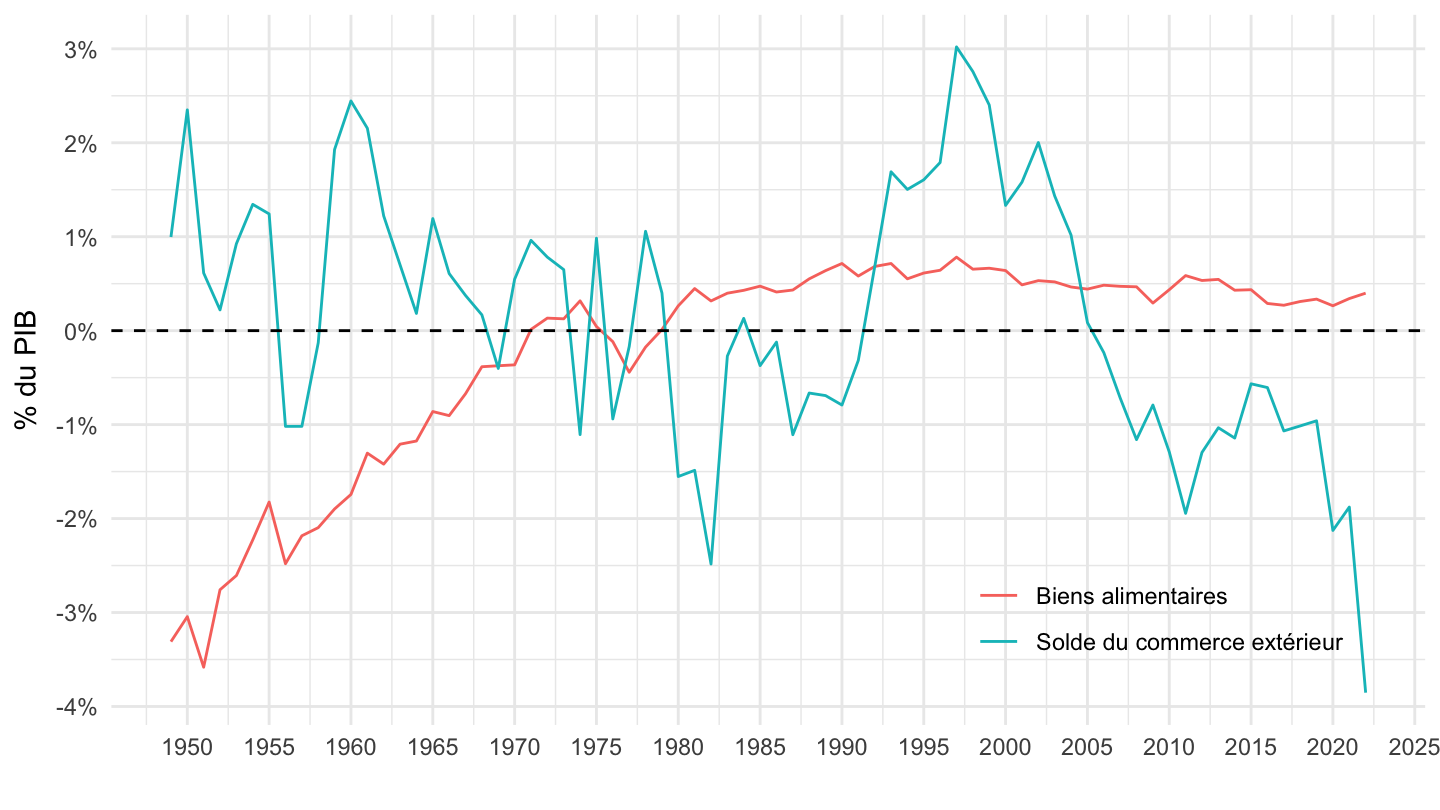
Energie, Solde Extérieur
Code
`econ-gen-solde-ech-ext-2` %>%
  year_to_date2 %>%
  left_join(gdp, by = "date") %>%
  mutate(value = value/gdp) %>%
  filter(variable %in% c("ENER", "SOLD")) %>%
  left_join(`econ-gen-solde-ech-ext-2_var`, by = "variable") %>%
  ggplot(.) + theme_minimal() +
  geom_line(aes(x = date, y = value, color = Variable)) +
  theme(legend.title = element_blank(),
        legend.position = c(0.2, 0.2)) +
  scale_x_date(breaks = seq(1950, 2100, 5) %>% paste0("-01-01") %>% as.Date,
               labels = date_format("%Y")) +
  scale_y_continuous(breaks = 0.01*seq(-7, 16, 1),
                     labels = scales::percent_format(accuracy = 1)) +
  xlab("") + ylab("% du PIB") +
  geom_hline(yintercept = 0, linetype = "dashed")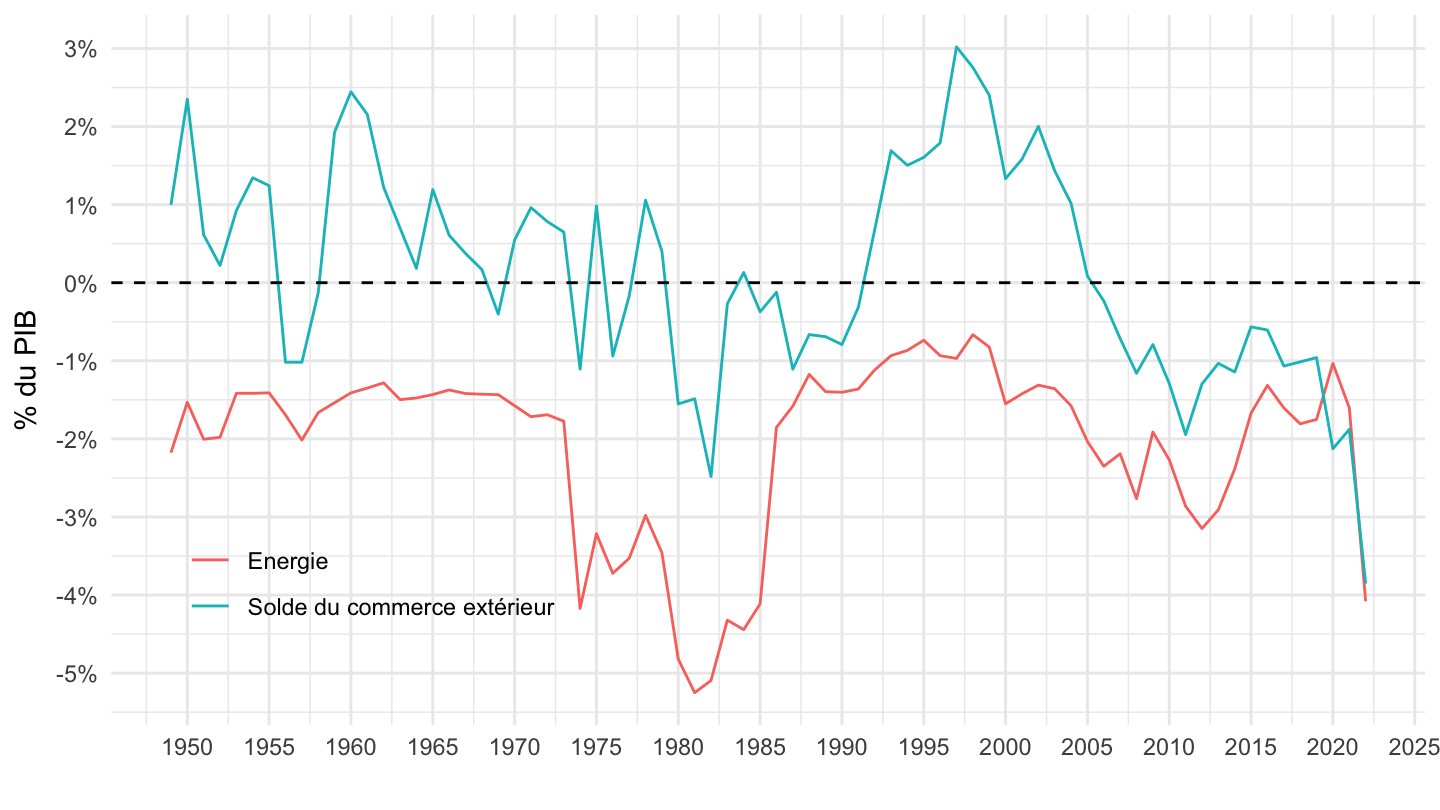
Industrie, Solde Extérieur
Code
`econ-gen-solde-ech-ext-2` %>%
  year_to_date2 %>%
  left_join(gdp, by = "date") %>%
  mutate(value = value/gdp) %>%
  filter(variable %in% c("AUTR", "SOLD")) %>%
  left_join(`econ-gen-solde-ech-ext-2_var`, by = "variable") %>%
  ggplot(.) + theme_minimal() +
  geom_line(aes(x = date, y = value, color = Variable)) +
  theme(legend.title = element_blank(),
        legend.position = c(0.2, 0.2)) +
  scale_x_date(breaks = seq(1950, 2100, 5) %>% paste0("-01-01") %>% as.Date,
               labels = date_format("%Y")) +
  scale_y_continuous(breaks = 0.01*seq(-7, 16, 1),
                     labels = scales::percent_format(accuracy = 1)) +
  xlab("") + ylab("% du PIB") +
  geom_hline(yintercept = 0, linetype = "dashed")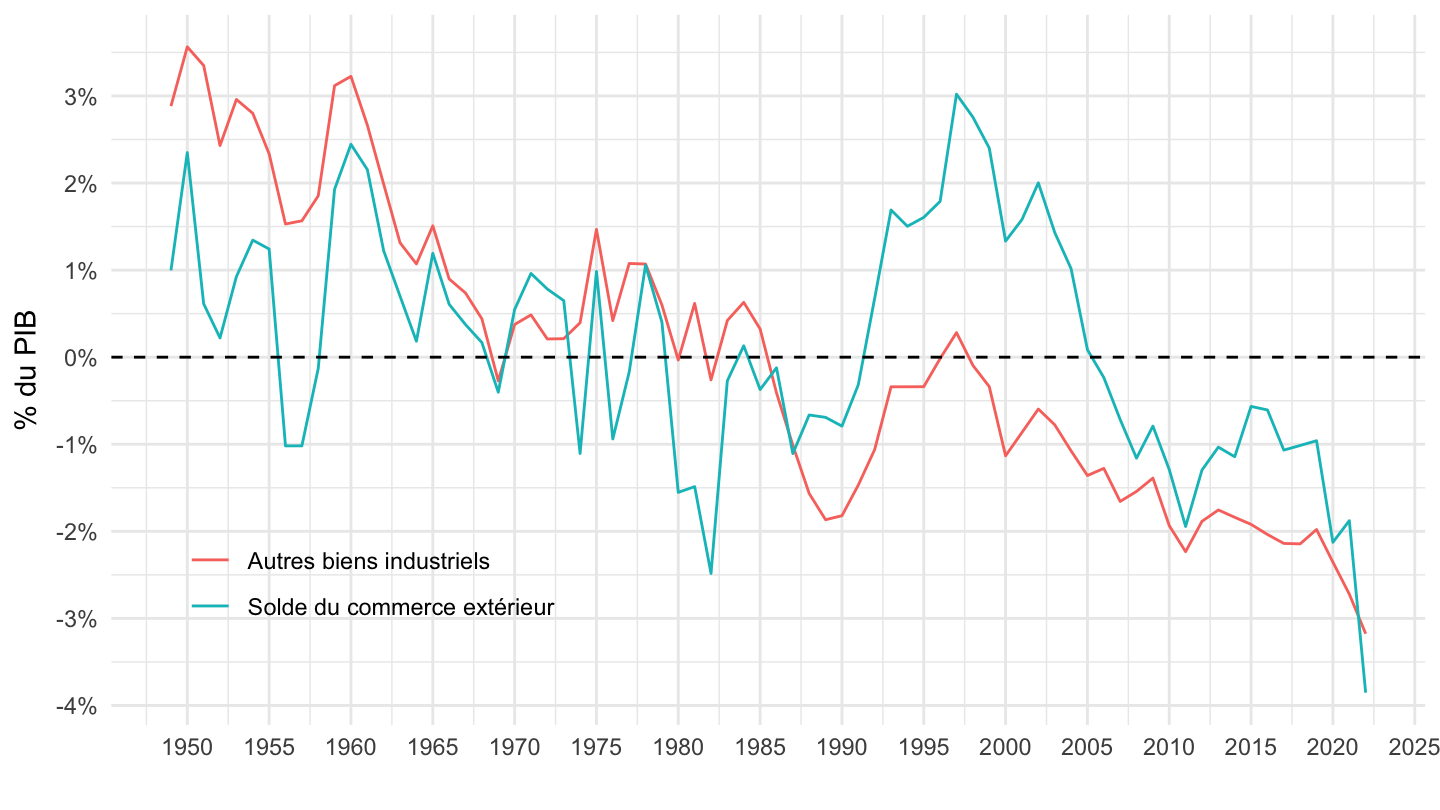
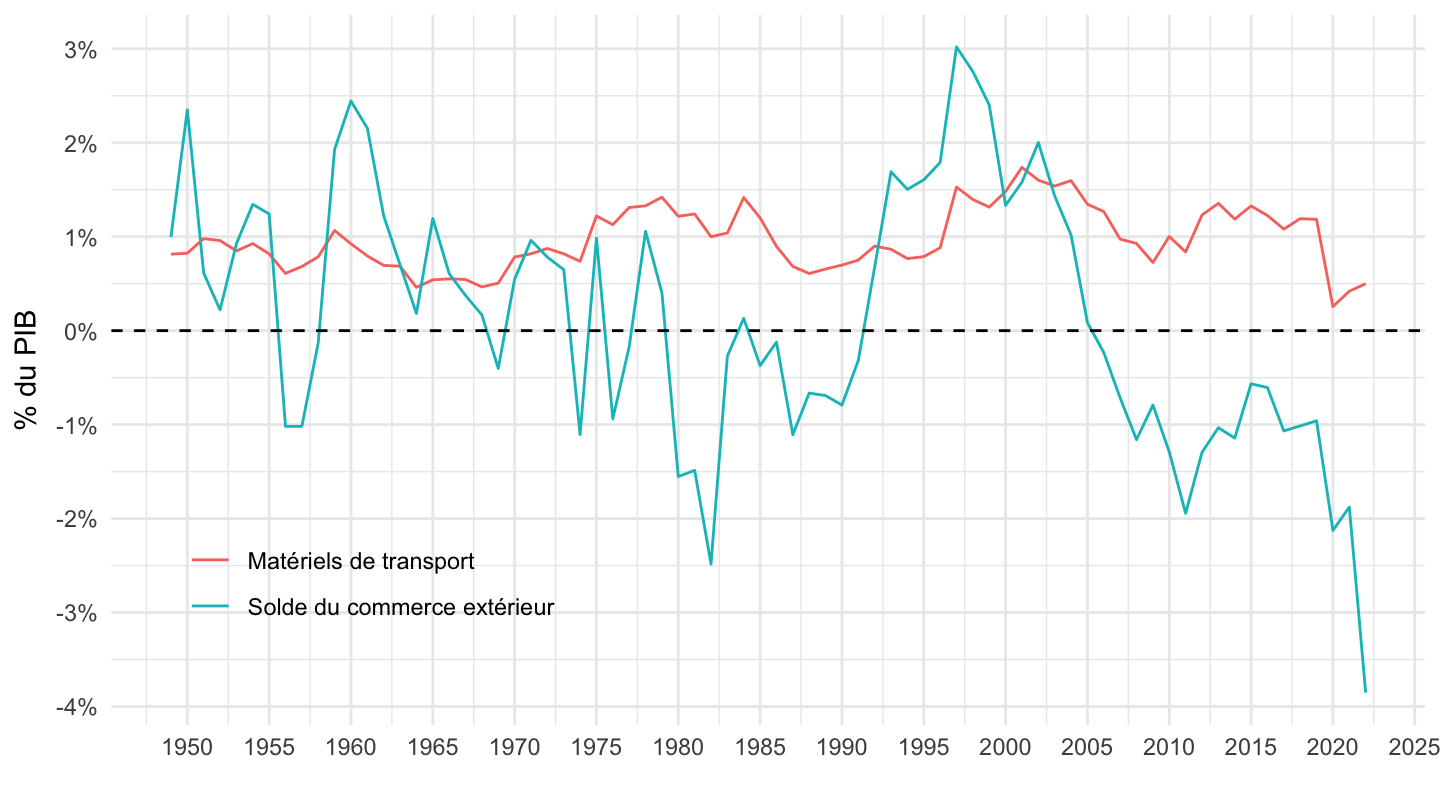
Transport, Solde Extérieur
Code
`econ-gen-solde-ech-ext-2` %>%
  year_to_date2 %>%
  left_join(gdp, by = "date") %>%
  mutate(value = value/gdp) %>%
  filter(variable %in% c("MATE", "SOLD")) %>%
  left_join(`econ-gen-solde-ech-ext-2_var`, by = "variable") %>%
  ggplot(.) + theme_minimal() +
  geom_line(aes(x = date, y = value, color = Variable)) +
  theme(legend.title = element_blank(),
        legend.position = c(0.2, 0.2)) +
  scale_x_date(breaks = seq(1950, 2100, 5) %>% paste0("-01-01") %>% as.Date,
               labels = date_format("%Y")) +
  scale_y_continuous(breaks = 0.01*seq(-7, 16, 1),
                     labels = scales::percent_format(accuracy = 1)) +
  xlab("") + ylab("% du PIB") +
  geom_hline(yintercept = 0, linetype = "dashed")