Weekly Oil Bulletin
Data - ec
Info
LAST_COMPILE
| LAST_COMPILE |
|---|
| 2026-07-24 |
Last
Code
WOB %>%
  group_by(date) %>%
  summarise(Nobs = n()) %>%
  arrange(desc(date)) %>%
  head(2) %>%
print_table_conditional()| date | Nobs |
|---|---|
| 2026-07-20 | 360 |
| 2026-07-13 | 360 |
Product Name
Code
WOB %>%
  group_by(`Product Name`, product) %>%
  summarise(Nobs = n()) %>%
  arrange(-Nobs) %>%
print_table_conditional| Product Name | product | Nobs |
|---|---|---|
| Automotive gas oil | diesel | 64560 |
| Euro-super 95 | euro95 | 64560 |
| Fuel oil - Sulphur higher than 1% | fuel_oil_2 | 64560 |
| Fuel oil - Sulphur less than 1% | fuel_oil_1 | 64560 |
| Heating gas oil | heating_oil | 64560 |
| LPG - motor fuel | LPG | 64560 |
tax
Code
WOB %>%
  group_by(tax) %>%
  summarise(Nobs = n()) %>%
  arrange(-Nobs) %>%
print_table_conditional| tax | Nobs |
|---|---|
| Prices with taxes | 193680 |
| Prices wo taxes | 193680 |
Geo
Code
WOB %>%
  group_by(geo, Geo) %>%
  summarise(Nobs = n()) %>%
  mutate(Flag = gsub(" ", "-", str_to_lower(gsub(" ", "-", Geo))),
         Flag = paste0('<img src="../../icon/flag/vsmall/', Flag, '.png" alt="Flag">')) %>%
  select(Flag, everything()) %>%
  {if (is_html_output()) datatable(., filter = 'top', rownames = F, escape = F) else .}
France, Germany, Spain, Italy
April 2020-
Index
Code
WOB %>%
  filter(`Product Name` == "Euro-super 95",
         Geo %in% c("France", "Germany", "Spain", "Italy")) %>%
  mutate(values = values/1000) %>%
  filter(date >= as.Date("2020-04-01")) %>%
  left_join(colors, by = c("Geo" = "country")) %>%
  group_by(Geo, tax) %>%
  mutate(values = 100*values/values[date == as.Date("2022-02-21")]) %>%
  ggplot() + geom_line(aes(x = date, y = values, color = color, linetype = tax)) +
  theme_minimal() + xlab("") + ylab("Euro-super 95 (100 = February 21, 2022)") + scale_color_identity() +
  scale_x_date(breaks = seq.Date(as.Date("2019-11-01"), Sys.Date(), "3 month"),
               labels = scales::date_format("%b %y")) + add_flags +
  scale_y_log10(breaks = seq(10, 300, 10)) +
  theme(legend.position = c(0.7, 0.95),
          axis.text.x = element_text(angle = 45, vjust = 1, hjust = 1),
        legend.title = element_blank())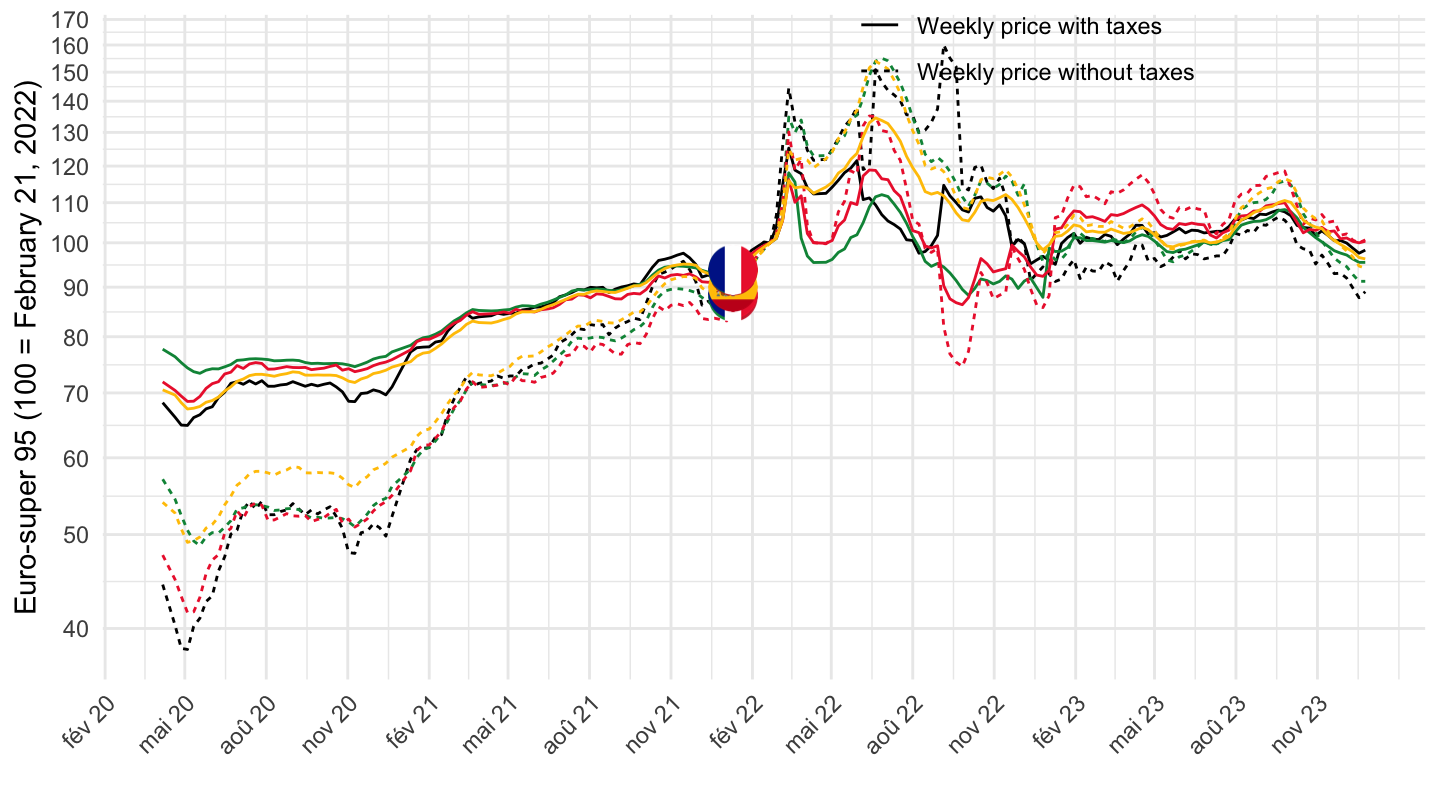
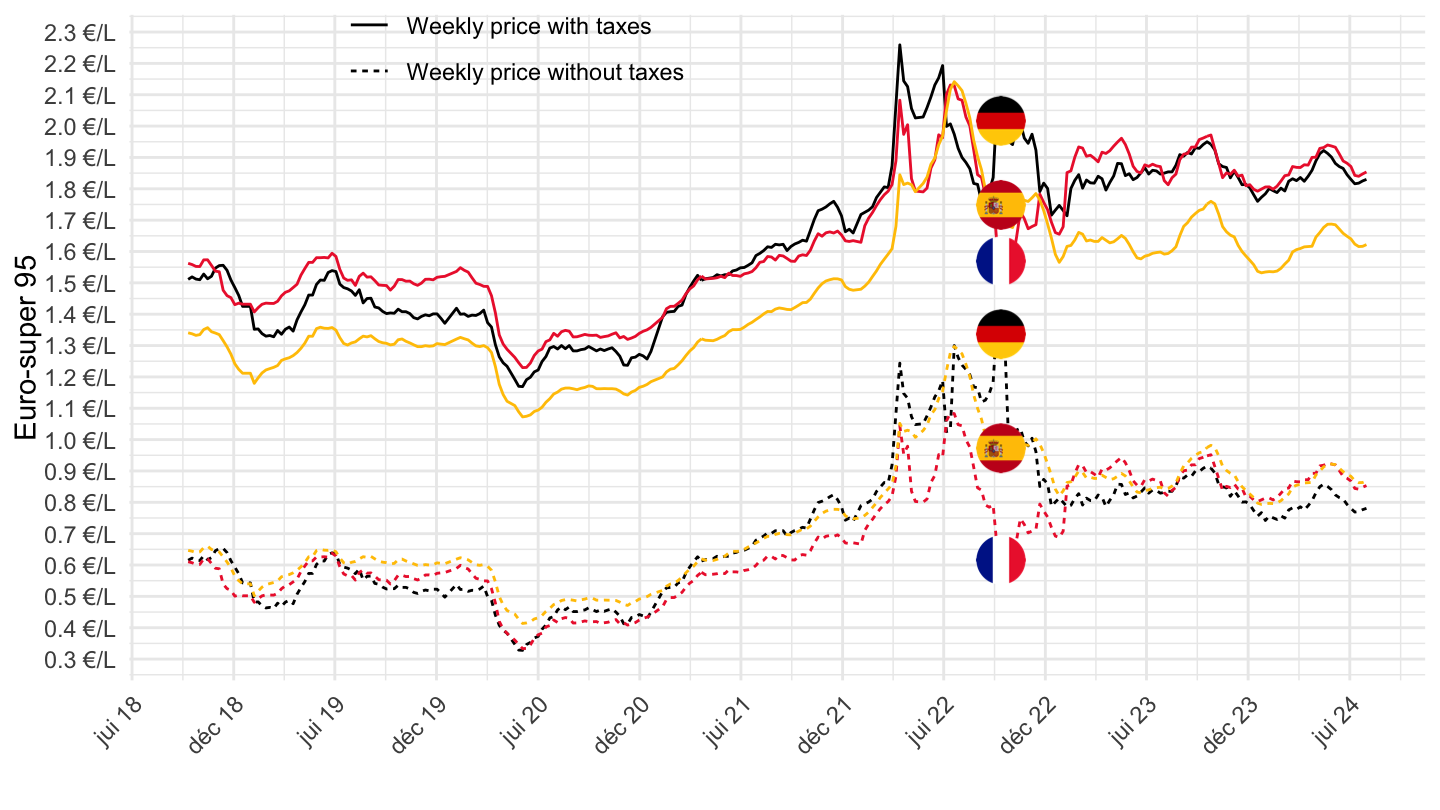
Value
Code
WOB %>%
  filter(`Product Name` == "Euro-super 95",
         Geo %in% c("France", "Germany", "Spain", "Italy")) %>%
  mutate(values = values/1000) %>%
  filter(date >= as.Date("2020-04-01")) %>%
  left_join(colors, by = c("Geo" = "country")) %>%
  ggplot() + geom_line(aes(x = date, y = values, color = color, linetype = tax)) +
  theme_minimal() + xlab("") + ylab("Euro-super 95") + scale_color_identity() +
  scale_x_date(breaks = seq.Date(as.Date("2019-11-01"), Sys.Date(), "3 month"),
               labels = scales::date_format("%b %y")) + add_flags +
  scale_y_continuous(breaks = seq(-100, 100, 0.1),
                     labels = scales::dollar_format(a = .1, pre = "", su = " €/L")) +
  theme(legend.position = c(0.3, 0.95),
          axis.text.x = element_text(angle = 45, vjust = 1, hjust = 1),
        legend.title = element_blank())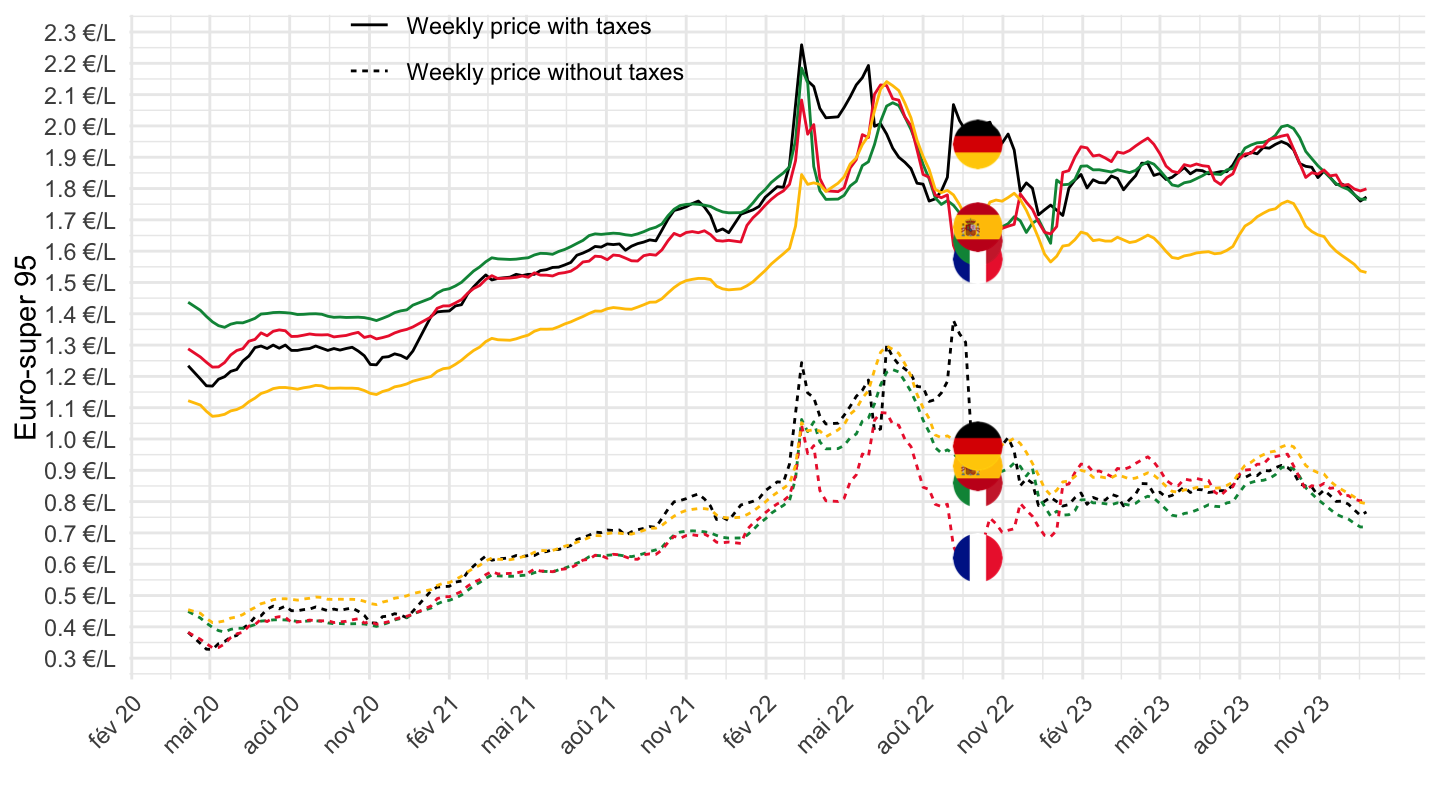
Since War in Ukraine
Index
Code
WOB %>%
  filter(`Product Name` == "Euro-super 95",
         Geo %in% c("France", "Germany", "Spain", "Italy")) %>%
  mutate(values = values/1000) %>%
  filter(date >= as.Date("2022-02-21")) %>%
  left_join(colors, by = c("Geo" = "country")) %>%
  group_by(Geo, tax) %>%
  mutate(values = 100*values/values[date == as.Date("2022-02-21")]) %>%
  ggplot() + geom_line(aes(x = date, y = values, color = color, linetype = tax)) +
  theme_minimal() + xlab("") + ylab("Euro-super 95 (100 = February 21, 2022)") + scale_color_identity() +
  scale_x_date(breaks = seq.Date(as.Date("2019-11-01"), Sys.Date(), "1 month"),
               labels = scales::date_format("%b %y")) + add_flags +
  scale_y_log10(breaks = seq(10, 300, 10)) +
  theme(legend.position = c(0.7, 0.95),
          axis.text.x = element_text(angle = 45, vjust = 1, hjust = 1),
        legend.title = element_blank())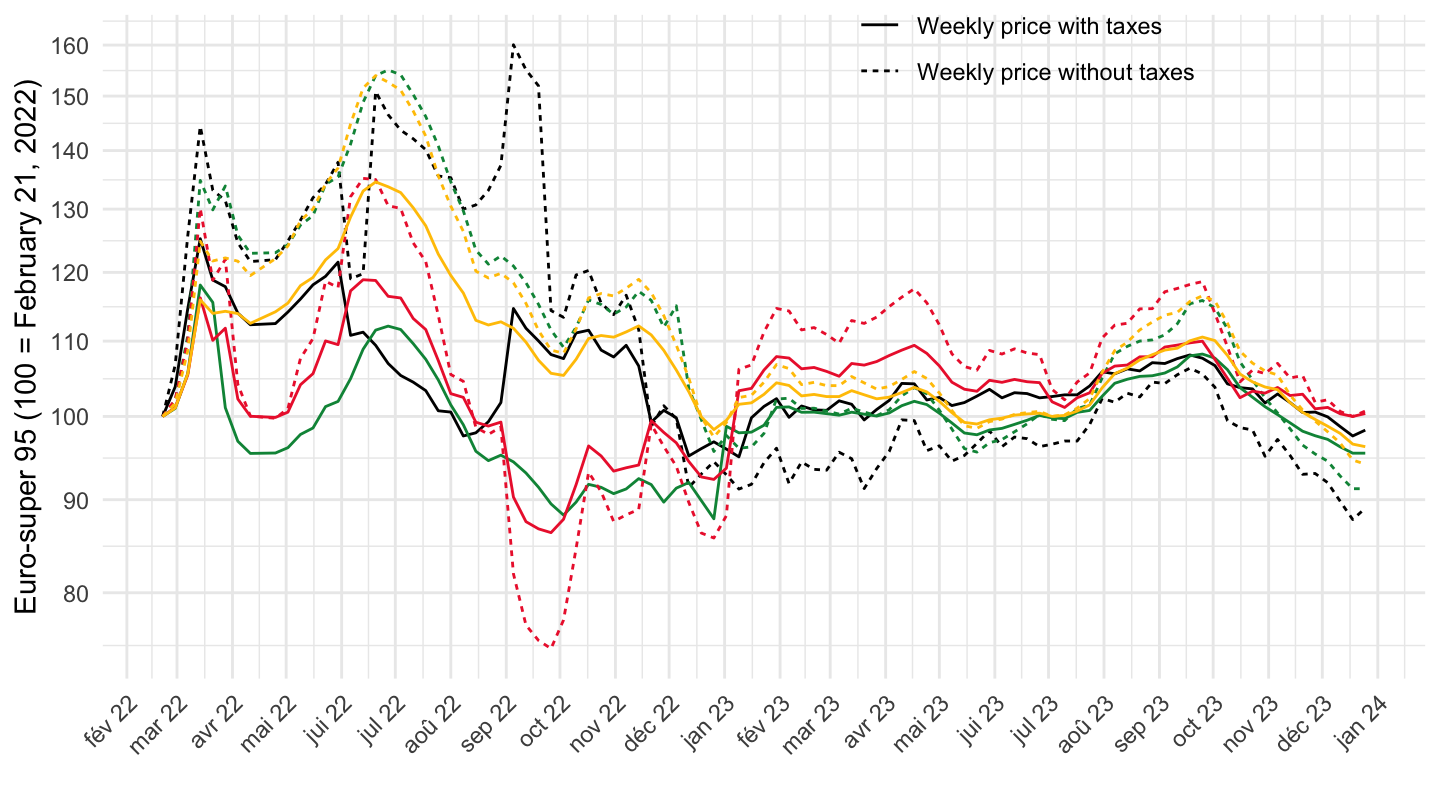
Value
Code
WOB %>%
  filter(`Product Name` == "Euro-super 95",
         Geo %in% c("France", "Germany", "Spain", "Italy")) %>%
  mutate(values = values/1000) %>%
  filter(date >= as.Date("2022-02-21")) %>%
  left_join(colors, by = c("Geo" = "country")) %>%
  ggplot() + geom_line(aes(x = date, y = values, color = color, linetype = tax)) +
  theme_minimal() + xlab("") + ylab("Euro-super 95") + scale_color_identity() +
  scale_x_date(breaks = seq.Date(as.Date("2019-11-01"), Sys.Date(), "1 month"),
               labels = scales::date_format("%b %y")) + add_flags +
  scale_y_continuous(breaks = seq(-100, 100, 0.1),
                     labels = scales::dollar_format(a = .1, pre = "", su = " €/L")) +
  theme(legend.position = c(0.7, 0.95),
          axis.text.x = element_text(angle = 45, vjust = 1, hjust = 1),
        legend.title = element_blank())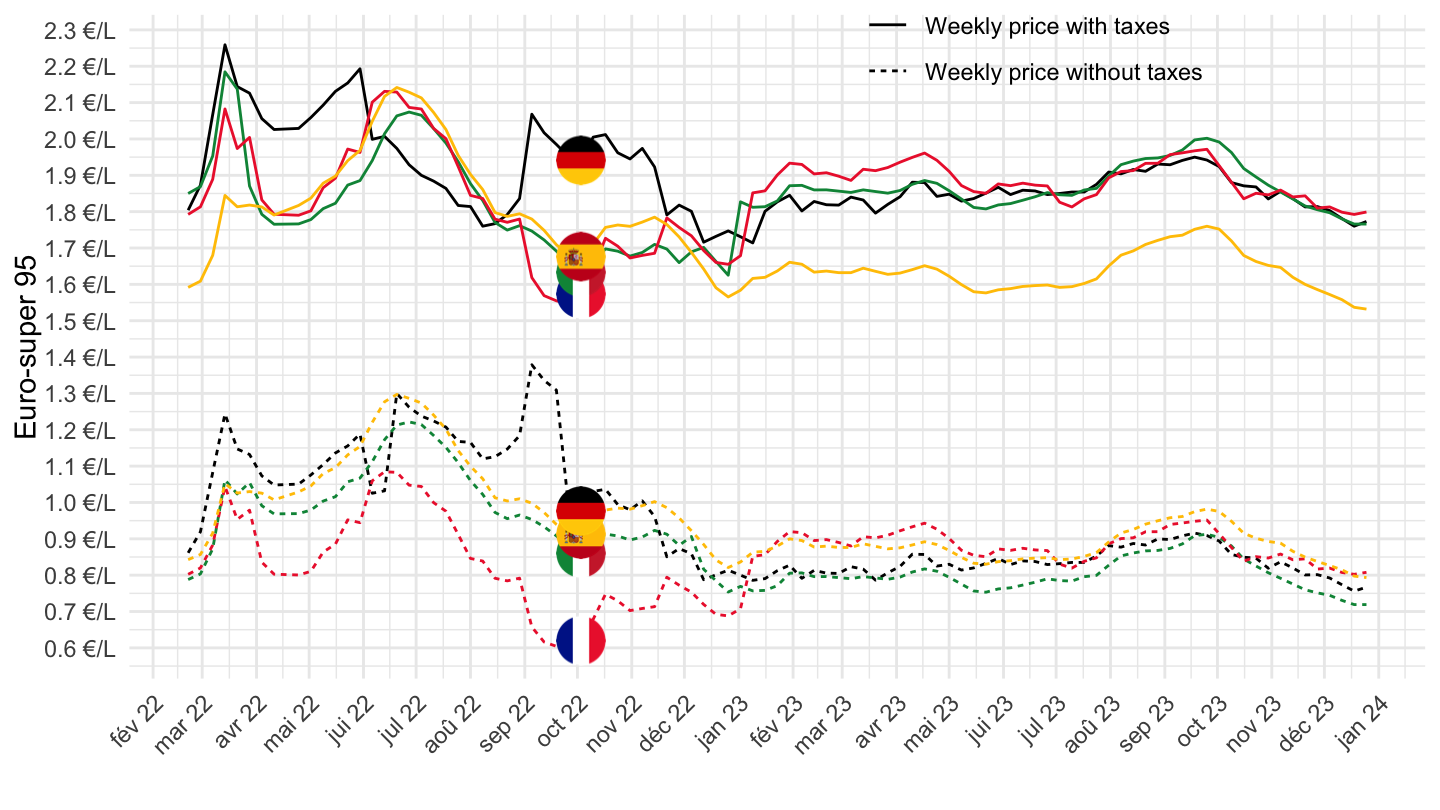
France Italy, Portugal, Spain, European Union (average)
3 months
Code
WOB %>%
  filter(`Product Name` == "Euro-super 95",
         Geo %in% c("France", "Portugal", "Spain", "Italy", "European Union (average)"),
         tax == "Prices with taxes") %>%
  mutate(Geo = ifelse(Geo == "European Union (average)", "Europe", Geo)) %>%
  mutate(values = values/1000) %>%
  filter(date >= Sys.Date() - months(6)) %>%
  left_join(colors, by = c("Geo" = "country")) %>%
  ggplot() + geom_line(aes(x = date, y = values, color = color)) +
  theme_minimal() + xlab("") + ylab("Euro-super 95, Price with taxes") + scale_color_identity() +
  scale_x_date(breaks = seq.Date(as.Date("2018-09-10"), Sys.Date(), "1 week"),
               labels = scales::date_format("%d %b %y")) + add_flags +
  scale_y_continuous(breaks = seq(-100, 100, 0.05),
                     labels = scales::dollar_format(a = .01, pre = "", su = " €/L")) +
  theme(legend.position = c(0.3, 0.95),
          axis.text.x = element_text(angle = 45, vjust = 1, hjust = 1),
        legend.title = element_blank())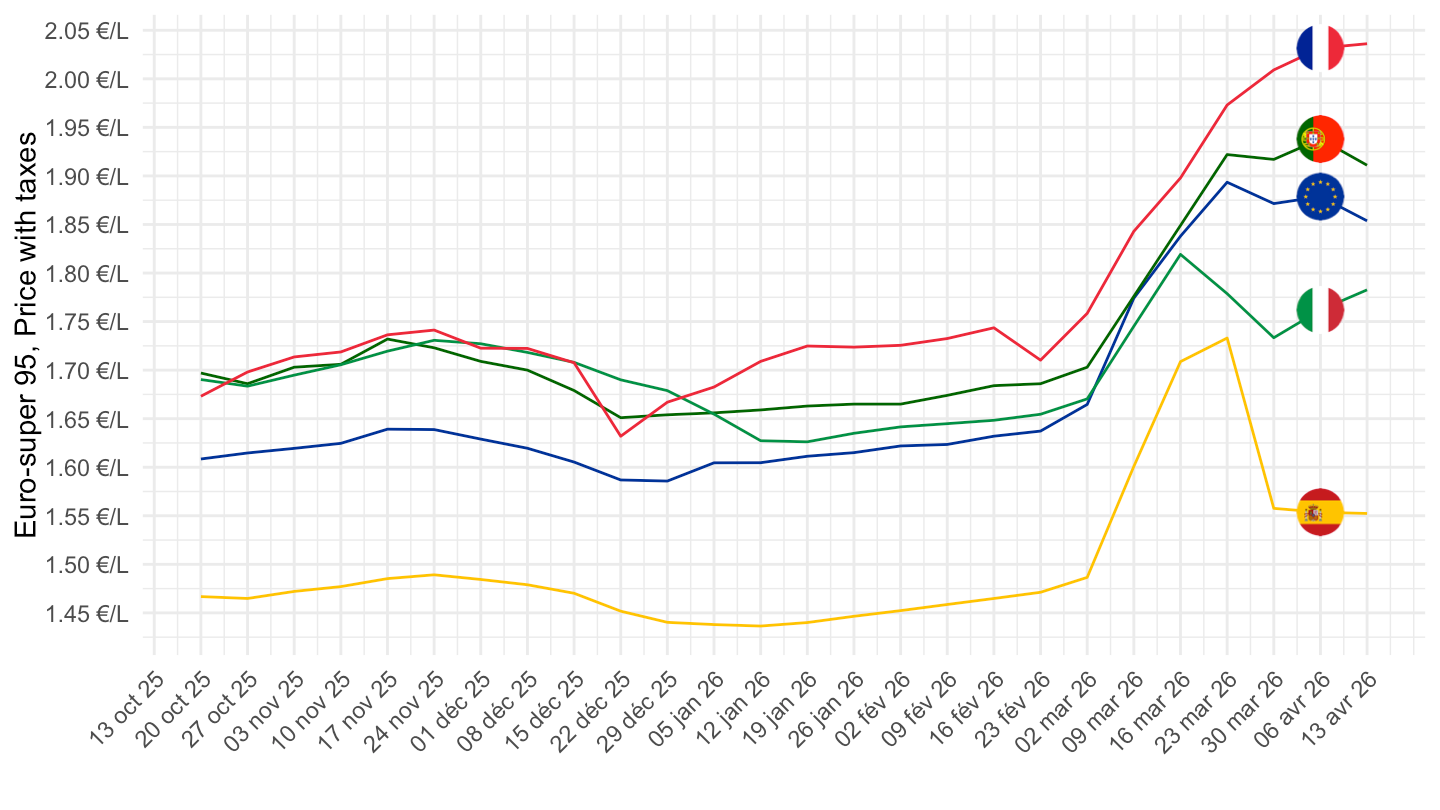
France Italy, Germany, Spain
3 months
Code
WOB %>%
  filter(`Product Name` == "Euro-super 95",
         Geo %in% c("France", "Germany", "Spain", "Italy"),
         tax == "Prices with taxes") %>%
  mutate(values = values/1000) %>%
  filter(date >= Sys.Date() - months(6)) %>%
  left_join(colors, by = c("Geo" = "country")) %>%
  ggplot() + geom_line(aes(x = date, y = values, color = color)) +
  theme_minimal() + xlab("") + ylab("Automotive gas oil") + scale_color_identity() +
  scale_x_date(breaks = seq.Date(as.Date("2018-09-10"), Sys.Date(), "1 week"),
               labels = scales::date_format("%d %b %y")) + add_flags +
  scale_y_continuous(breaks = seq(-100, 100, 0.05),
                     labels = scales::dollar_format(a = .01, pre = "", su = " €/L")) +
  theme(legend.position = c(0.3, 0.95),
          axis.text.x = element_text(angle = 45, vjust = 1, hjust = 1),
        legend.title = element_blank())
France, Germany, Spain
Automotive gas oil
Since February 21, 2022 (War in Ukraine)
Value
Code
WOB %>%
  filter(`Product Name` == "Automotive gas oil",
         Geo %in% c("France", "Germany", "Spain")) %>%
  mutate(values = values/1000) %>%
  filter(date >= as.Date("2022-02-21")) %>%
  left_join(colors, by = c("Geo" = "country")) %>%
  ggplot() + geom_line(aes(x = date, y = values, color = color, linetype = tax)) +
  theme_minimal() + xlab("") + ylab("Automotive gas oil") + scale_color_identity() +
  scale_x_date(breaks = seq.Date(as.Date("2019-11-01"), Sys.Date(), "1 month"),
               labels = scales::date_format("%b %y")) + add_flags +
  scale_y_continuous(breaks = seq(-100, 100, 0.1),
                     labels = scales::dollar_format(a = .1, pre = "", su = " €/L")) +
  theme(legend.position = c(0.7, 0.95),
          axis.text.x = element_text(angle = 45, vjust = 1, hjust = 1),
        legend.title = element_blank())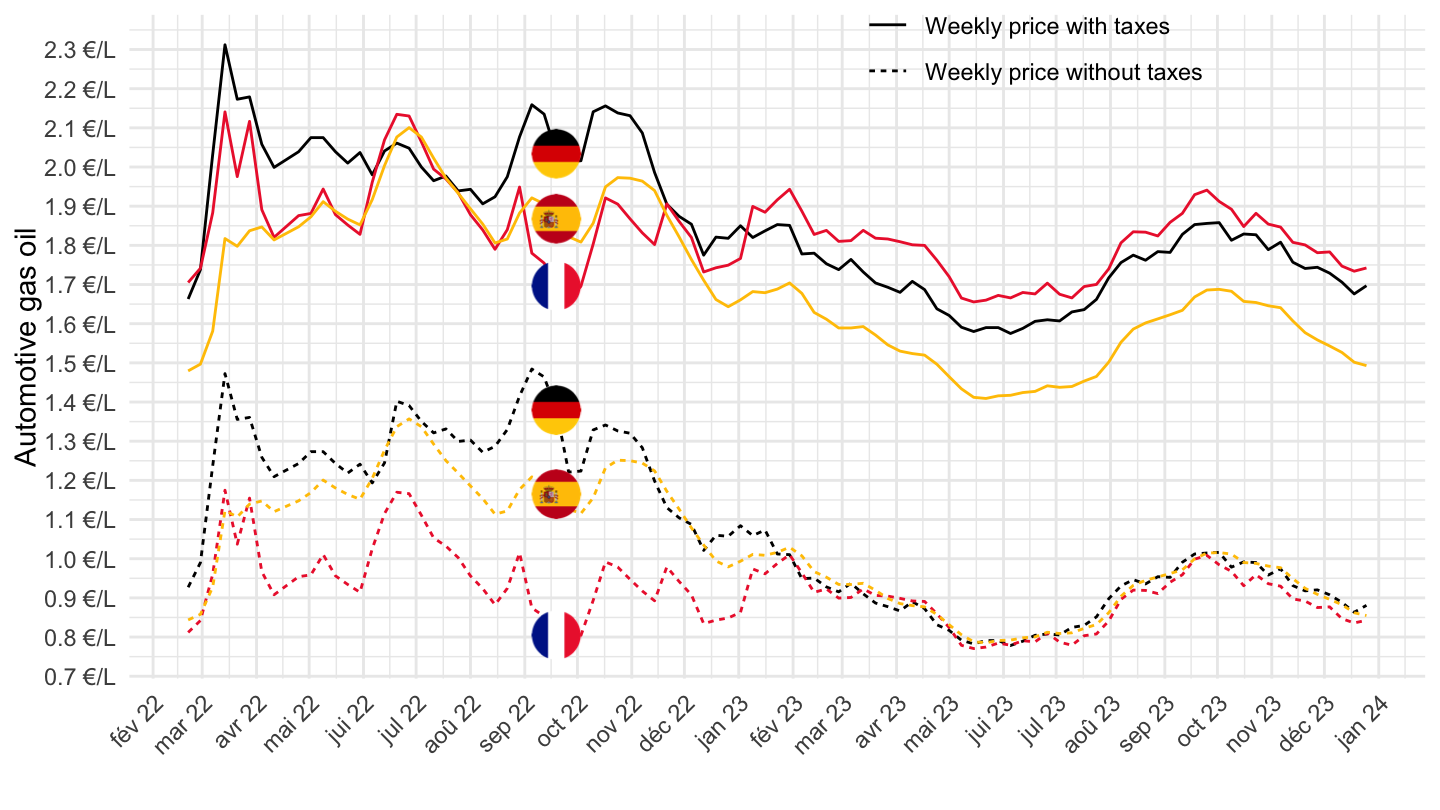
Index
Code
WOB %>%
  filter(`Product Name` == "Automotive gas oil",
         Geo %in% c("France", "Germany", "Spain")) %>%
  mutate(values = values/1000) %>%
  filter(date >= as.Date("2022-02-21")) %>%
  left_join(colors, by = c("Geo" = "country")) %>%
  group_by(Geo, tax) %>%
  mutate(values = 100*values/values[date == as.Date("2022-02-21")]) %>%
  ggplot() + geom_line(aes(x = date, y = values, color = color, linetype = tax)) +
  theme_minimal() + xlab("") + ylab("Automotive gas oil") + scale_color_identity() +
  scale_x_date(breaks = seq.Date(as.Date("2019-11-01"), Sys.Date(), "1 month"),
               labels = scales::date_format("%b %y")) + add_flags +
  scale_y_continuous(breaks = seq(100, 300, 10)) +
  theme(legend.position = c(0.7, 0.95),
          axis.text.x = element_text(angle = 45, vjust = 1, hjust = 1),
        legend.title = element_blank())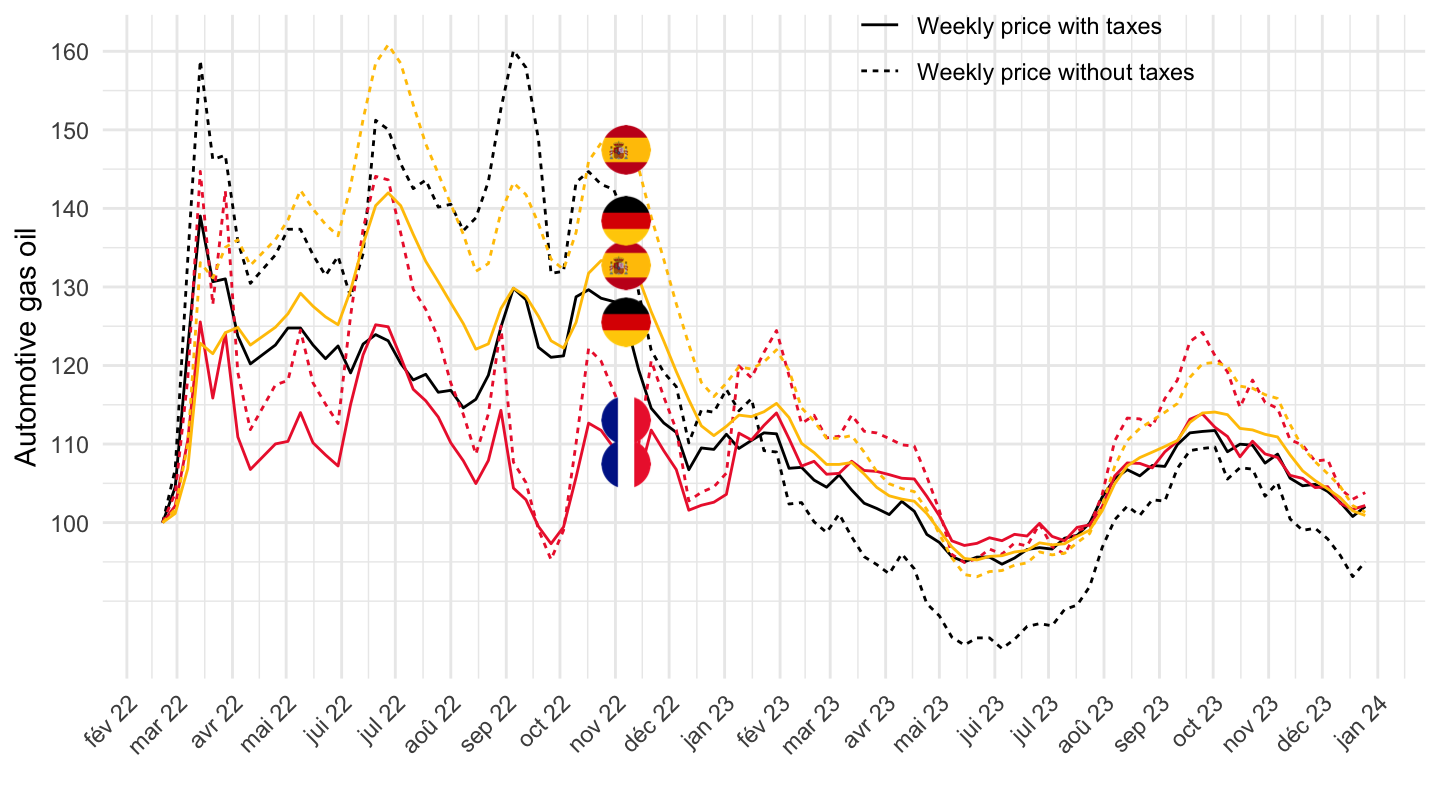
2022-
Code
WOB %>%
  filter(`Product Name` == "Automotive gas oil",
         Geo %in% c("France", "Germany", "Spain")) %>%
  mutate(values = values/1000) %>%
  filter(date >= as.Date("2022-01-01")) %>%
  left_join(colors, by = c("Geo" = "country")) %>%
  ggplot() + geom_line(aes(x = date, y = values, color = color, linetype = tax)) +
  theme_minimal() + xlab("") + ylab("Automotive gas oil") + scale_color_identity() +
  scale_x_date(breaks = seq.Date(as.Date("2019-11-01"), Sys.Date(), "1 month"),
               labels = scales::date_format("%b %y")) + add_flags +
  scale_y_continuous(breaks = seq(-100, 100, 0.1),
                     labels = scales::dollar_format(a = .1, pre = "", su = " €/L")) +
  theme(legend.position = c(0.7, 0.95),
          axis.text.x = element_text(angle = 45, vjust = 1, hjust = 1),
        legend.title = element_blank())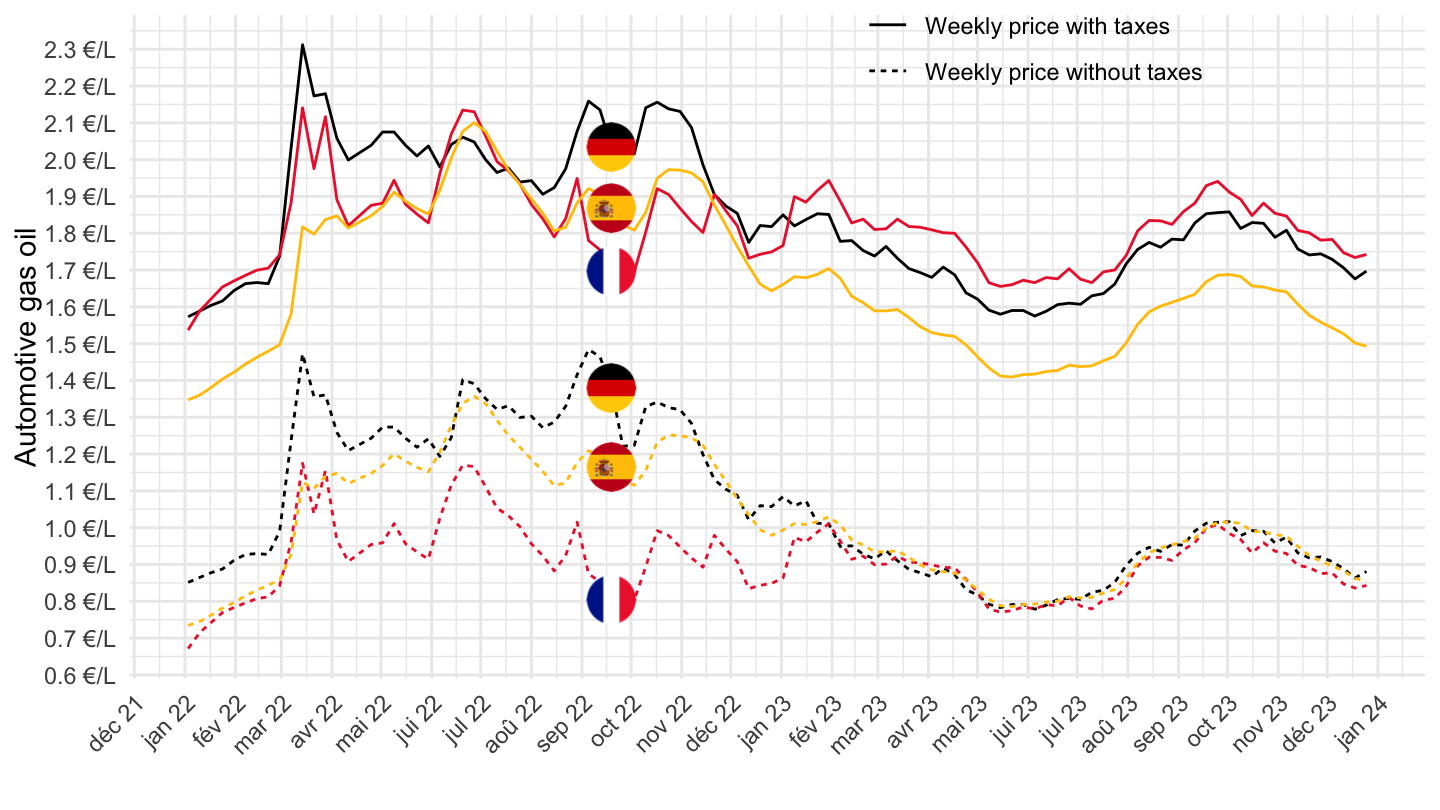
1 year
Code
WOB %>%
  filter(`Product Name` == "Automotive gas oil",
         Geo %in% c("France", "Germany", "Spain")) %>%
  mutate(values = values/1000) %>%
  filter(date >= Sys.Date() - years(1)) %>%
  left_join(colors, by = c("Geo" = "country")) %>%
  ggplot() + geom_line(aes(x = date, y = values, color = color, linetype = tax)) +
  theme_minimal() + xlab("") + ylab("Automotive gas oil") + scale_color_identity() +
  scale_x_date(breaks = seq.Date(as.Date("2019-11-01"), Sys.Date(), "1 month"),
               labels = scales::date_format("%b %y")) + add_flags +
  scale_y_continuous(breaks = seq(-100, 100, 0.1),
                     labels = scales::dollar_format(a = .1, pre = "", su = " €/L")) +
  theme(legend.position = c(0.7, 0.95),
          axis.text.x = element_text(angle = 45, vjust = 1, hjust = 1),
        legend.title = element_blank())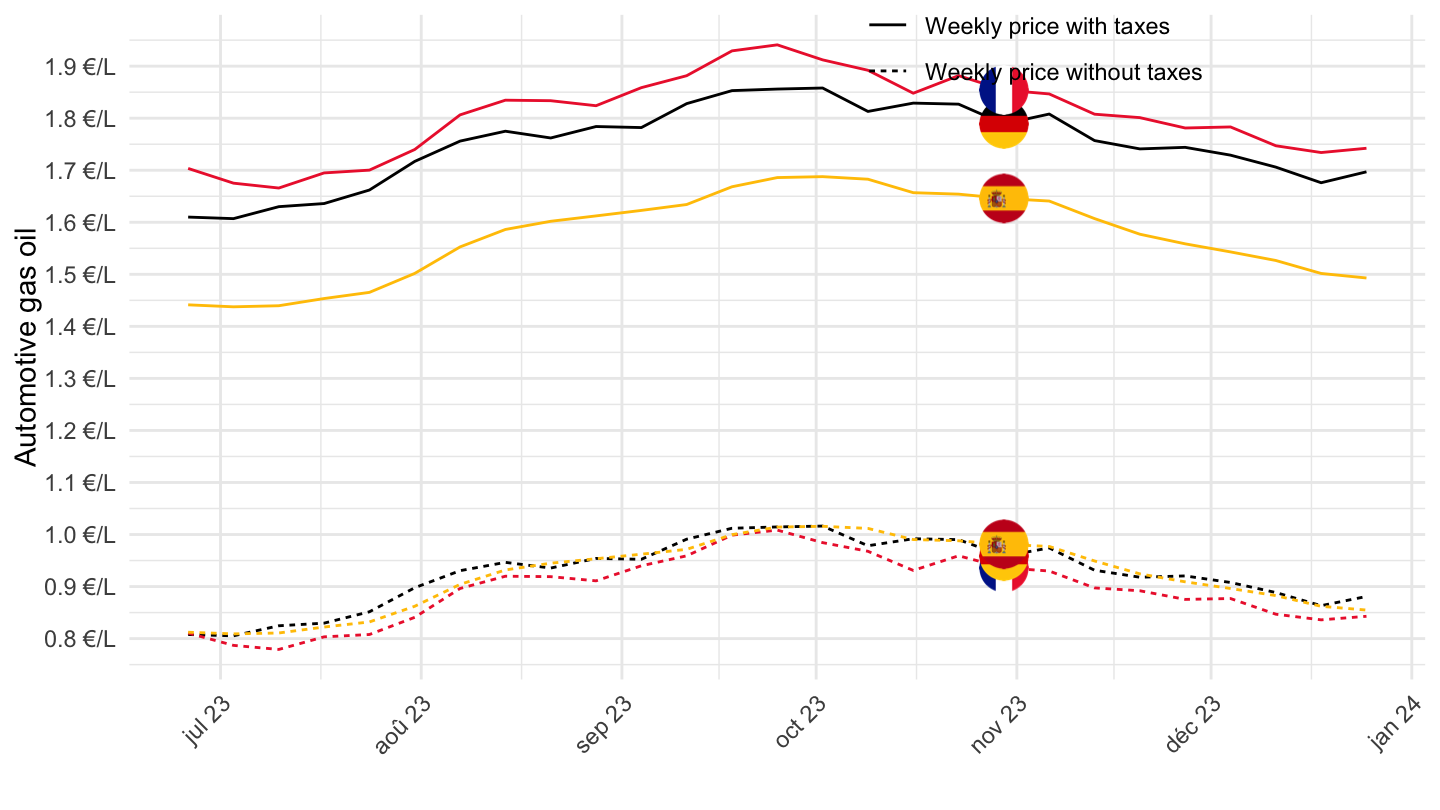
3 months
Code
WOB %>%
  filter(`Product Name` == "Automotive gas oil",
         Geo %in% c("France", "Germany", "Spain")) %>%
  mutate(values = values/1000) %>%
  filter(date >= Sys.Date() - months(3)) %>%
  left_join(colors, by = c("Geo" = "country")) %>%
  ggplot() + geom_line(aes(x = date, y = values, color = color, linetype = tax)) +
  theme_minimal() + xlab("") + ylab("Automotive gas oil") + scale_color_identity() +
  scale_x_date(breaks = seq.Date(as.Date("2018-09-10"), Sys.Date(), "1 week"),
               labels = scales::date_format("%d %b %y")) + add_flags +
  scale_y_continuous(breaks = seq(-100, 100, 0.1),
                     labels = scales::dollar_format(a = .1, pre = "", su = " €/L")) +
  theme(legend.position = c(0.3, 0.95),
          axis.text.x = element_text(angle = 45, vjust = 1, hjust = 1),
        legend.title = element_blank())
All
Code
WOB %>%
  filter(`Product Name` == "Automotive gas oil",
         Geo %in% c("France", "Germany", "Spain")) %>%
  mutate(values = values/1000) %>%
  left_join(colors, by = c("Geo" = "country")) %>%
  ggplot() + geom_line(aes(x = date, y = values, color = color, linetype = tax)) +
  theme_minimal() + xlab("") + ylab("Automotive gas oil") + scale_color_identity() +
  scale_x_date(breaks = seq.Date(as.Date("1995-12-01"), Sys.Date(), "6 months"),
               labels = scales::date_format("%b %y")) + add_flags +
  scale_y_continuous(breaks = seq(-100, 100, 0.1),
                     labels = scales::dollar_format(a = .1, pre = "", su = " €/L")) +
  theme(legend.position = c(0.3, 0.95),
          axis.text.x = element_text(angle = 45, vjust = 1, hjust = 1),
        legend.title = element_blank())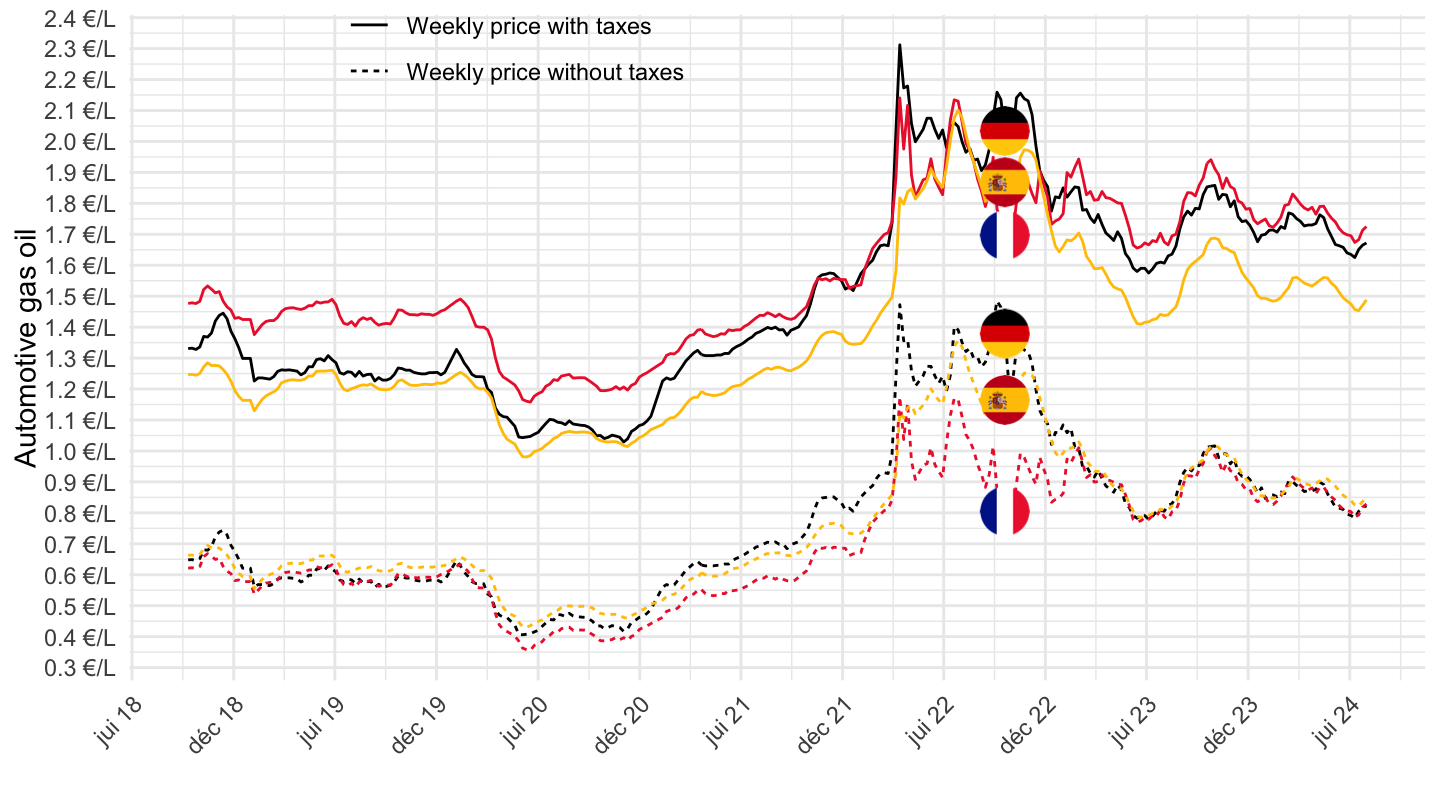
Heating gas oil
2022-
Code
WOB %>%
  filter(`Product Name` == "Heating gas oil",
         Geo %in% c("France", "Germany", "Spain")) %>%
  mutate(values = values/1000) %>%
  filter(date >= as.Date("2022-01-01")) %>%
  left_join(colors, by = c("Geo" = "country")) %>%
  ggplot() + geom_line(aes(x = date, y = values, color = color, linetype = tax)) +
  theme_minimal() + xlab("") + ylab("Heating gas oil") + scale_color_identity() +
  scale_x_date(breaks = seq.Date(as.Date("2019-11-01"), Sys.Date(), "1 month"),
               labels = scales::date_format("%b %y")) + add_flags +
  scale_y_continuous(breaks = seq(-100, 100, 0.1),
                     labels = scales::dollar_format(a = .1, pre = "", su = " €/L")) +
  theme(legend.position = c(0.7, 0.95),
          axis.text.x = element_text(angle = 45, vjust = 1, hjust = 1),
        legend.title = element_blank())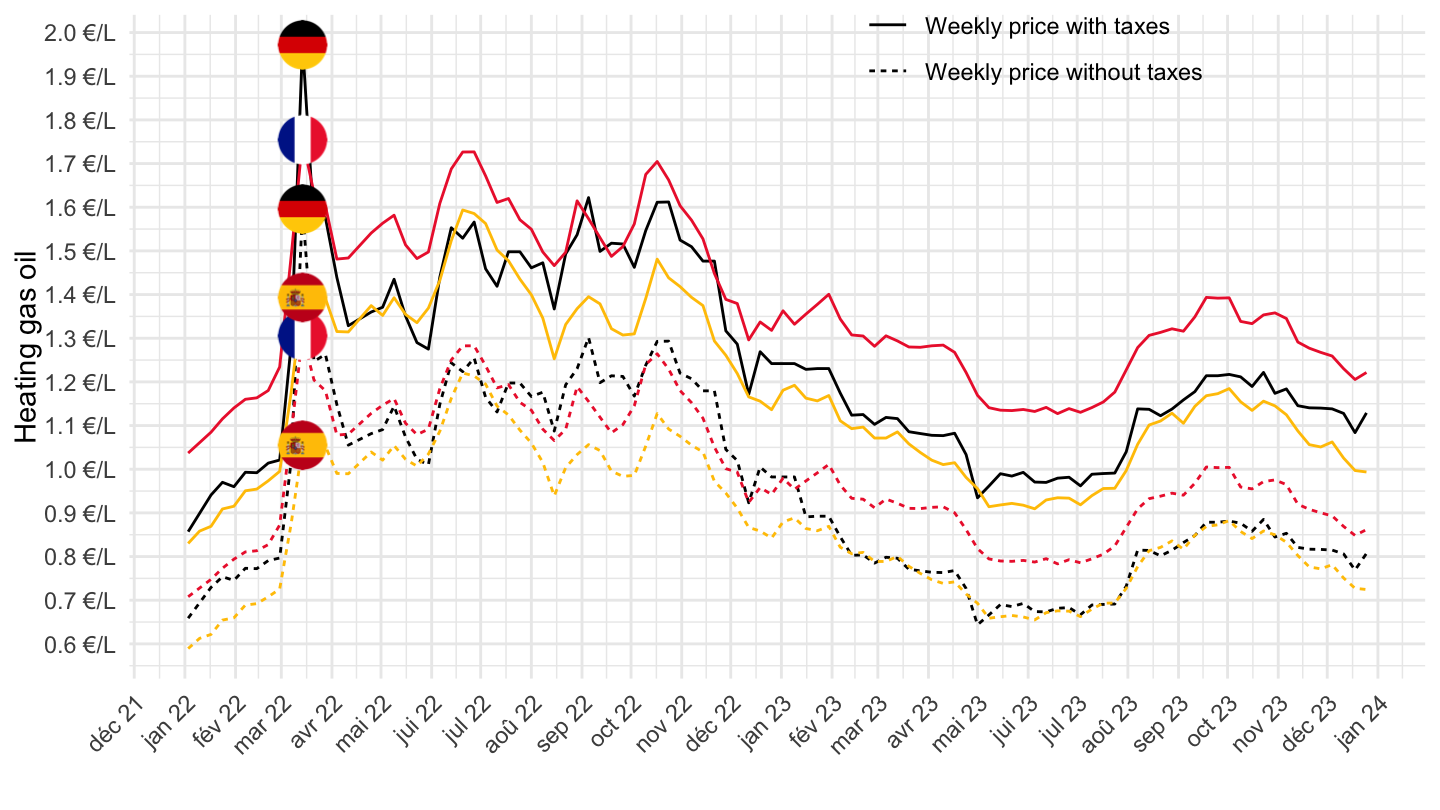
All
Code
WOB %>%
  filter(`Product Name` == "Heating gas oil",
         Geo %in% c("France", "Germany", "Spain")) %>%
  mutate(values = values/1000) %>%
  left_join(colors, by = c("Geo" = "country")) %>%
  ggplot() + geom_line(aes(x = date, y = values, color = color, linetype = tax)) +
  theme_minimal() + xlab("") + ylab("Heating gas oil") + scale_color_identity() +
  scale_x_date(breaks = seq.Date(as.Date("2000-12-01"), Sys.Date(), "6 months"),
               labels = scales::date_format("%b %y")) + add_flags +
  scale_y_continuous(breaks = seq(-100, 100, 0.1),
                     labels = scales::dollar_format(a = .1, pre = "", su = " €/L")) +
  theme(legend.position = c(0.3, 0.95),
          axis.text.x = element_text(angle = 45, vjust = 1, hjust = 1),
        legend.title = element_blank())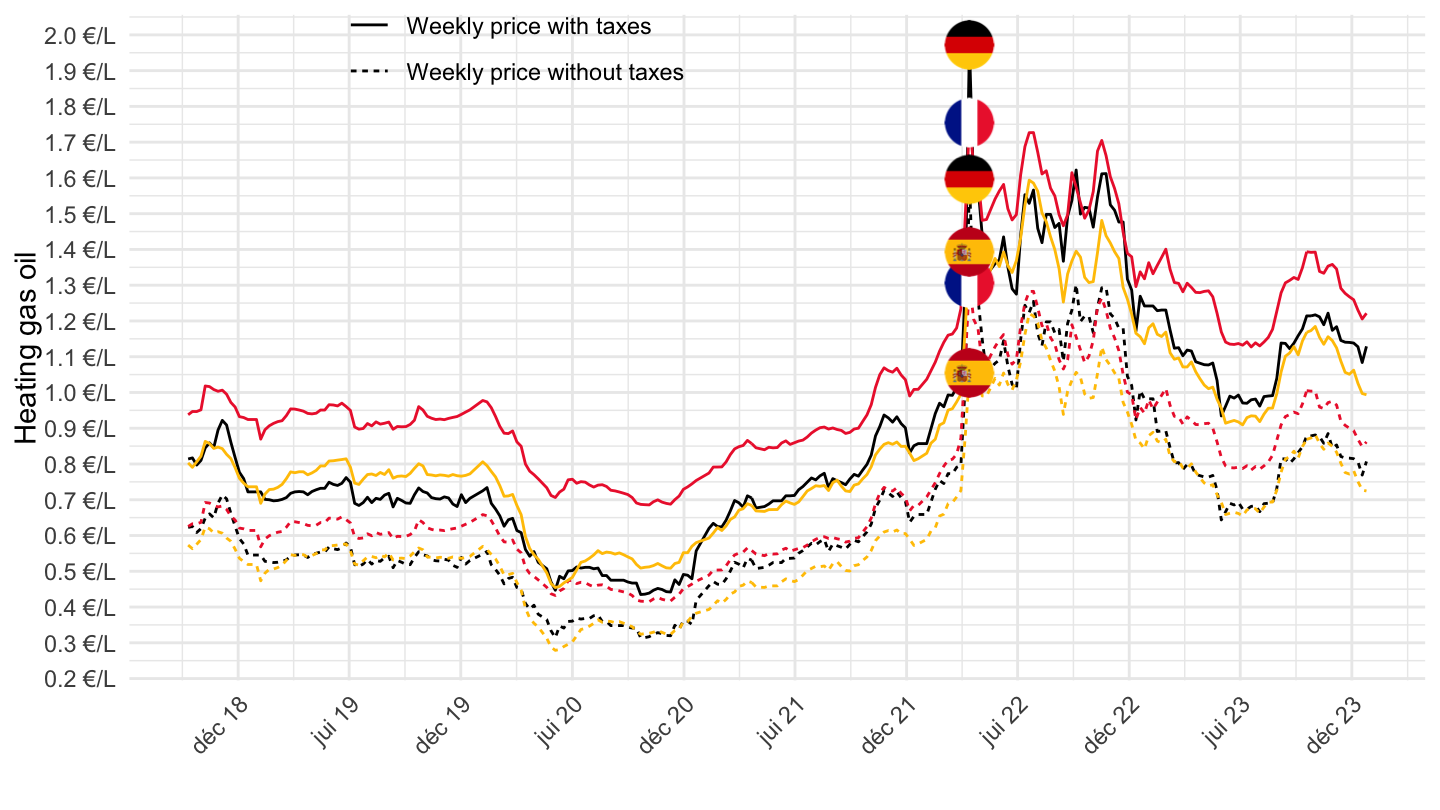
Euro-super 95
Since War in Ukraine
Value
Code
WOB %>%
  filter(`Product Name` == "Euro-super 95",
         Geo %in% c("France", "Germany", "Spain")) %>%
  mutate(values = values/1000) %>%
  filter(date >= as.Date("2022-02-21")) %>%
  left_join(colors, by = c("Geo" = "country")) %>%
  ggplot() + geom_line(aes(x = date, y = values, color = color, linetype = tax)) +
  theme_minimal() + xlab("") + ylab("Euro-super 95") + scale_color_identity() +
  scale_x_date(breaks = seq.Date(as.Date("2019-11-01"), Sys.Date(), "1 month"),
               labels = scales::date_format("%b %y")) + add_flags +
  scale_y_continuous(breaks = seq(-100, 100, 0.1),
                     labels = scales::dollar_format(a = .1, pre = "", su = " €/L")) +
  theme(legend.position = c(0.7, 0.95),
          axis.text.x = element_text(angle = 45, vjust = 1, hjust = 1),
        legend.title = element_blank())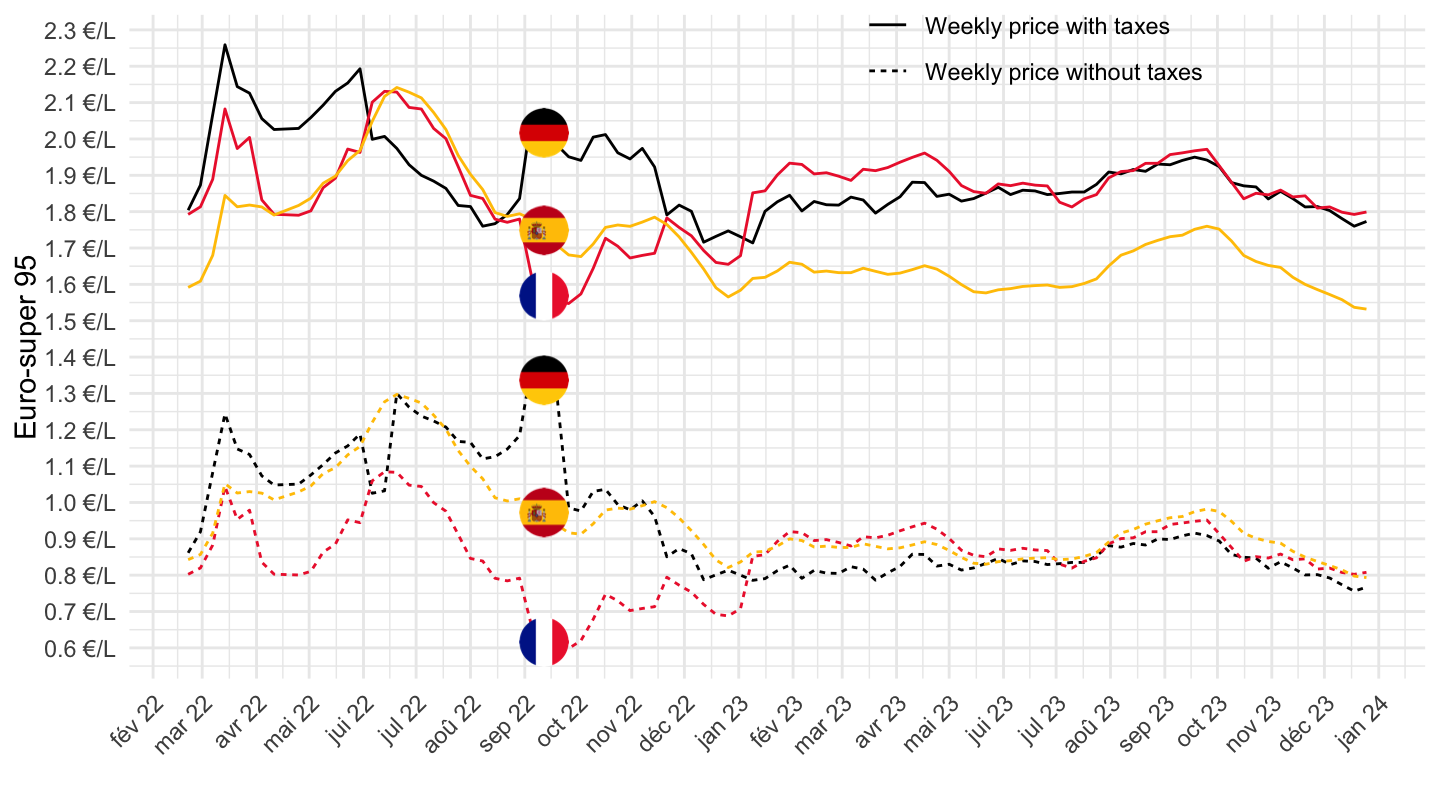
Index
Code
WOB %>%
  filter(`Product Name` == "Euro-super 95",
         Geo %in% c("France", "Germany", "Spain")) %>%
  mutate(values = values/1000) %>%
  filter(date >= as.Date("2022-02-21")) %>%
  left_join(colors, by = c("Geo" = "country")) %>%
  group_by(Geo, tax) %>%
  mutate(values = 100*values/values[date == as.Date("2022-02-21")]) %>%
  ggplot() + geom_line(aes(x = date, y = values, color = color, linetype = tax)) +
  theme_minimal() + xlab("") + ylab("Euro-super 95") + scale_color_identity() +
  scale_x_date(breaks = seq.Date(as.Date("2019-11-01"), Sys.Date(), "1 month"),
               labels = scales::date_format("%b %y")) + add_flags +
  scale_y_continuous(breaks = seq(10, 300, 10)) +
  theme(legend.position = c(0.7, 0.95),
          axis.text.x = element_text(angle = 45, vjust = 1, hjust = 1),
        legend.title = element_blank())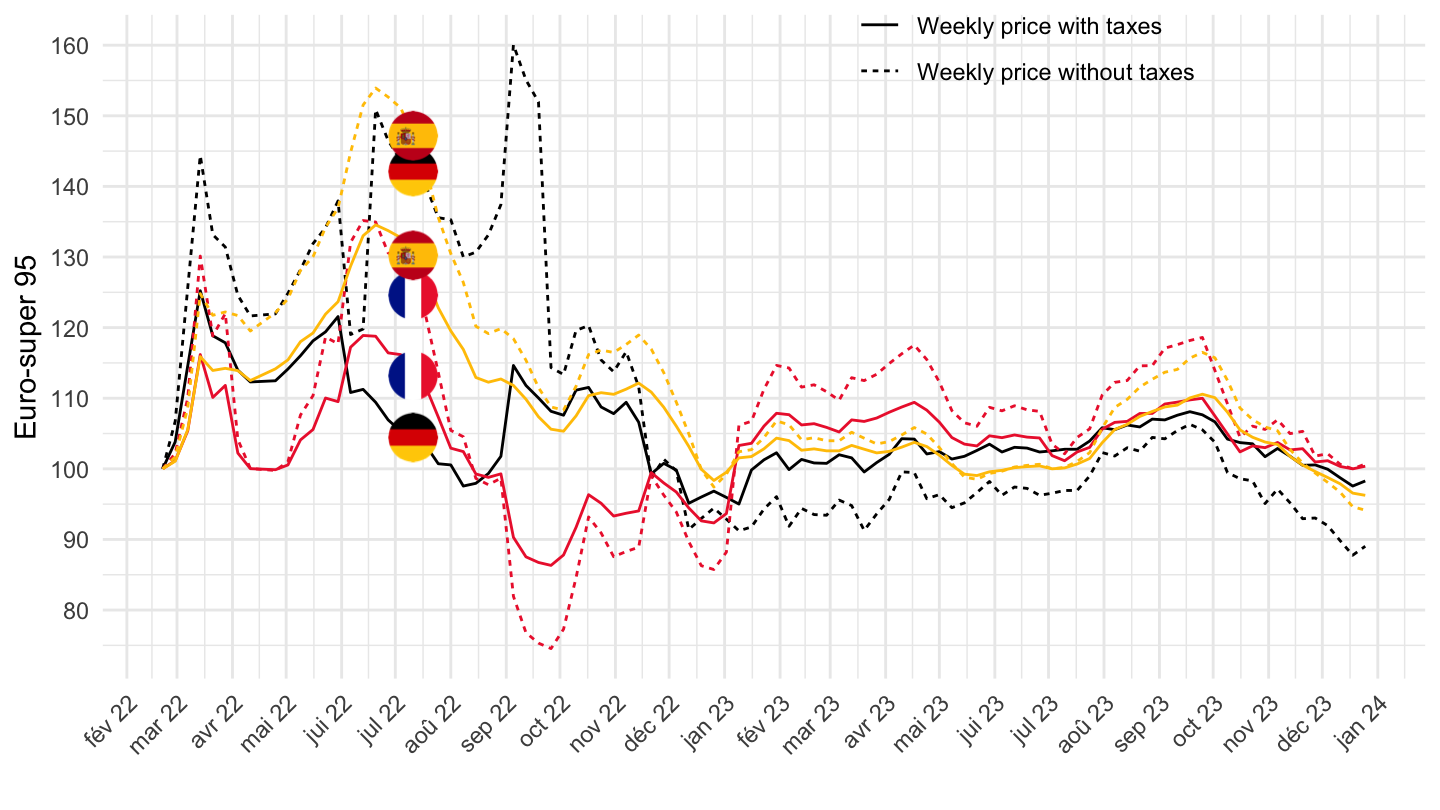
2022-
Code
WOB %>%
  filter(`Product Name` == "Euro-super 95",
         Geo %in% c("France", "Germany", "Spain")) %>%
  mutate(values = values/1000) %>%
  filter(date >= as.Date("2022-01-01")) %>%
  left_join(colors, by = c("Geo" = "country")) %>%
  ggplot() + geom_line(aes(x = date, y = values, color = color, linetype = tax)) +
  theme_minimal() + xlab("") + ylab("Euro-super 95") + scale_color_identity() +
  scale_x_date(breaks = seq.Date(as.Date("2019-11-01"), Sys.Date(), "1 month"),
               labels = scales::date_format("%b %y")) + add_flags +
  scale_y_continuous(breaks = seq(-100, 100, 0.1),
                     labels = scales::dollar_format(a = .1, pre = "", su = " €/L")) +
  theme(legend.position = c(0.7, 0.95),
          axis.text.x = element_text(angle = 45, vjust = 1, hjust = 1),
        legend.title = element_blank())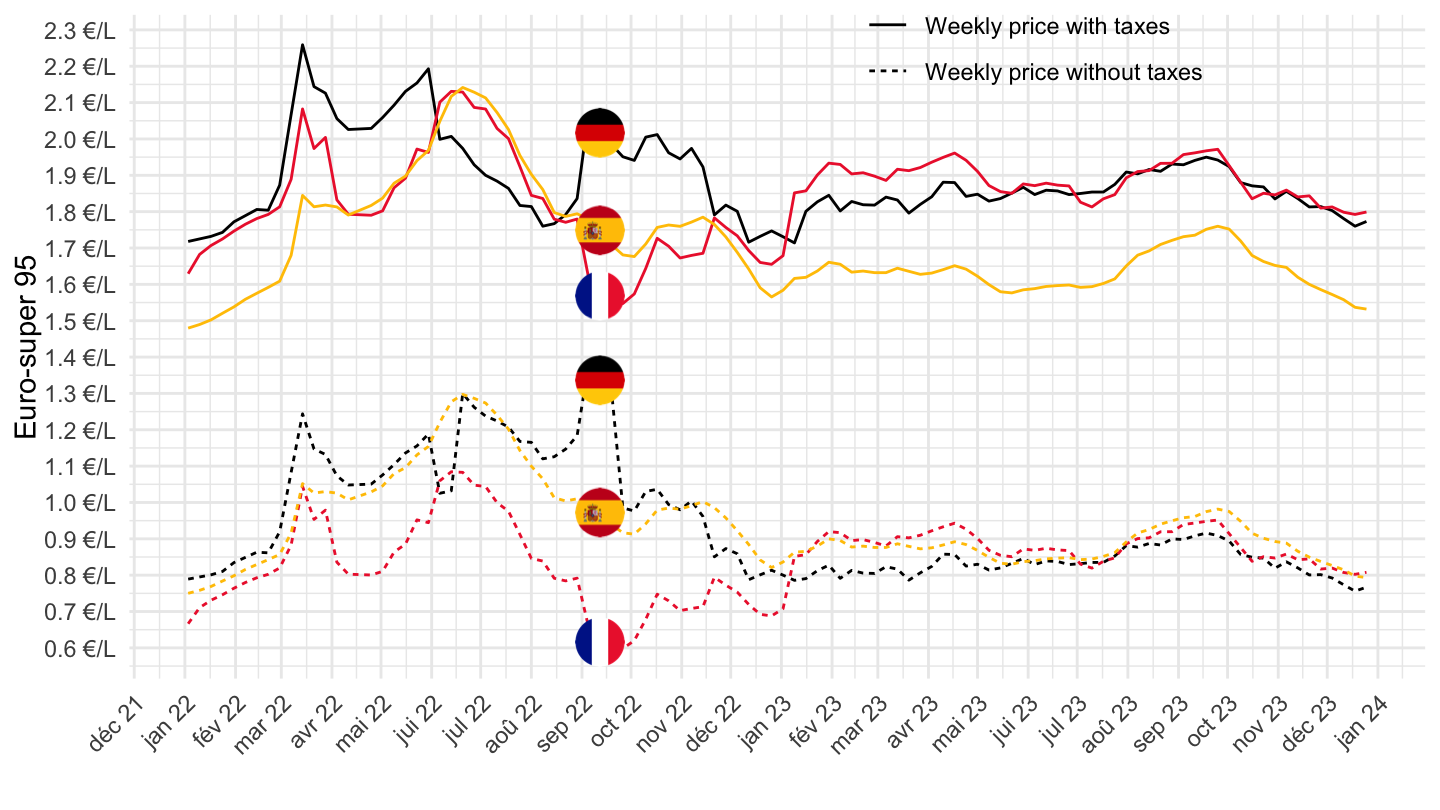
All
Code
WOB %>%
  filter(`Product Name` == "Euro-super 95",
         Geo %in% c("France", "Germany", "Spain")) %>%
  mutate(values = values/1000) %>%
  left_join(colors, by = c("Geo" = "country")) %>%
  ggplot() + geom_line(aes(x = date, y = values, color = color, linetype = tax)) +
  theme_minimal() + xlab("") + ylab("Euro-super 95") + scale_color_identity() +
  scale_x_date(breaks = seq.Date(as.Date("2000-12-01"), Sys.Date(), "6 months"),
               labels = scales::date_format("%b %y")) + add_flags +
  scale_y_continuous(breaks = seq(-100, 100, 0.1),
                     labels = scales::dollar_format(a = .1, pre = "", su = " €/L")) +
  theme(legend.position = c(0.3, 0.95),
          axis.text.x = element_text(angle = 45, vjust = 1, hjust = 1),
        legend.title = element_blank())