Energy - monthly data
Data - Eurostat
Info
Last observation: Monthly: 2026M06 (N = 112)
First observation: Monthly: 2008M01 (N = 300)
Last data update: 23 jul 2026, 23:04. Last compile: 24 jul 2026, 01:24
Structure
indic
French
Code
load_data("eurostat/indic_fr.RData")
ei_isen_m %>%

  group_by(indic, Indic) %>%
  summarise(Nobs = n()) %>%
  arrange(-Nobs) %>%
{if (is_html_output()) print_table(.) else .}| indic | Indic | Nobs |
|---|---|---|
| IS-PEL-GWH | Production of electricity - GWh | 7770 |
| IS-CEL-GWH | Consumption of electricity - GWh | 7726 |
| IS-IEL-GWH | Imports of electricity - GWh | 7726 |
| IS-IDC-T | Inland deliveries of brown coal - 1000t | 7630 |
| IS-CNG-TJ | Total consumption of natural gas, TJ (GCV) | 7549 |
| IS-ING-TJ | Imports of natural gas, TJ (GCV) | 7509 |
| IS-IDMG-T | Inland deliveries of motor gasoline - 1000t | 7319 |
| IS-IDJF-T | Inland deliveries of kerosene-type jet fuel - 1000t | 7311 |
| IS-PNG-TJ | Production of natural gas, TJ (GCV) | 7200 |
| IS-ICO-T | Imports of crude oil - 1000t | 7126 |
| IS-IDMS-T | Inland deliveries of motor spirit - 1000t | 5400 |
| IS-IDGD-T | Inland deliveries of gas/diesel oil - 1000t | 5398 |
| IS-ROMS-T | Refinery output of motor spirit - 1000t | 5231 |
| IS-ROGD-T | Refinery output of gas/diesel oil - 1000t | 5228 |
English
Code
load_data("eurostat/indic.RData")
ei_isen_m %>%

  group_by(indic, Indic) %>%
  summarise(Nobs = n()) %>%
  arrange(-Nobs) %>%
{if (is_html_output()) print_table(.) else .}| indic | Indic | Nobs |
|---|---|---|
| IS-PEL-GWH | Production of electricity - GWh | 7770 |
| IS-CEL-GWH | Consumption of electricity - GWh | 7726 |
| IS-IEL-GWH | Imports of electricity - GWh | 7726 |
| IS-IDC-T | Inland deliveries of brown coal - 1000t | 7630 |
| IS-CNG-TJ | Total consumption of natural gas, TJ (GCV) | 7549 |
| IS-ING-TJ | Imports of natural gas, TJ (GCV) | 7509 |
| IS-IDMG-T | Inland deliveries of motor gasoline - 1000t | 7319 |
| IS-IDJF-T | Inland deliveries of kerosene-type jet fuel - 1000t | 7311 |
| IS-PNG-TJ | Production of natural gas, TJ (GCV) | 7200 |
| IS-ICO-T | Imports of crude oil - 1000t | 7126 |
| IS-IDMS-T | Inland deliveries of motor spirit - 1000t | 5400 |
| IS-IDGD-T | Inland deliveries of gas/diesel oil - 1000t | 5398 |
| IS-ROMS-T | Refinery output of motor spirit - 1000t | 5231 |
| IS-ROGD-T | Refinery output of gas/diesel oil - 1000t | 5228 |
France, Germany, Italy, Spain
Electricity
Consumption
Code
ei_isen_m %>%
  filter(geo %in% c("FR", "DE", "IT", "ES"),
         indic %in% c("IS-CEL-GWH")) %>%

  month_to_date %>%
  left_join(colors, by = c("Geo" = "country")) %>%
  ggplot + geom_line(aes(x = date, y = values, color = color)) +
  scale_color_identity() + theme_minimal()  + add_4flags +
  scale_x_date(breaks = as.Date(paste0(seq(1960, 2100, 2), "-01-01")),
               labels = date_format("%Y")) +
  xlab("") + ylab("")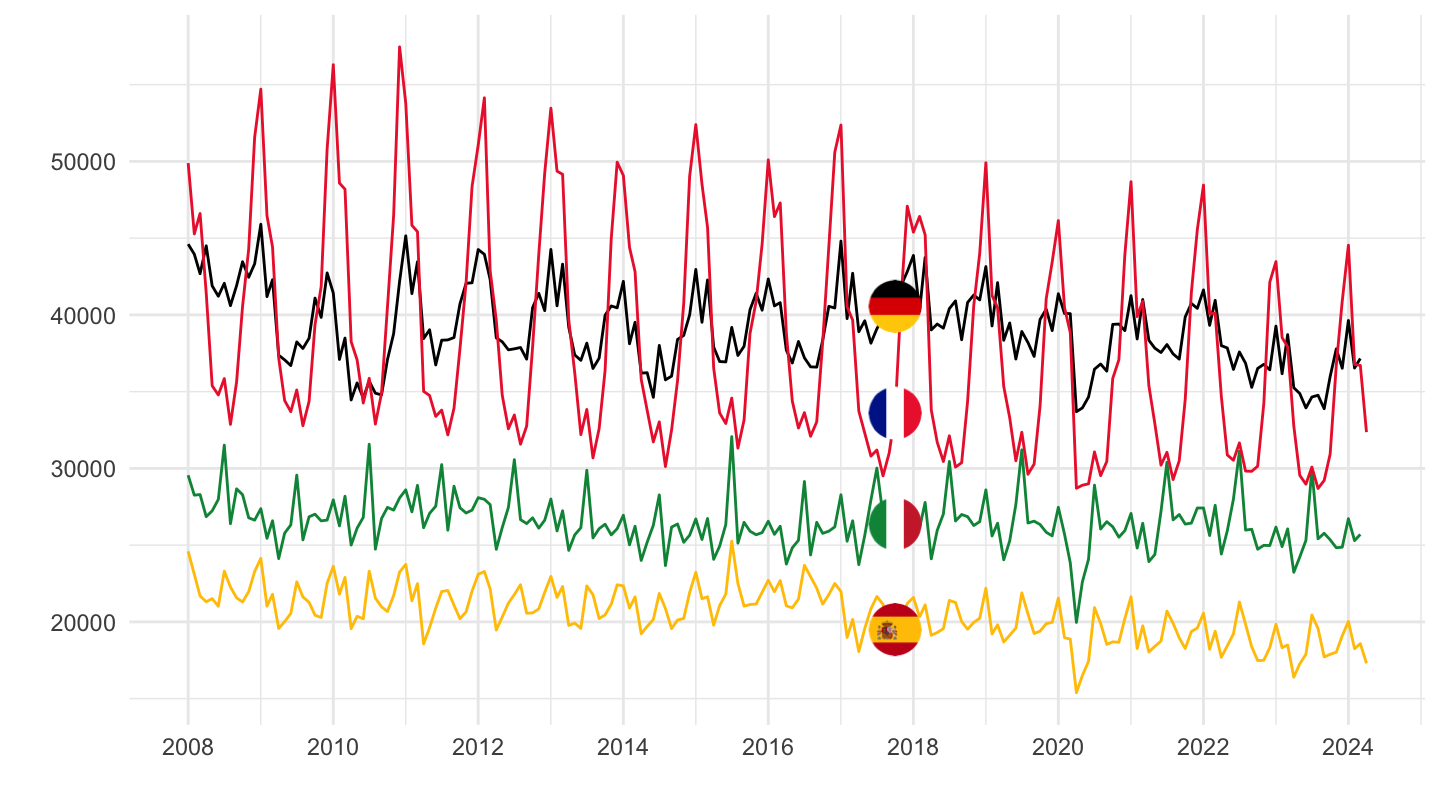
Imports
Code
ei_isen_m %>%
  filter(geo %in% c("FR", "DE", "IT", "ES"),
         indic %in% c("IS-IEL-GWH")) %>%

  month_to_date %>%
  left_join(colors, by = c("Geo" = "country")) %>%
  ggplot + geom_line(aes(x = date, y = values, color = color)) +
  scale_color_identity() + theme_minimal()  + add_4flags +
  scale_x_date(breaks = as.Date(paste0(seq(1960, 2100, 2), "-01-01")),
               labels = date_format("%Y")) +
  xlab("") + ylab("")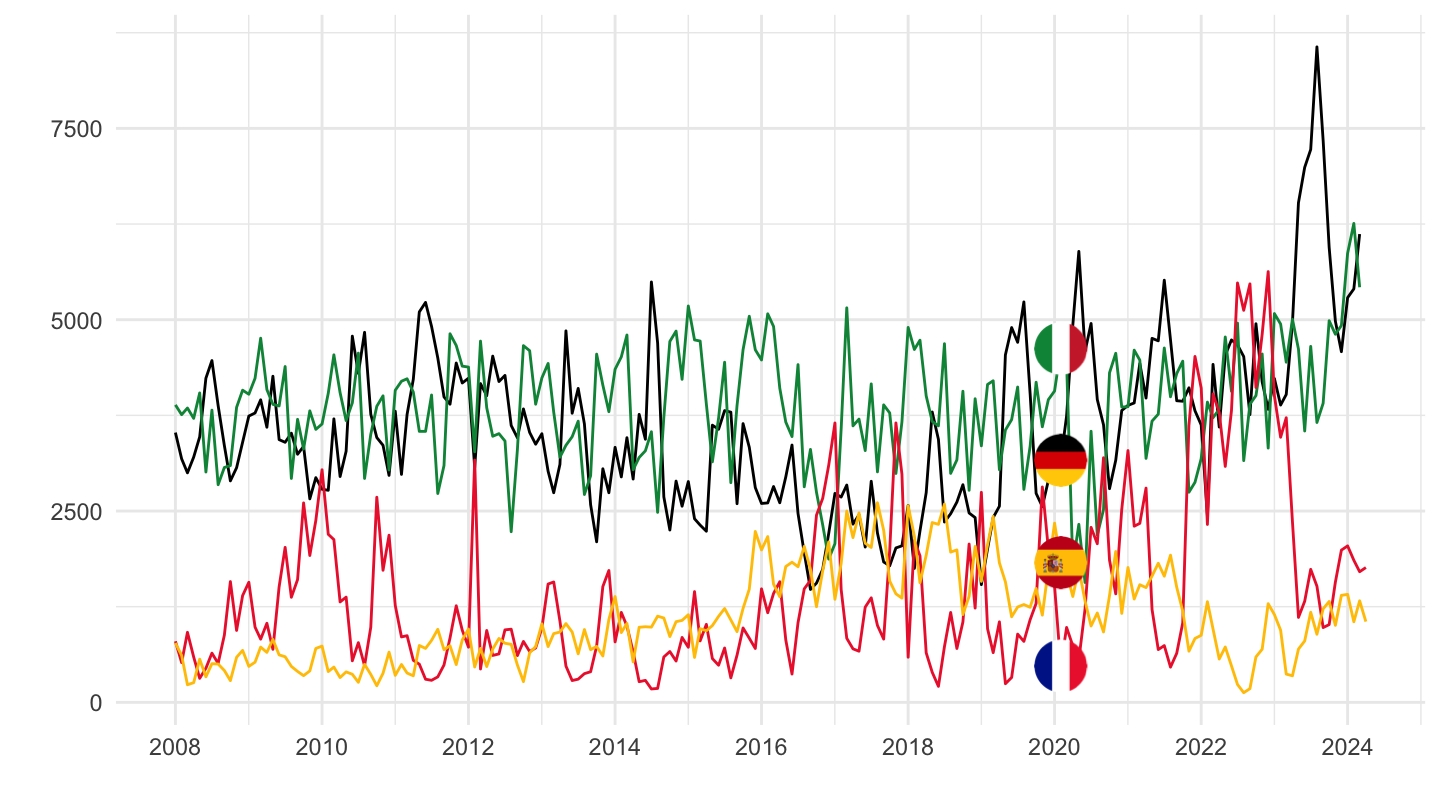
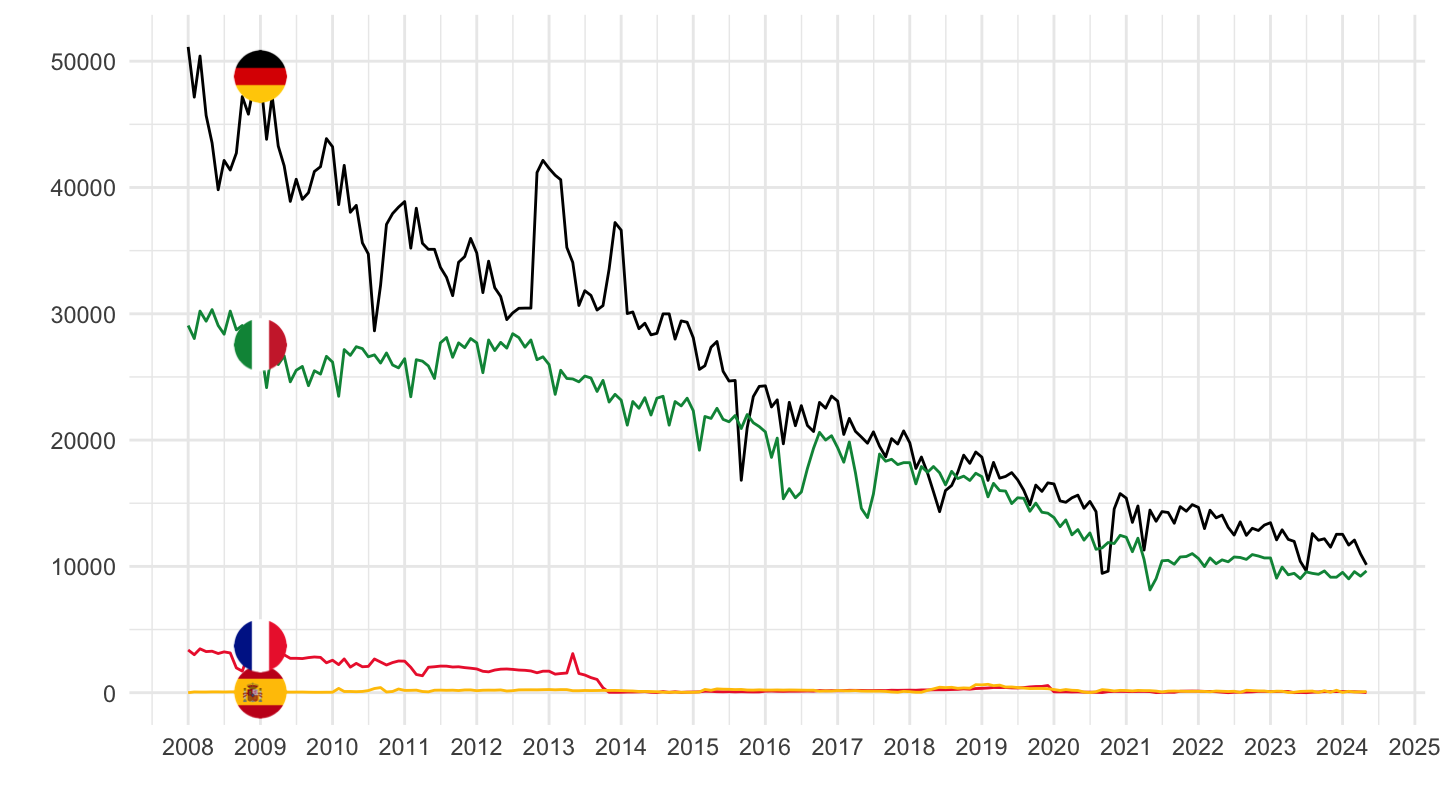
Production
Code
ei_isen_m %>%
  filter(geo %in% c("FR", "DE", "IT", "ES"),
         indic %in% c("IS-PEL-GWH")) %>%

  month_to_date %>%
  left_join(colors, by = c("Geo" = "country")) %>%
  ggplot + geom_line(aes(x = date, y = values, color = color)) +
  scale_color_identity() + theme_minimal()  + add_4flags +
  scale_x_date(breaks = as.Date(paste0(seq(1960, 2100, 1), "-01-01")),
               labels = date_format("%Y")) +
  xlab("") + ylab("")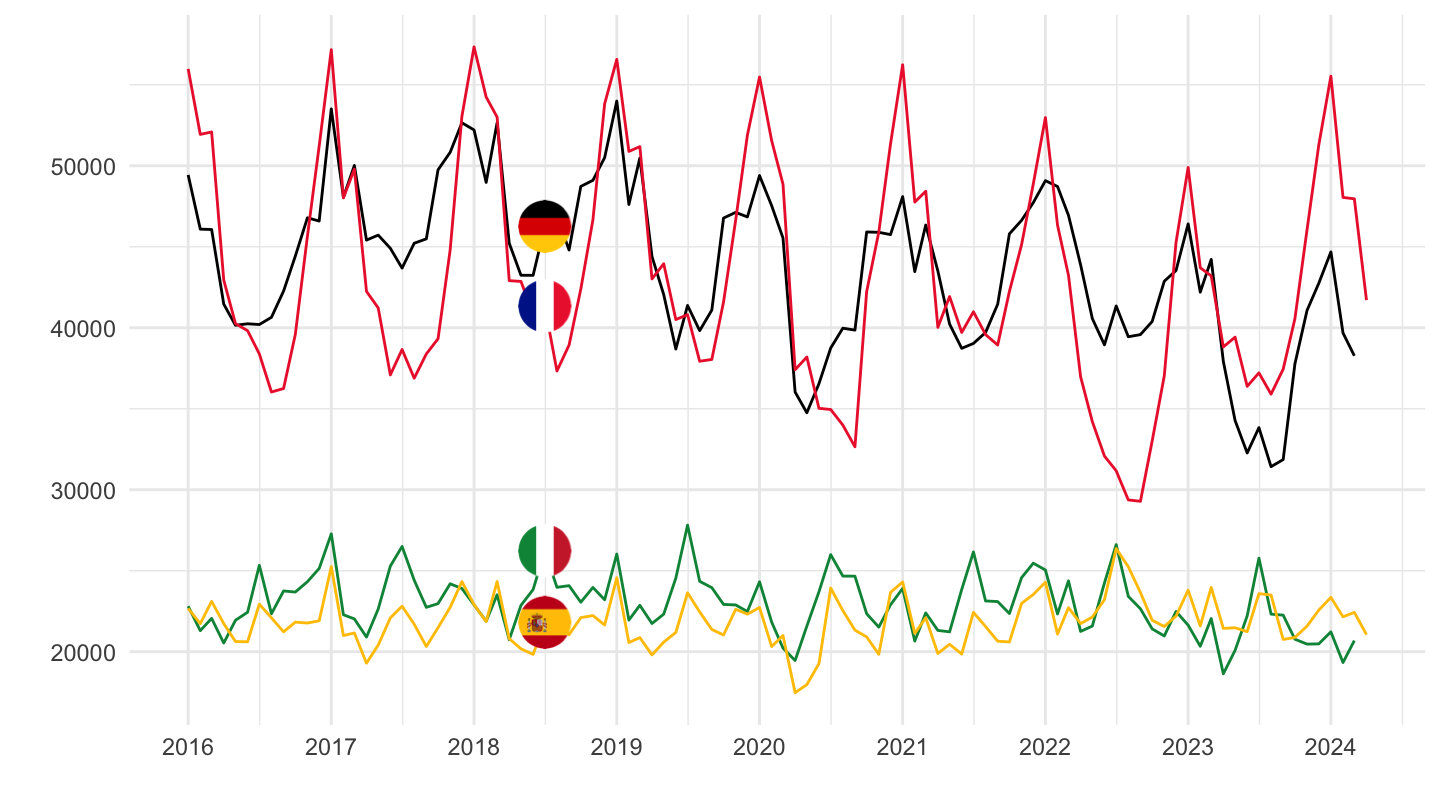
Natural Gas
Consumption
Code
ei_isen_m %>%
  filter(geo %in% c("FR", "DE", "IT", "ES"),
         indic %in% c("IS-CNG-TJ")) %>%

  month_to_date %>%
  left_join(colors, by = c("Geo" = "country")) %>%
  ggplot + geom_line(aes(x = date, y = values, color = color)) +
  scale_color_identity() + theme_minimal()  + add_4flags +
  scale_x_date(breaks = as.Date(paste0(seq(1960, 2100, 2), "-01-01")),
               labels = date_format("%Y")) +
  xlab("") + ylab("")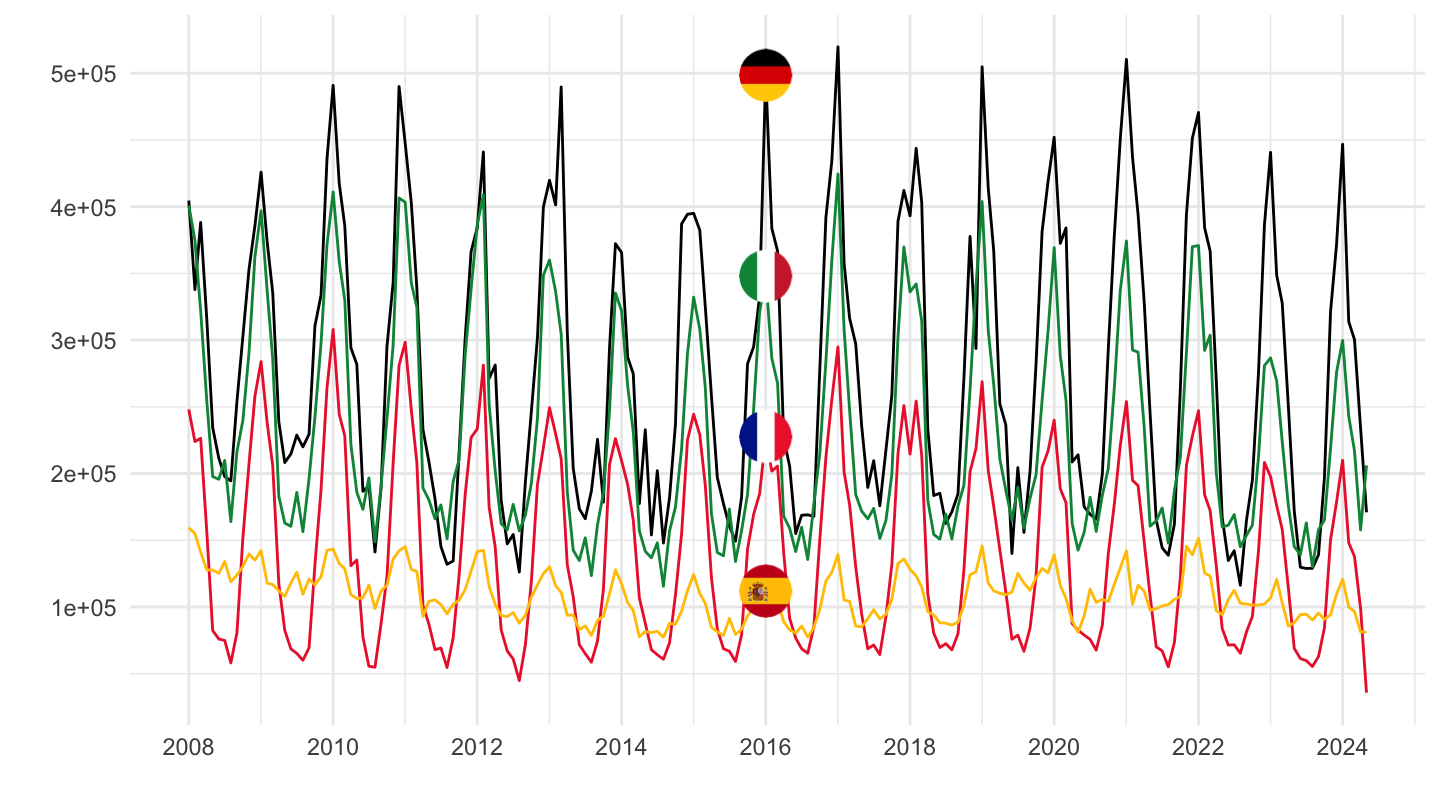
Imports
Code
ei_isen_m %>%
  filter(geo %in% c("FR", "DE", "IT", "ES"),
         indic %in% c("IS-ING-TJ")) %>%

  month_to_date %>%
  left_join(colors, by = c("Geo" = "country")) %>%
  ggplot + geom_line(aes(x = date, y = values, color = color)) +
  scale_color_identity() + theme_minimal()  + add_4flags +
  scale_x_date(breaks = as.Date(paste0(seq(1960, 2100, 2), "-01-01")),
               labels = date_format("%Y")) +
  xlab("") + ylab("")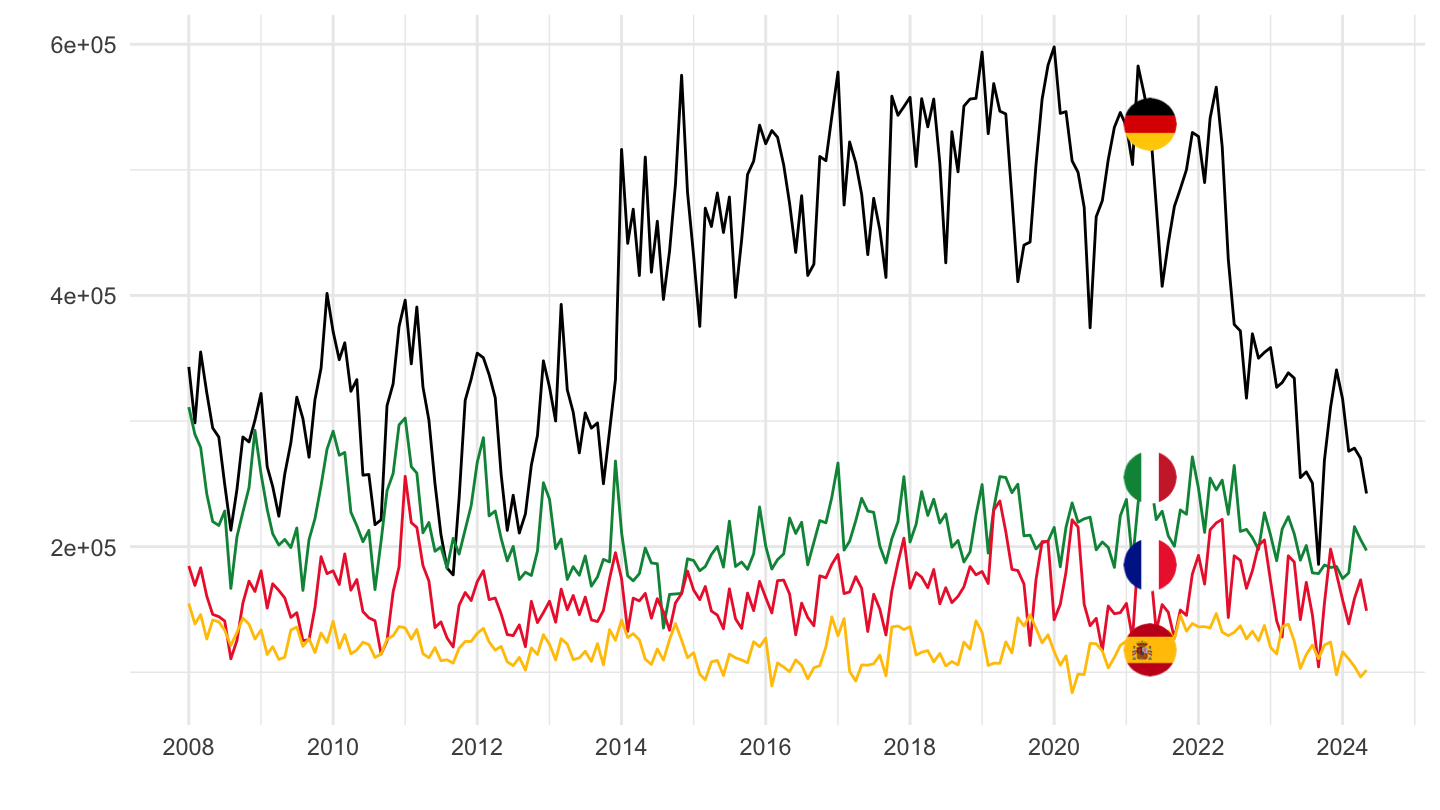
Production
Code
ei_isen_m %>%
  filter(geo %in% c("FR", "DE", "IT", "ES"),
         indic %in% c("IS-PNG-TJ")) %>%

  month_to_date %>%
  left_join(colors, by = c("Geo" = "country")) %>%
  ggplot + geom_line(aes(x = date, y = values, color = color)) +
  scale_color_identity() + theme_minimal()  + add_4flags +
  scale_x_date(breaks = as.Date(paste0(seq(1960, 2100, 1), "-01-01")),
               labels = date_format("%Y")) +
  xlab("") + ylab("")