| source | dataset | Title | .html | .rData |
|---|---|---|---|---|
| insee | t_conso_vol | Dépenses de consommation des ménages - volumes aux prix de l'année précédente chaînés (données CVS-CJO), base 2014 | 2026-07-23 | 2026-02-27 |
Dépenses de consommation des ménages - volumes aux prix de l’année précédente chaînés (données CVS-CJO), base 2014
Données - INSEE
Info
Données sur la macroéconomie en France
| source | dataset | Title | .html | .rData |
|---|---|---|---|---|
| bdf | CFT | Comptes Financiers Trimestriels | 2026-07-23 | 2025-03-09 |
| insee | CNA-2014-CONSO-SI | Dépenses de consommation finale par secteur institutionnel | 2026-07-23 | 2026-07-23 |
| insee | CNA-2014-CSI | Comptes des secteurs institutionnels | 2026-07-23 | 2026-07-23 |
| insee | CNA-2014-FBCF-BRANCHE | Formation brute de capital fixe (FBCF) par branche | 2026-07-23 | 2026-07-23 |
| insee | CNA-2014-FBCF-SI | Formation brute de capital fixe (FBCF) par secteur institutionnel | 2026-07-23 | 2026-07-23 |
| insee | CNA-2014-RDB | Revenu et pouvoir d’achat des ménages | 2026-07-23 | 2026-07-23 |
| insee | CNA-2020-CONSO-MEN | Consommation des ménages | 2026-07-23 | 2026-07-23 |
| insee | CNA-2020-PIB | Produit intérieur brut (PIB) et ses composantes | 2026-07-23 | 2026-07-23 |
| insee | CNT-2014-CB | Comptes des branches | 2026-07-23 | 2026-07-23 |
| insee | CNT-2014-CSI | Comptes de secteurs institutionnels | 2026-07-23 | 2026-07-22 |
| insee | CNT-2014-OPERATIONS | Opérations sur biens et services | 2026-07-23 | 2026-07-23 |
| insee | CNT-2014-PIB-EQB-RF | Équilibre du produit intérieur brut | 2026-07-23 | 2026-07-23 |
| insee | CONSO-MENAGES-2020 | Consommation des ménages en biens | 2026-07-23 | 2026-07-23 |
| insee | ICA-2015-IND-CONS | Indices de chiffre d'affaires dans l'industrie et la construction | 2026-07-23 | 2026-07-23 |
| insee | conso-mensuelle | Consommation de biens, données mensuelles | 2026-07-23 | 2023-07-04 |
| insee | t_1101 | 1.101 – Le produit intérieur brut et ses composantes à prix courants (En milliards d'euros) | 2026-07-23 | 2022-01-02 |
| insee | t_1102 | 1.102 – Le produit intérieur brut et ses composantes en volume aux prix de l'année précédente chaînés (En milliards d'euros 2014) | 2026-07-23 | 2020-10-30 |
| insee | t_1105 | 1.105 – Produit intérieur brut - les trois approches à prix courants (En milliards d'euros) - t_1105 | 2026-07-23 | 2020-10-30 |
LAST_COMPILE
| LAST_COMPILE |
|---|
| 2026-07-24 |
variable
Code
t_conso_vol %>%
  left_join(variable, by = "variable") %>%
  group_by(variable, Variable) %>%
  summarise(Nobs = n()) %>%
  arrange(-Nobs) %>%
print_table_conditional| variable | Variable | Nobs |
|---|---|---|
| (CHTR) | Correction territoriale | 308 |
| (DE) à (C5) | Industrie | 308 |
| (FZ) à (RU) | Total services | 308 |
| (GZ) à (MN), (RU) | Services marchands | 308 |
| AZ | Produits agricoles | 308 |
| C | Produits manufacturés | 308 |
| C1 | Produits agro-alimentaires | 308 |
| C2 | Cokéfaction et raffinage | 308 |
| C3 | Biens d'équipement | 308 |
| C4 | Matériels de transport | 308 |
| C5 | Autres produits industriels | 308 |
| DE | Energie, eau, déchets | 308 |
| FZ | Construction | 308 |
| GZ | Commerce | 308 |
| HZ | Transport | 308 |
| IZ | Hébergement-restauration | 308 |
| JZ | Information-communication | 308 |
| KZ | Services financiers | 308 |
| LZ | Services immobiliers | 308 |
| MN | Services aux entreprises | 308 |
| OQ | Services non marchands | 308 |
| RU | Services aux ménages | 308 |
| TOTAL | Total | 308 |
date
Code
t_conso_vol %>%
  group_by(date) %>%
  summarise(Nobs = n()) %>%
  arrange(desc(date)) %>%
  print_table_conditional
Evolution
2017T2-
Code
t_conso_vol %>%
  left_join(variable, by = "variable") %>%
  filter(date %in% c(max(date), as.Date("2017-04-01"))) %>%
  spread(date, value) %>%
  mutate(change = round(100*(.[[4]]/.[[3]]-1), 2)) %>%
  arrange(-change) %>%
print_table_conditional(.)| variable | Variable | 2017-04-01 | 2025-10-01 | change |
|---|---|---|---|---|
| (CHTR) | Correction territoriale | -2.575 | -4.309 | 67.34 |
| IZ | Hébergement-restauration | 22.112 | 28.973 | 31.03 |
| MN | Services aux entreprises | 7.731 | 9.961 | 28.84 |
| C3 | Biens d'équipement | 8.187 | 10.254 | 25.25 |
| RU | Services aux ménages | 11.784 | 14.547 | 23.45 |
| JZ | Information-communication | 11.011 | 13.514 | 22.73 |
| (GZ) à (MN), (RU) | Services marchands | 146.053 | 172.783 | 18.30 |
| (FZ) à (RU) | Total services | 168.027 | 196.222 | 16.78 |
| LZ | Services immobiliers | 63.518 | 72.397 | 13.98 |
| KZ | Services financiers | 18.781 | 21.017 | 11.91 |
| FZ | Construction | 5.689 | 6.341 | 11.46 |
| HZ | Transport | 9.868 | 10.916 | 10.62 |
| TOTAL | Total | 308.649 | 330.802 | 7.18 |
| OQ | Services non marchands | 16.286 | 17.114 | 5.08 |
| GZ | Commerce | 1.252 | 1.315 | 5.03 |
| C5 | Autres produits industriels | 37.255 | 37.710 | 1.22 |
| C4 | Matériels de transport | 16.778 | 16.550 | -1.36 |
| C | Produits manufacturés | 120.348 | 117.751 | -2.16 |
| (DE) à (C5) | Industrie | 134.529 | 131.557 | -2.21 |
| DE | Energie, eau, déchets | 14.179 | 13.779 | -2.82 |
| C1 | Produits agro-alimentaires | 45.964 | 42.573 | -7.38 |
| C2 | Cokéfaction et raffinage | 12.019 | 10.836 | -9.84 |
| AZ | Produits agricoles | 8.704 | 7.722 | -11.28 |
2019T4-
Code
t_conso_vol %>%
  left_join(variable, by = "variable") %>%
  filter(date %in% c(max(date), as.Date("2019-10-01"))) %>%
  spread(date, value) %>%
  mutate(change = round(100*(.[[4]]/.[[3]]-1), 2)) %>%
  arrange(change) %>%
print_table_conditional(.)| variable | Variable | 2019-10-01 | 2025-10-01 | change |
|---|---|---|---|---|
| AZ | Produits agricoles | 8.514 | 7.722 | -9.30 |
| C2 | Cokéfaction et raffinage | 11.727 | 10.836 | -7.60 |
| C4 | Matériels de transport | 17.746 | 16.550 | -6.74 |
| C1 | Produits agro-alimentaires | 44.992 | 42.573 | -5.38 |
| C | Produits manufacturés | 121.754 | 117.751 | -3.29 |
| (DE) à (C5) | Industrie | 135.884 | 131.557 | -3.18 |
| DE | Energie, eau, déchets | 14.122 | 13.779 | -2.43 |
| GZ | Commerce | 1.345 | 1.315 | -2.23 |
| C5 | Autres produits industriels | 37.939 | 37.710 | -0.60 |
| OQ | Services non marchands | 16.616 | 17.114 | 3.00 |
| TOTAL | Total | 318.525 | 330.802 | 3.85 |
| HZ | Transport | 10.163 | 10.916 | 7.41 |
| FZ | Construction | 5.880 | 6.341 | 7.84 |
| LZ | Services immobiliers | 66.244 | 72.397 | 9.29 |
| KZ | Services financiers | 19.227 | 21.017 | 9.31 |
| (FZ) à (RU) | Total services | 177.153 | 196.222 | 10.76 |
| (GZ) à (MN), (RU) | Services marchands | 154.655 | 172.783 | 11.72 |
| C3 | Biens d'équipement | 9.093 | 10.254 | 12.77 |
| JZ | Information-communication | 11.845 | 13.514 | 14.09 |
| RU | Services aux ménages | 12.617 | 14.547 | 15.30 |
| IZ | Hébergement-restauration | 24.812 | 28.973 | 16.77 |
| MN | Services aux entreprises | 8.434 | 9.961 | 18.11 |
| (CHTR) | Correction territoriale | -3.050 | -4.309 | 41.28 |
2 years
Code
t_conso_vol %>%
  left_join(variable, by = "variable") %>%
  filter(date %in% c(max(date), max(date) - years(2))) %>%
  spread(date, value) %>%
  mutate(change = round(100*(.[[4]]/.[[3]]-1), 2)) %>%
  arrange(-change) %>%
print_table_conditional(.)| variable | Variable | 2023-10-01 | 2025-10-01 | change |
|---|---|---|---|---|
| (CHTR) | Correction territoriale | -2.924 | -4.309 | 47.37 |
| C3 | Biens d'équipement | 9.582 | 10.254 | 7.01 |
| RU | Services aux ménages | 13.830 | 14.547 | 5.18 |
| HZ | Transport | 10.435 | 10.916 | 4.61 |
| DE | Energie, eau, déchets | 13.259 | 13.779 | 3.92 |
| IZ | Hébergement-restauration | 27.895 | 28.973 | 3.86 |
| MN | Services aux entreprises | 9.610 | 9.961 | 3.65 |
| JZ | Information-communication | 13.049 | 13.514 | 3.56 |
| (GZ) à (MN), (RU) | Services marchands | 167.252 | 172.783 | 3.31 |
| (FZ) à (RU) | Total services | 190.717 | 196.222 | 2.89 |
| C2 | Cokéfaction et raffinage | 10.539 | 10.836 | 2.82 |
| LZ | Services immobiliers | 70.427 | 72.397 | 2.80 |
| KZ | Services financiers | 20.496 | 21.017 | 2.54 |
| AZ | Produits agricoles | 7.552 | 7.722 | 2.25 |
| TOTAL | Total | 326.215 | 330.802 | 1.41 |
| C5 | Autres produits industriels | 37.422 | 37.710 | 0.77 |
| OQ | Services non marchands | 17.018 | 17.114 | 0.56 |
| (DE) à (C5) | Industrie | 131.161 | 131.557 | 0.30 |
| C | Produits manufacturés | 117.926 | 117.751 | -0.15 |
| C1 | Produits agro-alimentaires | 43.241 | 42.573 | -1.54 |
| FZ | Construction | 6.468 | 6.341 | -1.96 |
| GZ | Commerce | 1.364 | 1.315 | -3.59 |
| C4 | Matériels de transport | 17.228 | 16.550 | -3.94 |
Last year
Code
t_conso_vol %>%
  left_join(variable, by = "variable") %>%
  filter(date %in% c(max(date), max(date) - years(1))) %>%
  spread(date, value) %>%
  mutate(change = round(100*(.[[4]]/.[[3]]-1), 2)) %>%
  arrange(-change) %>%
print_table_conditional(.)| variable | Variable | 2024-10-01 | 2025-10-01 | change |
|---|---|---|---|---|
| (CHTR) | Correction territoriale | -3.202 | -4.309 | 34.57 |
| C3 | Biens d'équipement | 9.809 | 10.254 | 4.54 |
| AZ | Produits agricoles | 7.496 | 7.722 | 3.01 |
| MN | Services aux entreprises | 9.705 | 9.961 | 2.64 |
| HZ | Transport | 10.649 | 10.916 | 2.51 |
| KZ | Services financiers | 20.635 | 21.017 | 1.85 |
| LZ | Services immobiliers | 71.413 | 72.397 | 1.38 |
| (GZ) à (MN), (RU) | Services marchands | 170.835 | 172.783 | 1.14 |
| (FZ) à (RU) | Total services | 194.334 | 196.222 | 0.97 |
| IZ | Hébergement-restauration | 28.751 | 28.973 | 0.77 |
| GZ | Commerce | 1.306 | 1.315 | 0.69 |
| C5 | Autres produits industriels | 37.484 | 37.710 | 0.60 |
| DE | Energie, eau, déchets | 13.748 | 13.779 | 0.23 |
| TOTAL | Total | 330.040 | 330.802 | 0.23 |
| C2 | Cokéfaction et raffinage | 10.823 | 10.836 | 0.12 |
| OQ | Services non marchands | 17.140 | 17.114 | -0.15 |
| (DE) à (C5) | Industrie | 131.771 | 131.557 | -0.16 |
| C | Produits manufacturés | 118.016 | 117.751 | -0.22 |
| FZ | Construction | 6.380 | 6.341 | -0.61 |
| RU | Services aux ménages | 14.653 | 14.547 | -0.72 |
| JZ | Information-communication | 13.668 | 13.514 | -1.13 |
| C1 | Produits agro-alimentaires | 43.065 | 42.573 | -1.14 |
| C4 | Matériels de transport | 16.906 | 16.550 | -2.11 |
Consommation, Services financiers
2017-
Code
t_conso_vol %>%
  filter(variable %in% c("AZ", "C1", "KZ"),
         date >= as.Date("2017-01-01")) %>%
  group_by(variable) %>%
  arrange(date) %>%
  mutate(value = 100*value/value[1]) %>%
  left_join(variable, by = "variable") %>%
  ggplot + geom_line(aes(x = date, y = value, color = Variable)) +
  theme_minimal() + ylab("Consommation trimestrielle") + xlab("") +
  theme(legend.title = element_blank(),
        legend.position = c(0.2, 0.3)) +
  scale_x_date(breaks = seq(1950, 2030, 1) %>% paste0("-01-01") %>% as.Date,
               labels = date_format("%Y")) +
  scale_y_log10(breaks = seq(70, 1000, 1))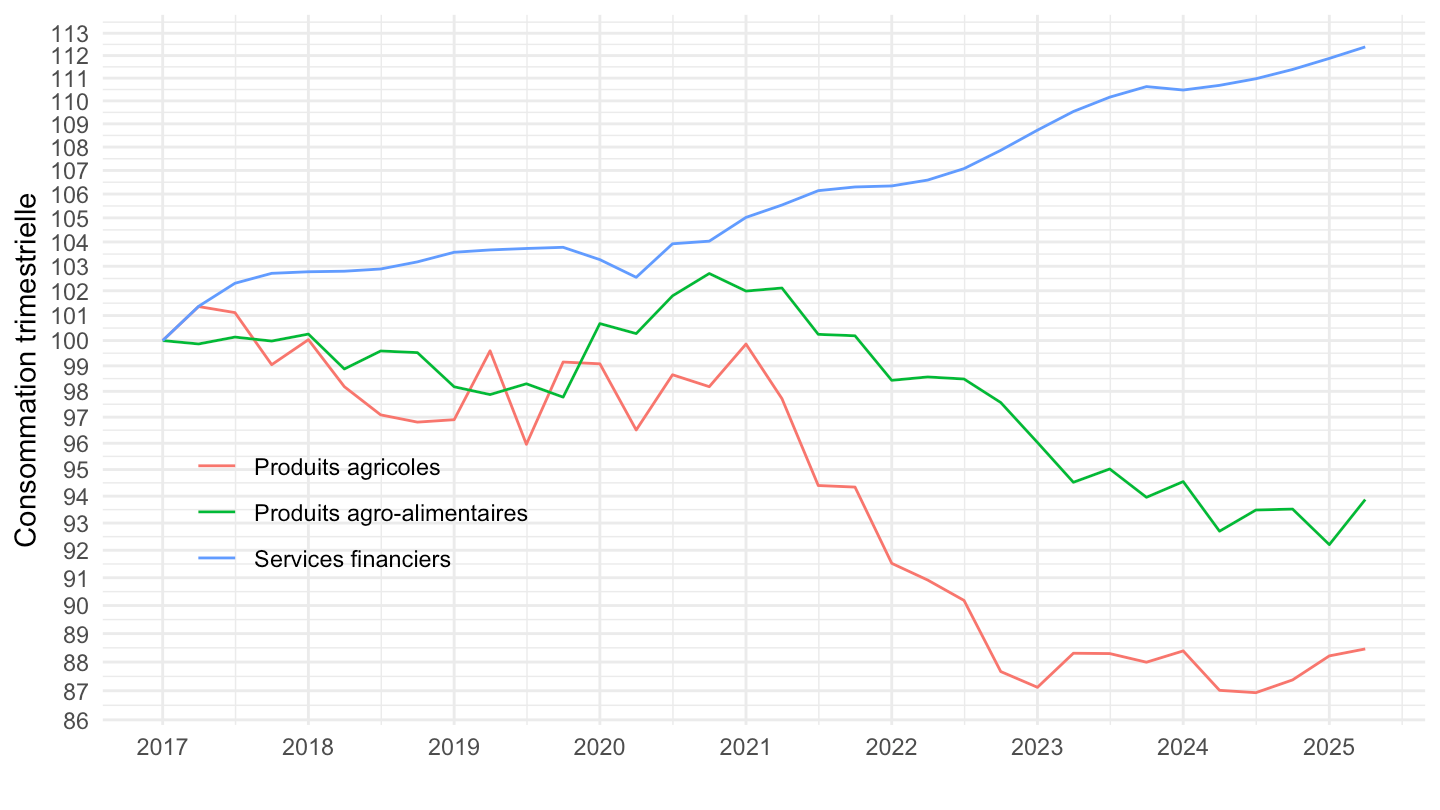
Produits agricoles
1949-
Code
t_conso_vol %>%
  filter(variable %in% c("AZ")) %>%
  group_by(variable) %>%
  arrange(date) %>%
  mutate(value = 100*value/value[1]) %>%
  left_join(variable, by = "variable") %>%
  ggplot + geom_line(aes(x = date, y = value)) +
  theme_minimal() + ylab("Consommation trimestrielle de produits agricoles") + xlab("") +
  theme(legend.title = element_blank(),
        legend.position = c(0.2, 0.9)) +
  scale_x_date(breaks = seq(1950, 2030, 5) %>% paste0("-01-01") %>% as.Date,
               labels = date_format("%Y")) +
  scale_y_log10(breaks = seq(100, 1000, 10))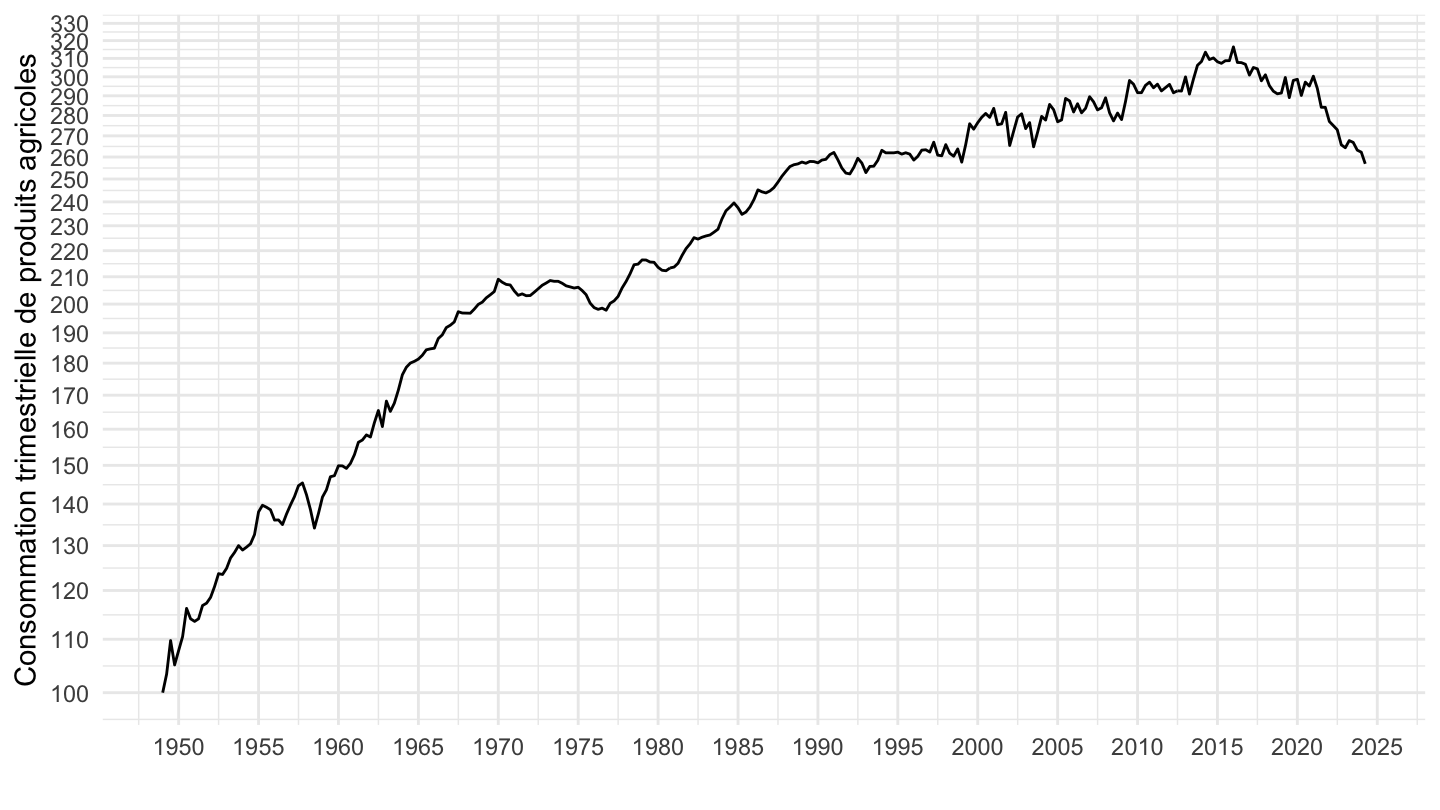
Alimentation, C1, Totale
1949-
Code
t_conso_vol %>%
  filter(variable %in% c("AZ", "C1", "(DE) à (C5)")) %>%
  group_by(variable) %>%
  arrange(date) %>%
  mutate(value = 100*value/value[1]) %>%
  left_join(variable, by = "variable") %>%
  ggplot + geom_line(aes(x = date, y = value, color = Variable)) +
  theme_minimal() + ylab("Consommation trimestrielle") + xlab("") +
  theme(legend.title = element_blank(),
        legend.position = c(0.7, 0.3)) +
  scale_x_date(breaks = seq(1950, 2030, 5) %>% paste0("-01-01") %>% as.Date,
               labels = date_format("%Y")) +
  scale_y_log10(breaks = seq(100, 1000, 50))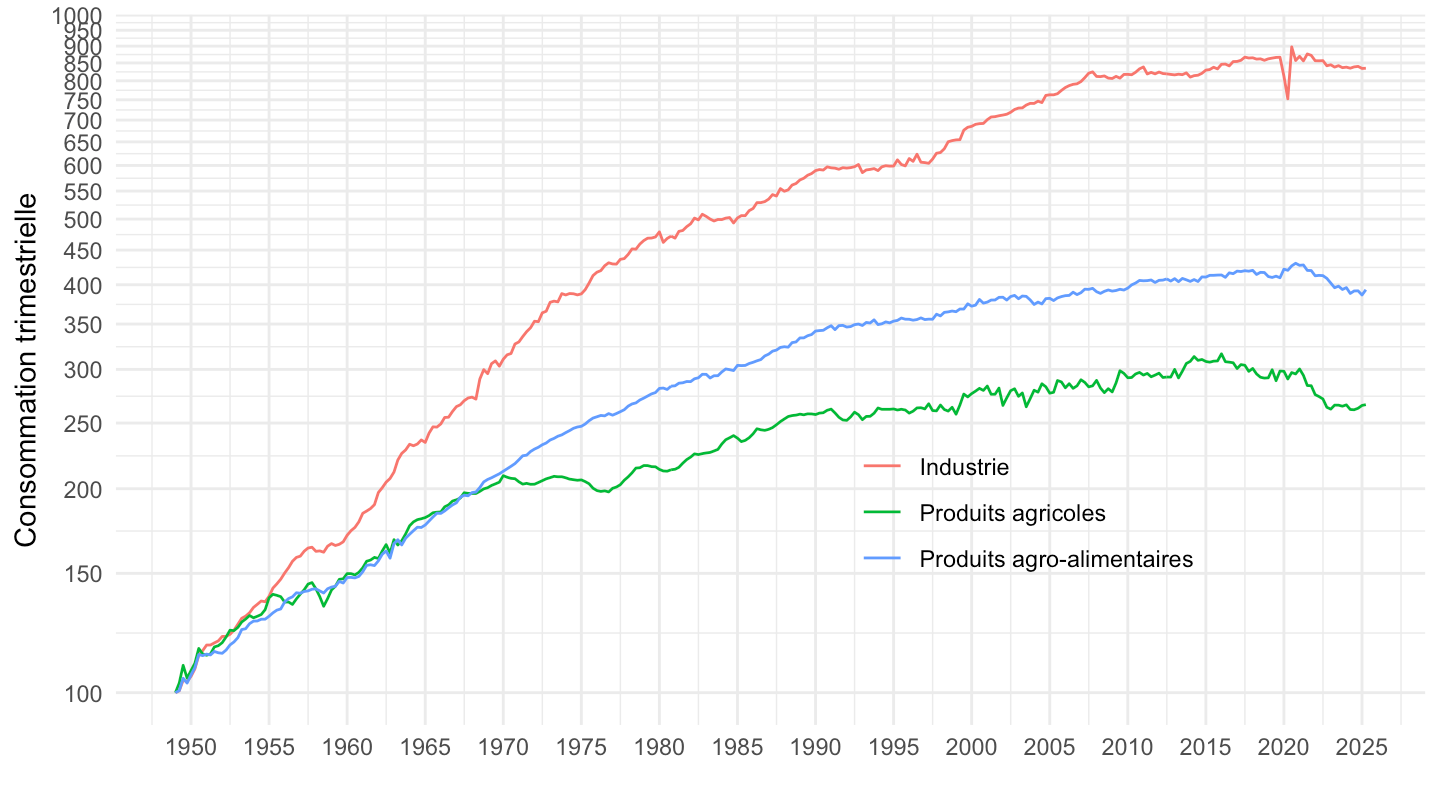
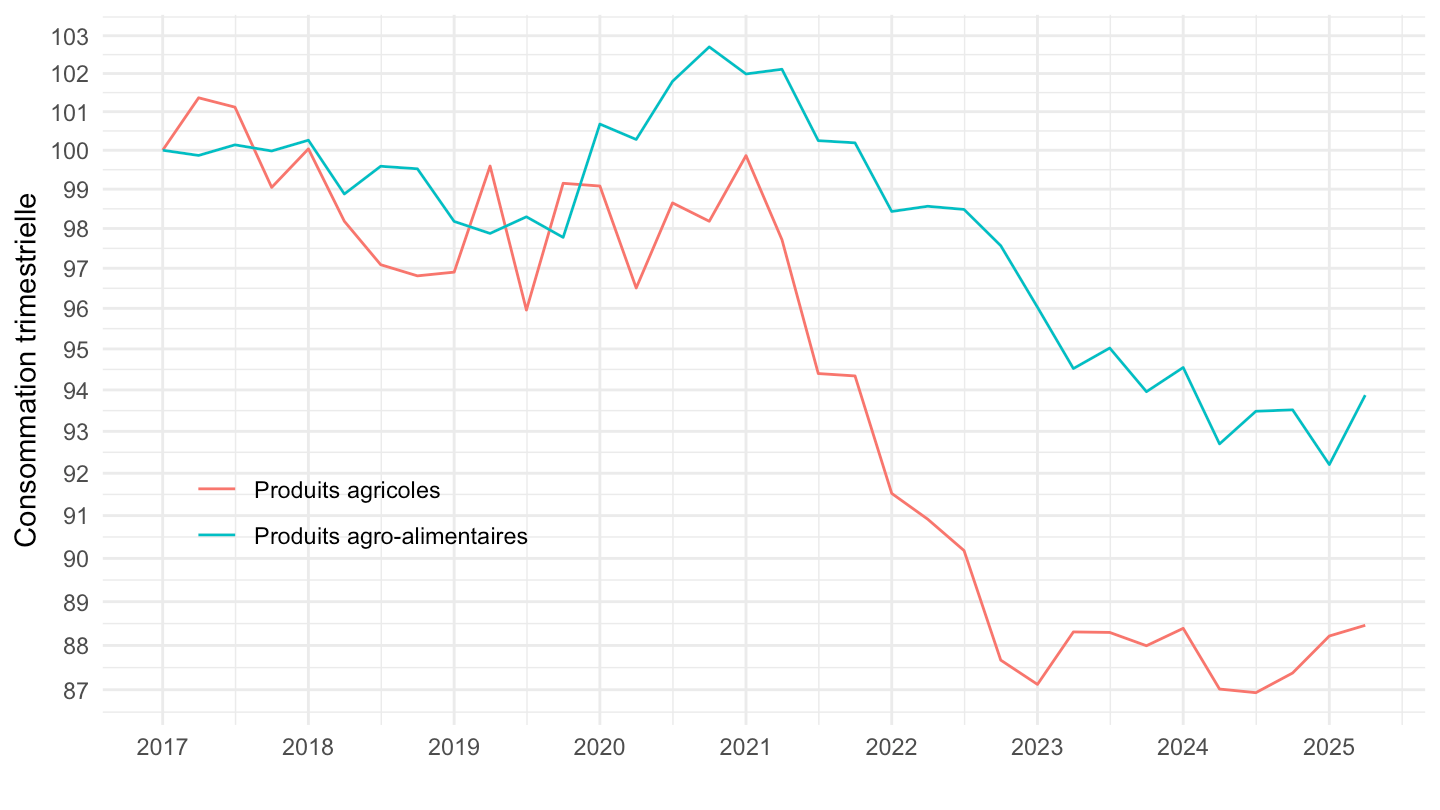
Consommation alimentaire
1949-
Code
t_conso_vol %>%
  filter(variable %in% c("AZ", "C1")) %>%
  group_by(variable) %>%
  arrange(date) %>%
  mutate(value = 100*value/value[1]) %>%
  left_join(variable, by = "variable") %>%
  ggplot + geom_line(aes(x = date, y = value, color = Variable)) +
  theme_minimal() + ylab("Consommation trimestrielle") + xlab("") +
  theme(legend.title = element_blank(),
        legend.position = c(0.7, 0.3)) +
  scale_x_date(breaks = seq(1950, 2030, 5) %>% paste0("-01-01") %>% as.Date,
               labels = date_format("%Y")) +
  scale_y_log10(breaks = seq(100, 1000, 50))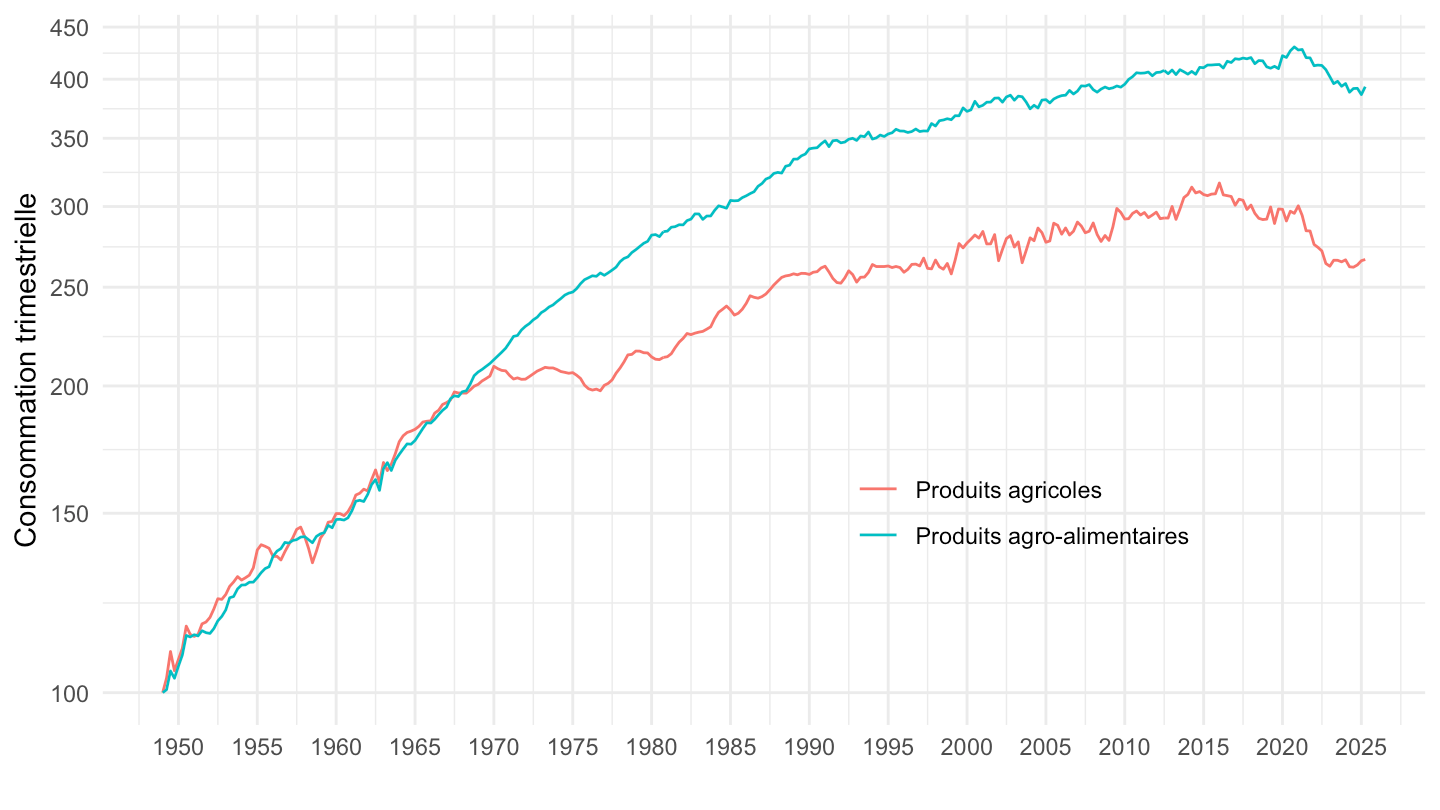
2010-
Code
t_conso_vol %>%
  filter(variable %in% c("AZ", "C1"),
         date >= as.Date("2010-01-01")) %>%
  group_by(variable) %>%
  arrange(date) %>%
  mutate(value = 100*value/value[1]) %>%
  left_join(variable, by = "variable") %>%
  ggplot + geom_line(aes(x = date, y = value, color = Variable)) +
  theme_minimal() + ylab("Consommation trimestrielle") + xlab("") +
  theme(legend.title = element_blank(),
        legend.position = c(0.2, 0.3)) +
  scale_x_date(breaks = seq(1950, 2030, 1) %>% paste0("-01-01") %>% as.Date,
               labels = date_format("%Y")) +
  scale_y_log10(breaks = seq(70, 1000, 1))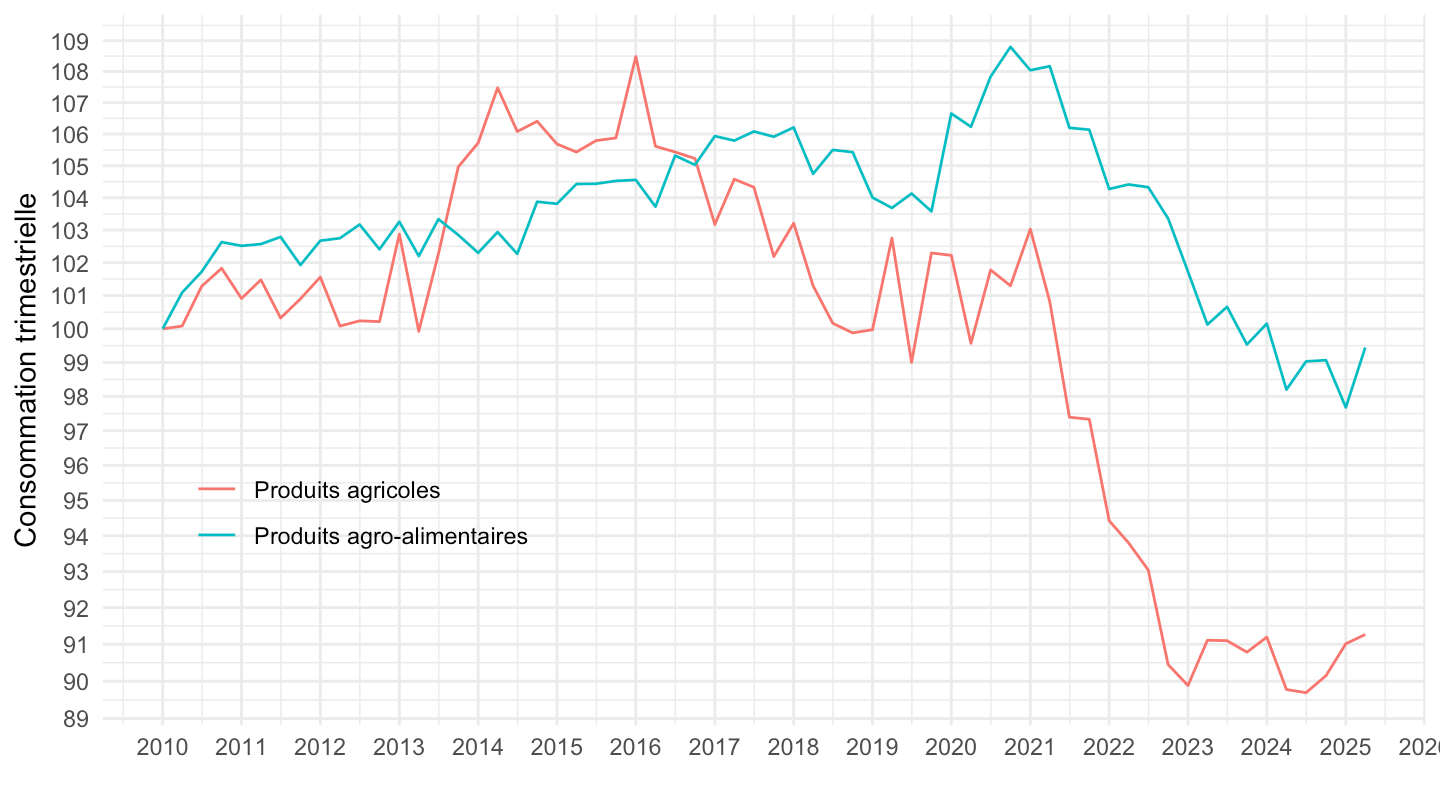
2017-
Code
t_conso_vol %>%
  filter(variable %in% c("AZ", "C1"),
         date >= as.Date("2017-01-01")) %>%
  group_by(variable) %>%
  arrange(date) %>%
  mutate(value = 100*value/value[1]) %>%
  left_join(variable, by = "variable") %>%
  ggplot + geom_line(aes(x = date, y = value, color = Variable)) +
  theme_minimal() + ylab("Consommation trimestrielle") + xlab("") +
  theme(legend.title = element_blank(),
        legend.position = c(0.2, 0.3)) +
  scale_x_date(breaks = seq(1950, 2030, 1) %>% paste0("-01-01") %>% as.Date,
               labels = date_format("%Y")) +
  scale_y_log10(breaks = seq(70, 1000, 1))