
Last observation: sept. 2026 (N = 3)
First observation: janv. 1977 (N = 1)
Last data update: 15 oct. 2026, 23:04
Last compile: 16 oct. 2026, 01:25
`CLIMAT-AFFAIRES` |>
  filter(INDICATEUR == "RETOURNEMENT") |>

  month_to_date() |>
  ggplot() + theme_minimal() + ylab("INDICATEUR de retournement conjoncturel") + xlab("") +
  geom_line(aes(x = date, y = OBS_VALUE, color = INDICATEUR)) +
  scale_x_date(breaks = seq(1920, 2100, 5) |> paste0("-01-01") |> as.Date(),
               labels = date_format("%Y")) +
  theme(legend.position = c(0.3, 0.2),
        legend.title = element_blank()) +
  scale_y_continuous(breaks = seq(10, 200, 5))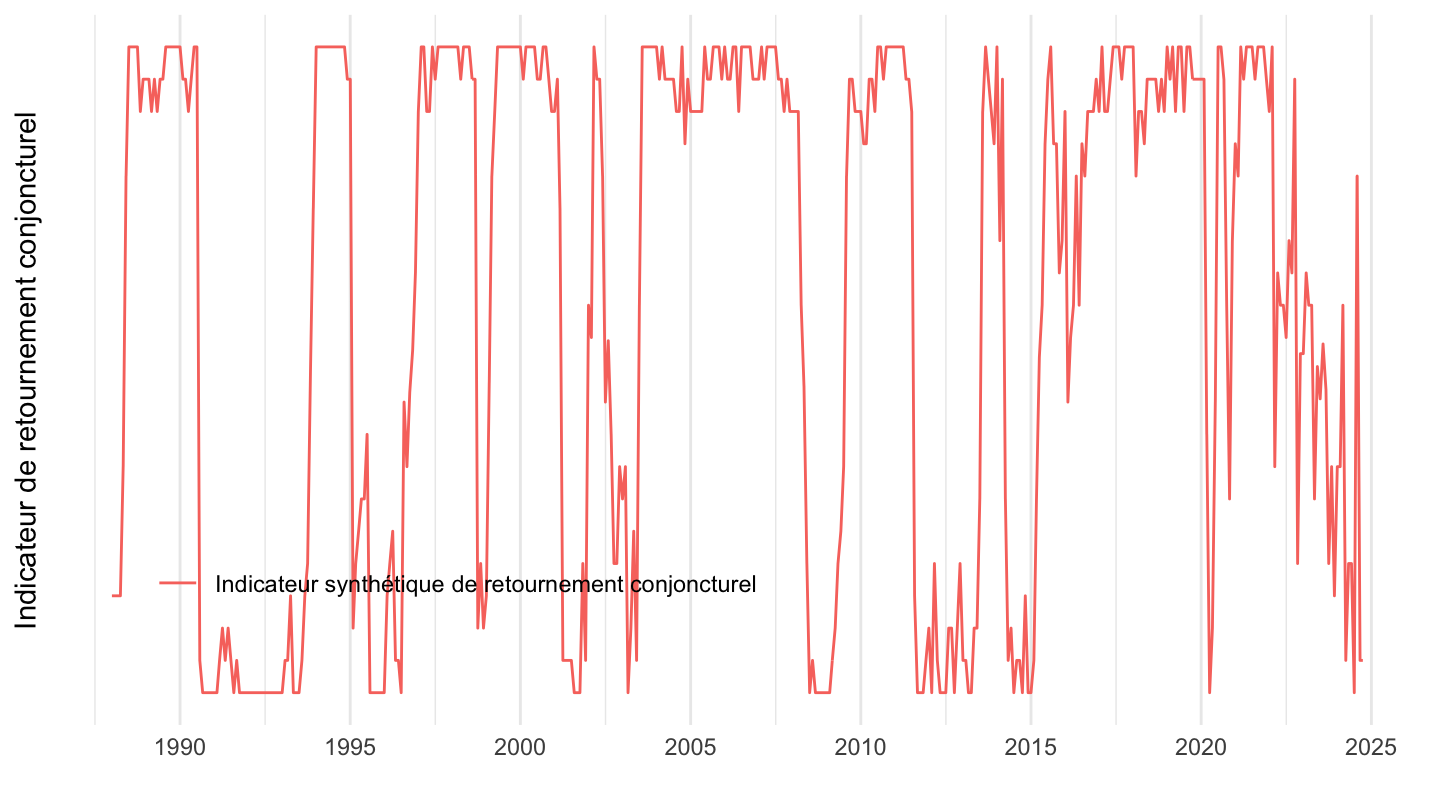
`CLIMAT-AFFAIRES` |>
  filter(INDICATEUR == "RETOURNEMENT") |>

  month_to_date() |>
  filter(date >+ as.Date("2006-01-01")) |>
  ggplot() + theme_minimal() + ylab("Indicateur synthétique de retournement conjoncturel") + xlab("") +
  geom_line(aes(x = date, y = OBS_VALUE)) +
  scale_x_date(breaks = seq(1920, 2100, 2) |> paste0("-01-01") |> as.Date(),
               labels = date_format("%Y")) +
  theme(legend.position = c(0.3, 0.2),
        legend.title = element_blank()) +
  scale_y_continuous(breaks = seq(-1, 1, 0.1))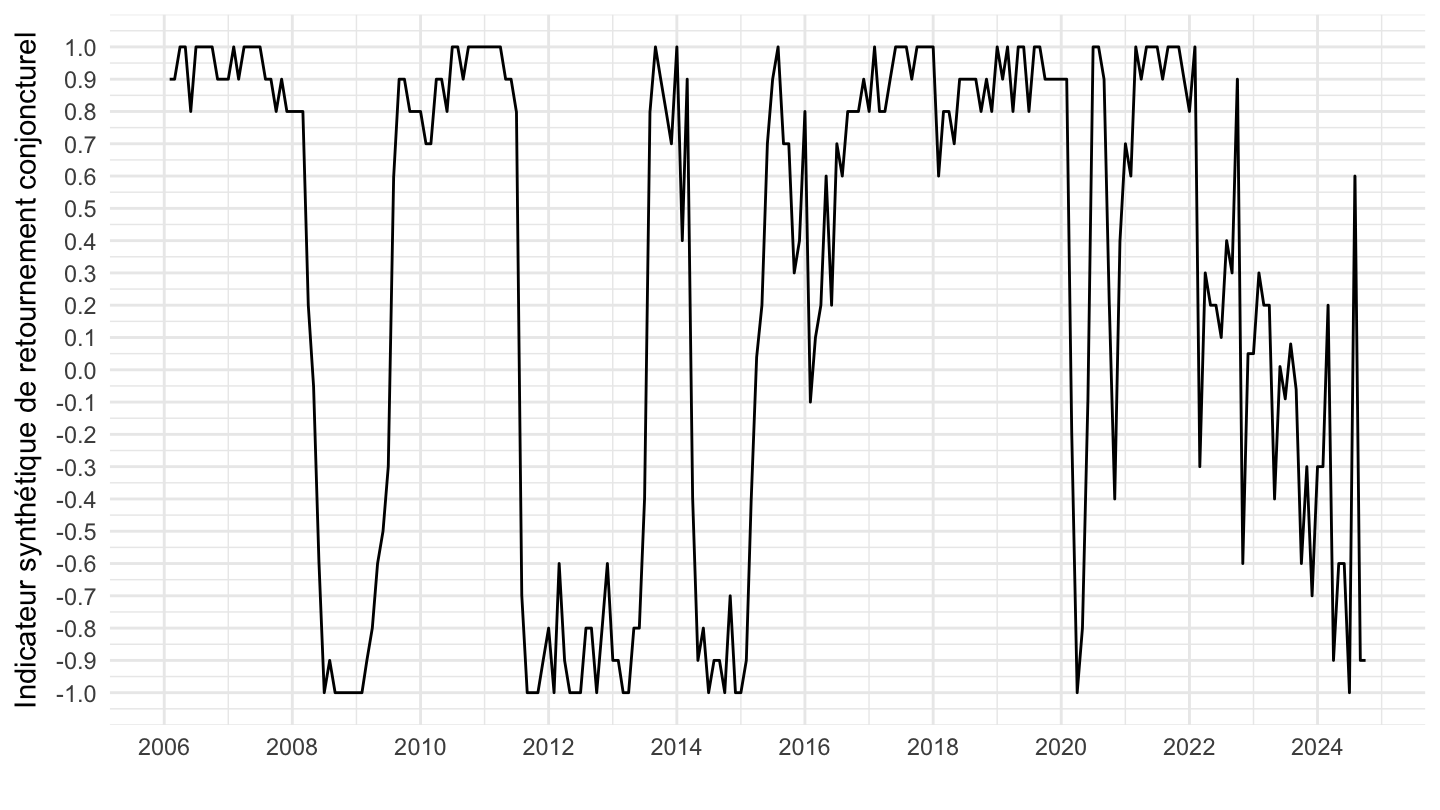
`CLIMAT-AFFAIRES` |>
  filter(INDICATEUR != "RETOURNEMENT") |>

  month_to_date() |>
  ggplot() + theme_minimal() + ylab("INDICATEUR synthétique du climat") + xlab("") +
  geom_line(aes(x = date, y = OBS_VALUE, color = INDICATEUR)) +
  scale_x_date(breaks = seq(1920, 2100, 5) |> paste0("-01-01") |> as.Date(),
               labels = date_format("%Y")) +
  theme(legend.position = c(0.3, 0.2),
        legend.title = element_blank()) +
  scale_y_log10(breaks = seq(10, 200, 5))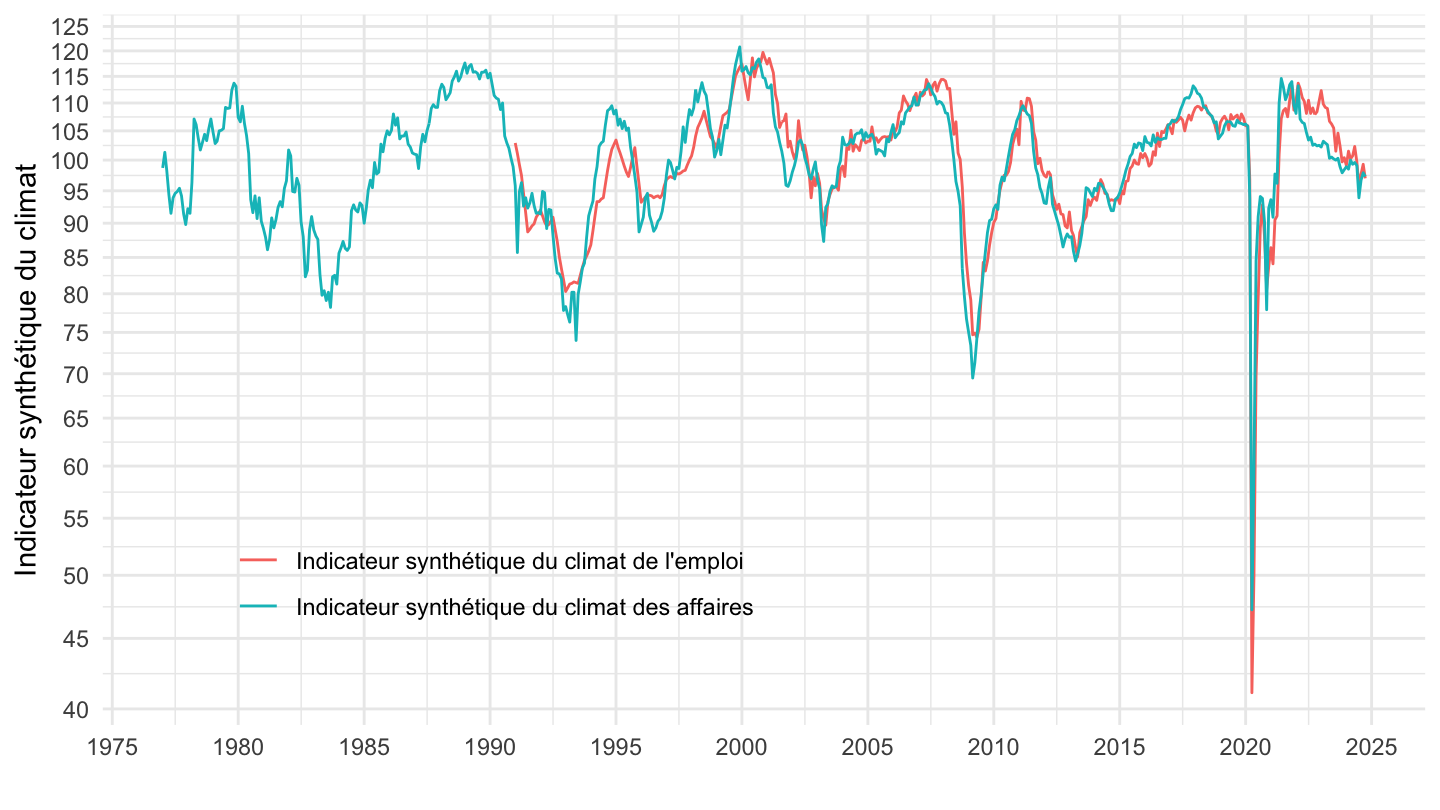
`CLIMAT-AFFAIRES` |>
  filter(INDICATEUR != "RETOURNEMENT") |>

  month_to_date() |>
  filter(date >= as.Date("1995-01-01")) |>
  ggplot() + theme_minimal() + ylab("INDICATEUR synthétique du climat") + xlab("") +
  geom_line(aes(x = date, y = OBS_VALUE, color = INDICATEUR)) +
  scale_x_date(breaks = seq(1920, 2100, 2) |> paste0("-01-01") |> as.Date(),
               labels = date_format("%Y")) +
  theme(legend.position = c(0.25, 0.2),
        legend.title = element_blank()) +
  scale_y_log10(breaks = seq(10, 200, 5)) +
  geom_hline(yintercept = 100, linetype = "dashed")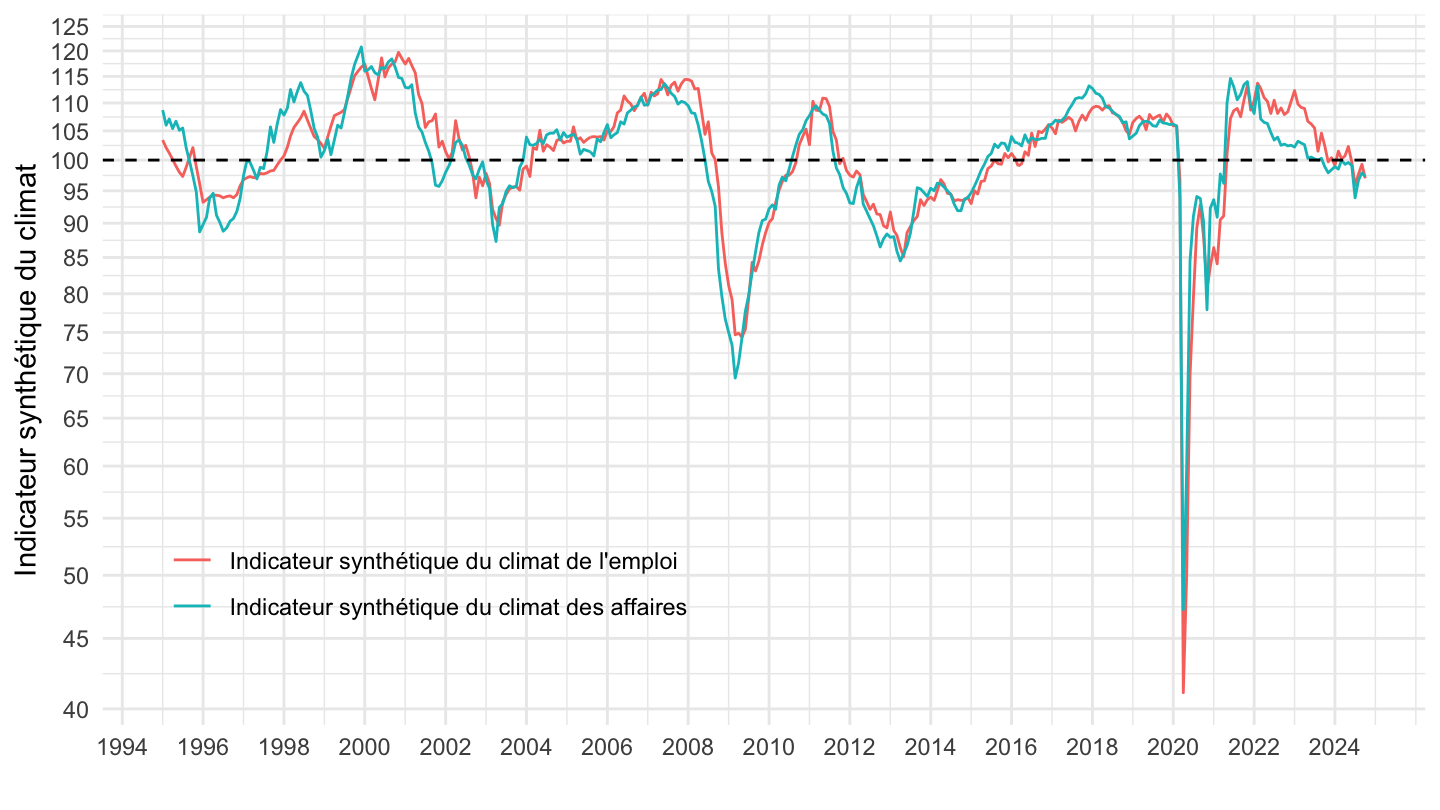
`CLIMAT-AFFAIRES` |>
  filter(INDICATEUR != "RETOURNEMENT") |>

  month_to_date() |>
  filter(date >= as.Date("2005-01-01")) |>
  mutate(OBS_VALUE = ifelse(year(date) == 2020 & month(date) %in% c(3, 4, 5, 6), NA, OBS_VALUE)) |>
  ggplot() + theme_minimal() + ylab("INDICATEUR synthétique du climat\n hors Mars-Juin 2020") + xlab("") +
  geom_line(aes(x = date, y = OBS_VALUE, color = INDICATEUR)) +
  scale_x_date(breaks = seq(1920, 2100, 2) |> paste0("-01-01") |> as.Date(),
               labels = date_format("%Y")) +
  theme(legend.position = c(0.6, 0.15),
        legend.title = element_blank()) +
  scale_y_log10(breaks = seq(10, 200, 5)) +
  geom_hline(yintercept = 100, linetype = "dashed") +
  geom_rect(data = data_frame(start = as.Date("2020-02-01"),
                                end = as.Date("2020-07-01")),
              aes(xmin = start, xmax = end, ymin = 0, ymax = +Inf), fill = viridis(4)[4], alpha = 0.2)
`CLIMAT-AFFAIRES` |>
  filter(INDICATEUR != "RETOURNEMENT") |>

  month_to_date() |>
  filter(date >= as.Date("2017-04-01")) |>
  ggplot() + theme_minimal() + ylab("INDICATEUR synthétique du climat") + xlab("") +
  geom_line(aes(x = date, y = OBS_VALUE, color = INDICATEUR)) +
  scale_x_date(breaks = seq(1920, 2100, 1) |> paste0("-01-01") |> as.Date(),
               labels = date_format("%Y")) +
  theme(legend.position = c(0.25, 0.2),
        legend.title = element_blank()) +
  scale_y_log10(breaks = seq(10, 200, 5)) +
  geom_hline(yintercept = 100, linetype = "dashed")
| source | dataset | Title | Updated |
|---|---|---|---|

