Companies Observatory

Data - Banque de France

🇫🇷 Version française

Info

Structure

NULL

source dataset Title .html .rData
bdf DIREN Observatoire des Entreprises 2026-08-09 2026-08-08

Data on the French macroeconomy

source dataset Title .html .rData
bdf CFT Comptes Financiers Trimestriels 2026-08-09 2026-07-24
insee CNA-2014-CONSO-SI Dépenses de consommation finale par secteur institutionnel 2026-08-09 2026-08-09
insee CNA-2014-CSI Comptes des secteurs institutionnels 2026-08-09 2026-08-09
insee CNA-2014-FBCF-BRANCHE Formation brute de capital fixe (FBCF) par branche 2026-08-09 2026-08-09
insee CNA-2014-FBCF-SI Formation brute de capital fixe (FBCF) par secteur institutionnel 2026-08-09 2026-08-09
insee CNA-2014-RDB Revenu et pouvoir d’achat des ménages 2026-08-09 2026-08-09
insee CNA-2020-CONSO-MEN Consommation des ménages 2026-08-09 2026-07-23
insee CNA-2020-PIB Produit intérieur brut (PIB) et ses composantes 2026-08-09 2026-08-09
insee CNT-2014-CB Comptes des branches 2026-08-09 2026-08-09
insee CNT-2014-CSI Comptes de secteurs institutionnels 2026-08-09 2026-08-09
insee CNT-2014-OPERATIONS Opérations sur biens et services 2026-08-09 2026-08-09
insee CNT-2014-PIB-EQB-RF Équilibre du produit intérieur brut 2026-08-09 2026-08-09
insee CONSO-MENAGES-2020 Consommation des ménages en biens 2026-08-09 2026-08-09
insee ICA-2015-IND-CONS Indices de chiffre d'affaires dans l'industrie et la construction 2026-08-09 2026-08-09
insee conso-mensuelle Consommation de biens, données mensuelles 2026-08-09 2026-08-02
insee t_1101 1.101 – Le produit intérieur brut et ses composantes à prix courants (En milliards d'euros) 2026-08-09 2026-08-02
insee t_1102 1.102 – Le produit intérieur brut et ses composantes en volume aux prix de l'année précédente chaînés (En milliards d'euros 2014) 2026-08-09 2026-08-02
insee t_1105 1.105 – Produit intérieur brut - les trois approches à prix courants (En milliards d'euros) - t_1105 2026-08-09 2026-08-02

LAST_COMPILE

LAST_COMPILE
2026-08-10

Last

date Nobs
2026-06-30 669

Methodology

Code
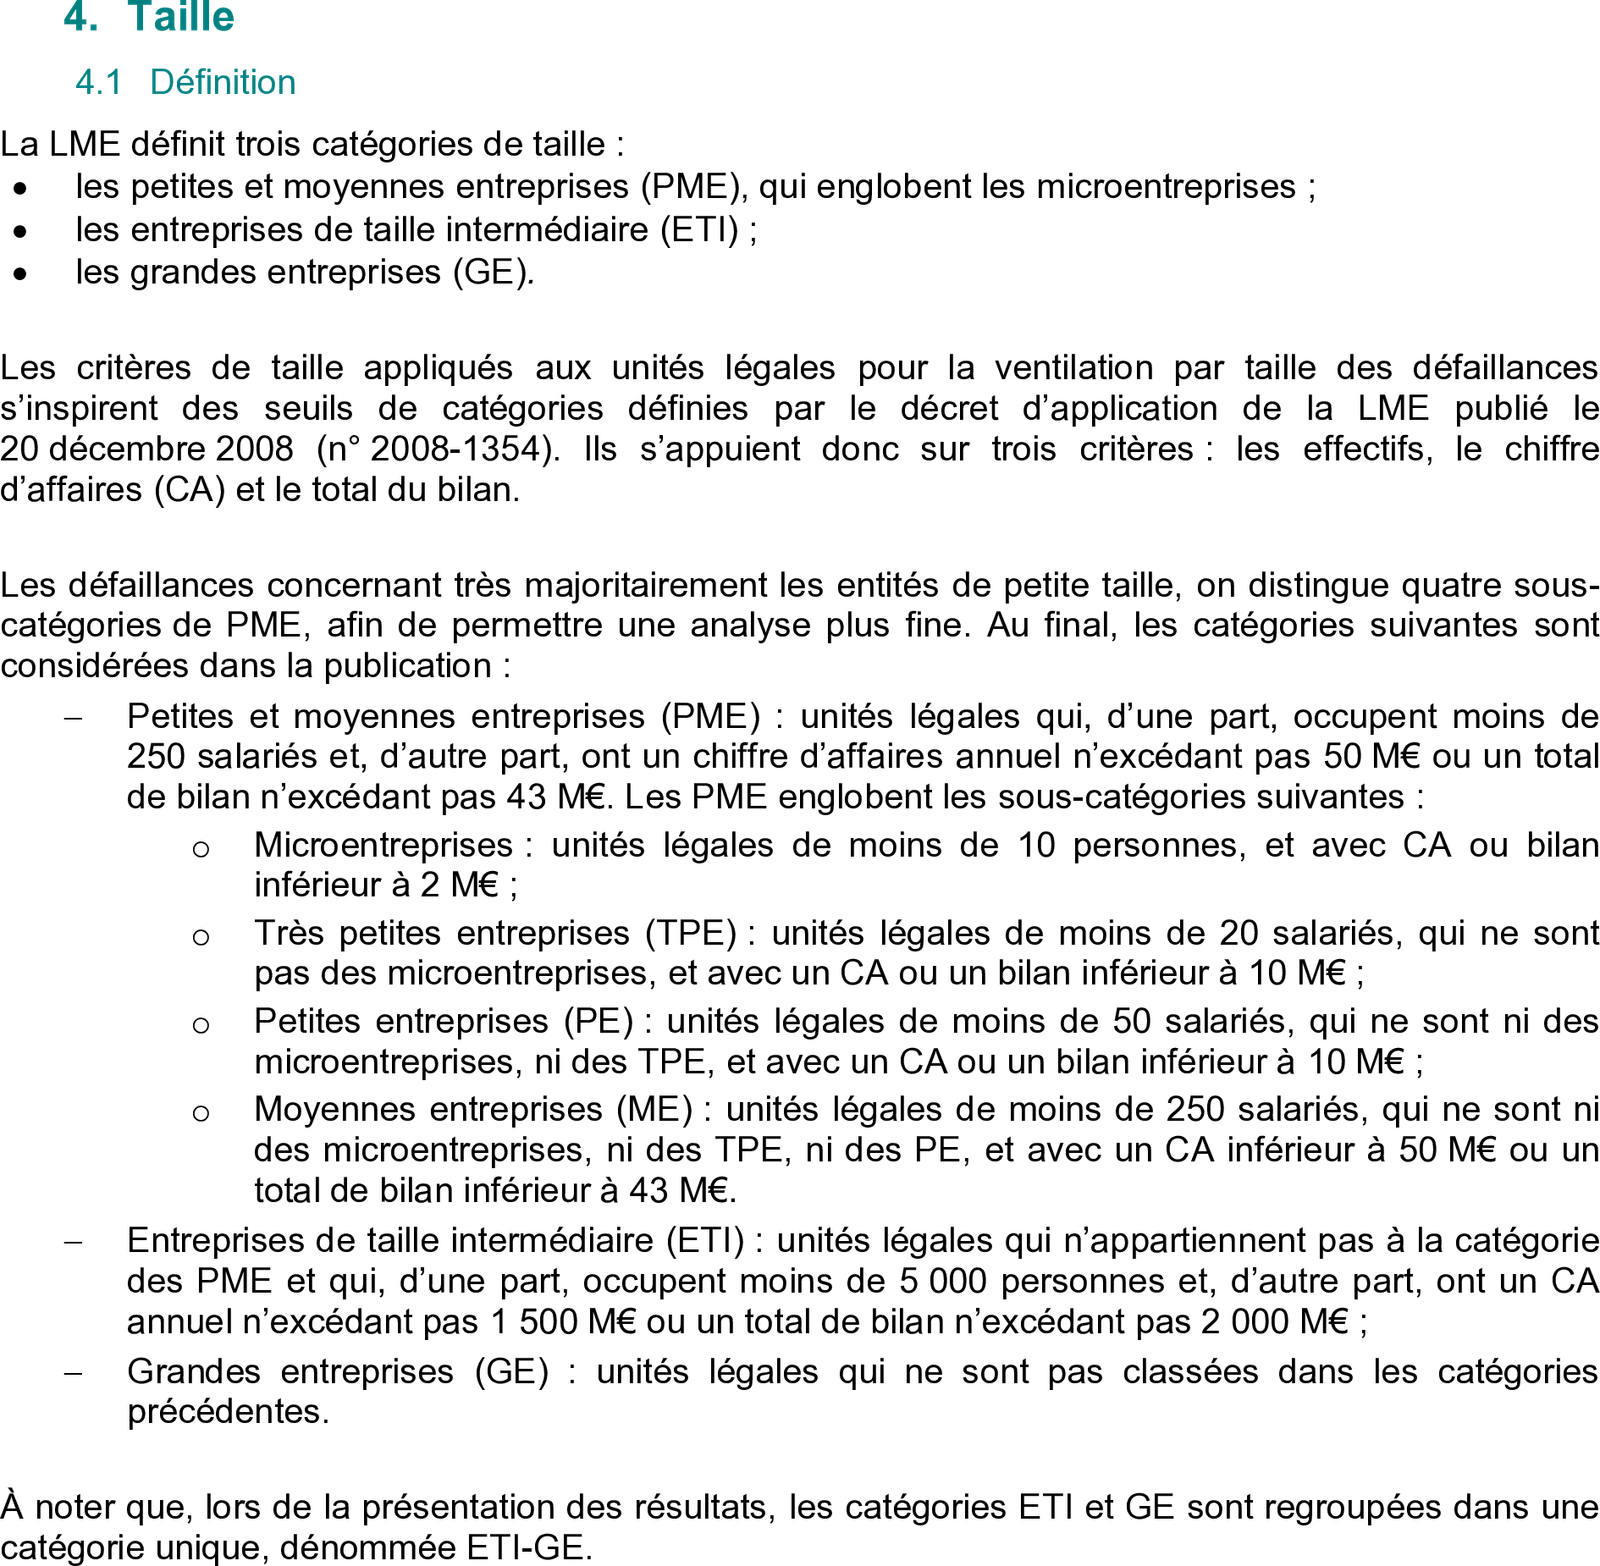
ig_b("bdf", "methode_stat_info_defaillances_9-juin-2016", "taille")

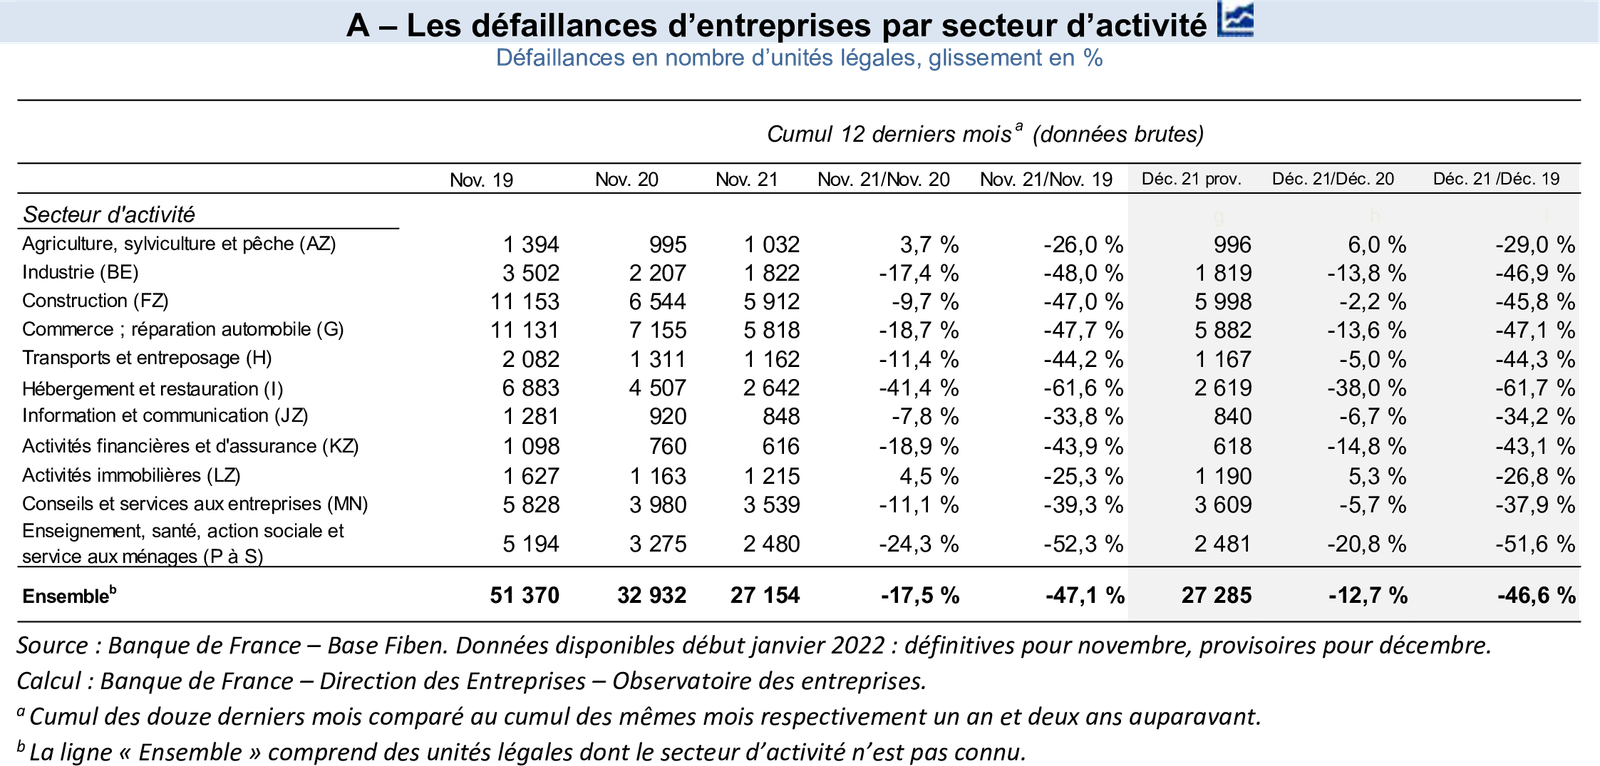
Monthly monitoring of business failures

December 2021

Code
ig_b("bdf", "def_ent_2244_fr_si_defaillances_202112_fr_vfinale", "defaillances-par-secteur")

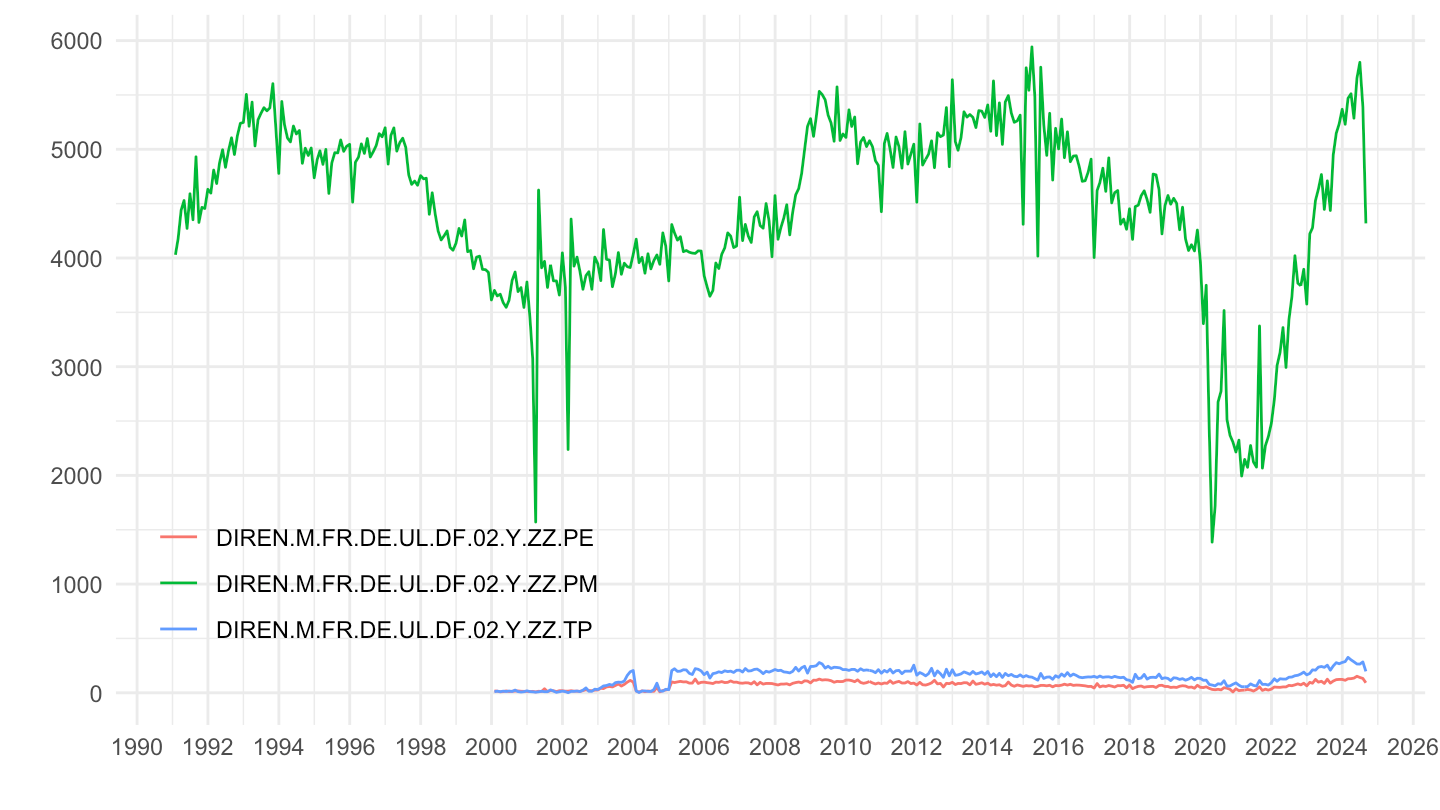
By month (02)

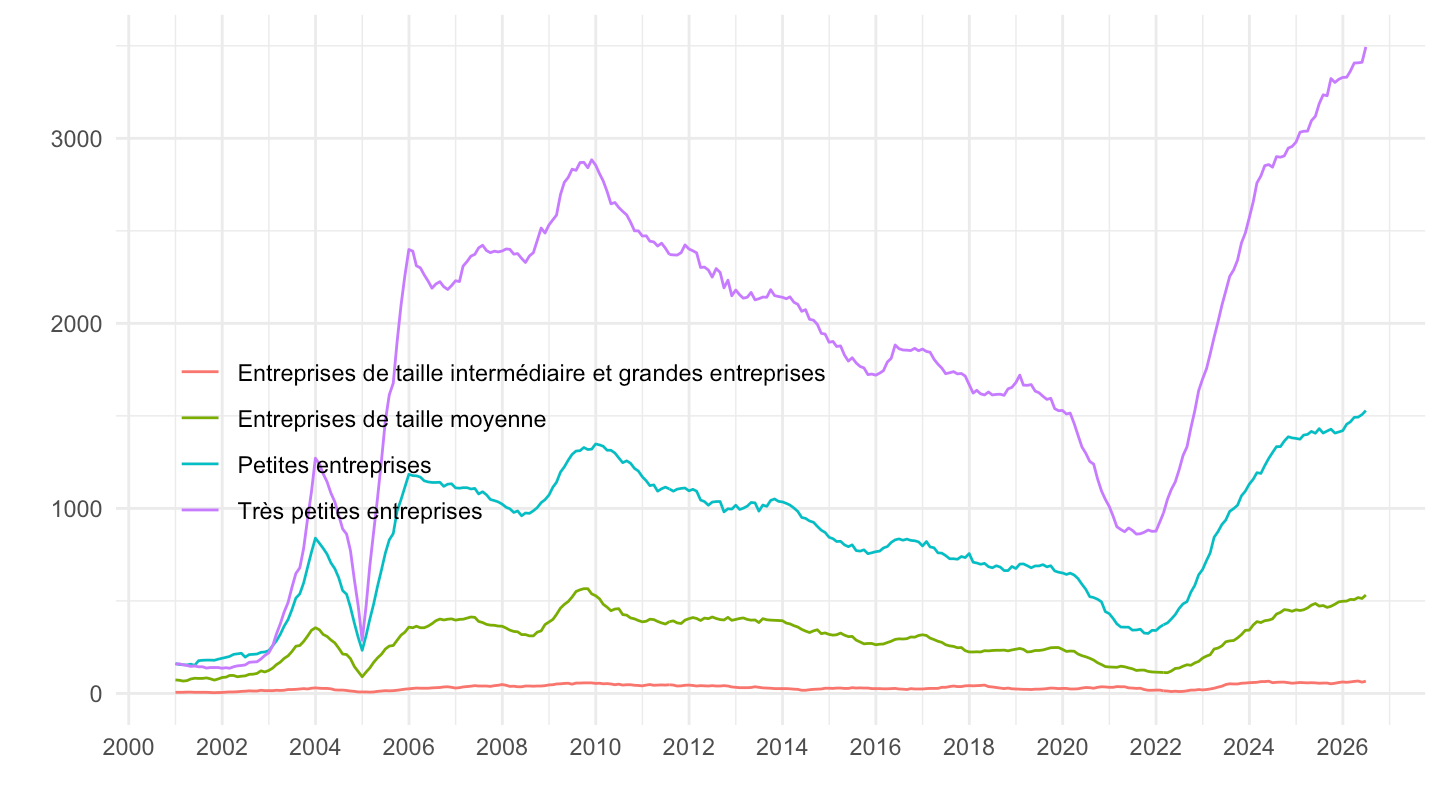
PE, TP, GE

Code
DIREN |>
  filter(variable %in% c("DIREN.M.FR.DE.UL.DF.02.Y.ZZ.TP",
                         "DIREN.M.FR.DE.UL.DF.02.Y.ZZ.PM",
                         "DIREN.M.FR.DE.UL.DF.02.Y.ZZ.GE",
                         "DIREN.M.FR.DE.UL.DF.02.Y.ZZ.PE")) |>
  ggplot() + geom_line(aes(x = date, y = value, color = variable)) +
  theme_minimal() + xlab("") + ylab("") +
  scale_x_date(breaks = seq(1960, 2100, 2) |> paste0("-01-01") |> as.Date(),
               labels = date_format("%Y")) +
  theme(legend.position = c(0.2, 0.2),
        legend.title = element_blank()) +
  scale_y_continuous(breaks = seq(0, 10000, 1000))

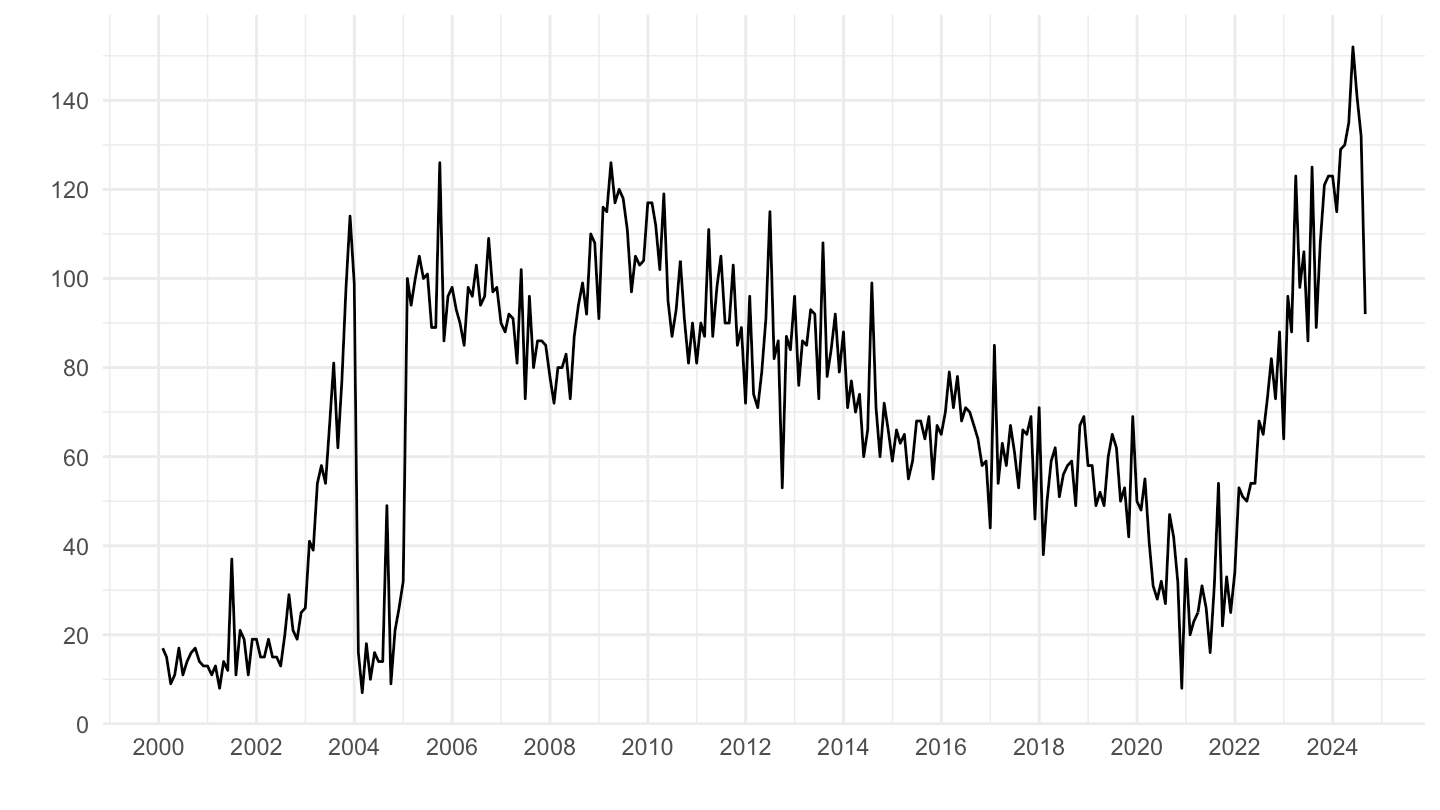
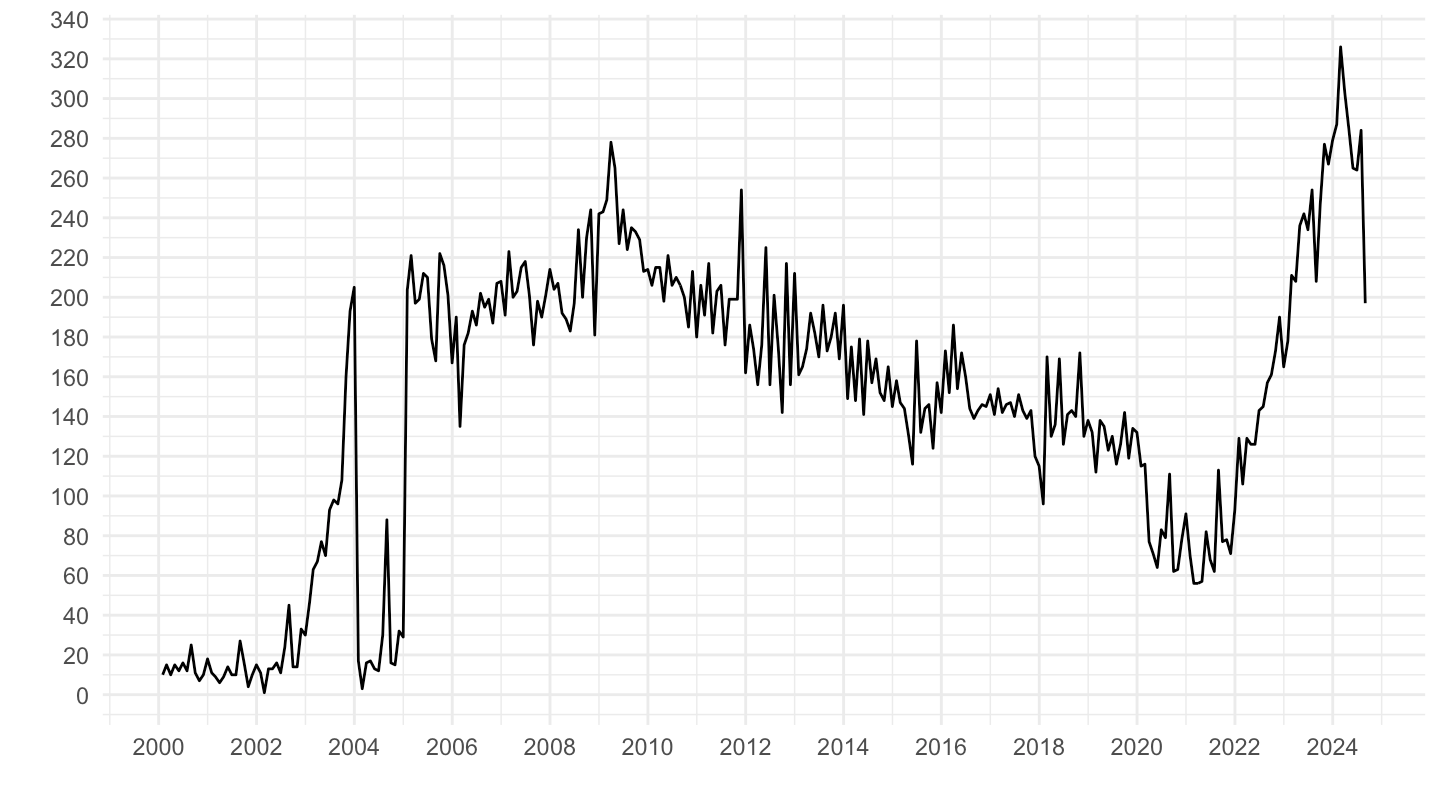
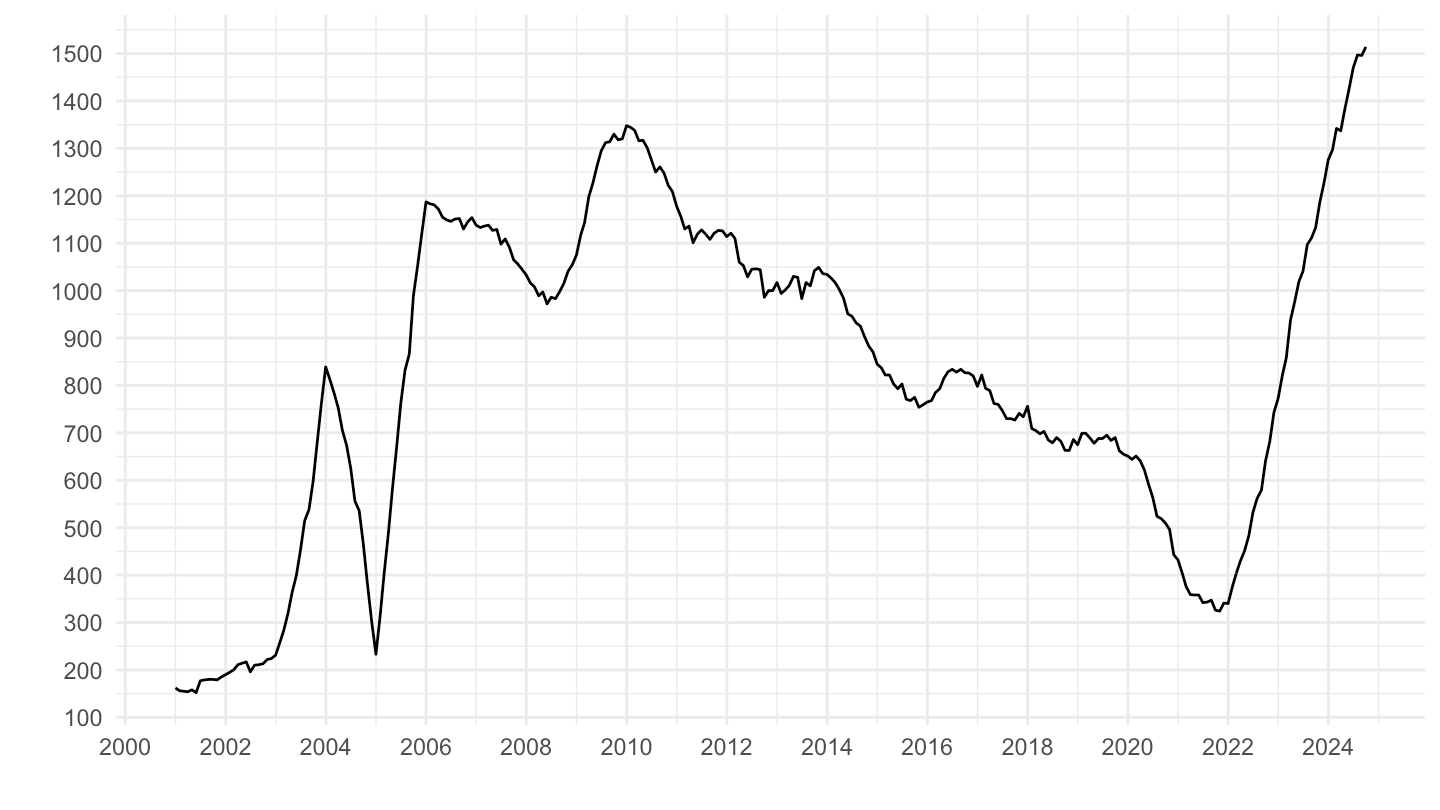
PE - Small enterprises

Code
DIREN |>
  filter(variable %in% c("DIREN.M.FR.DE.UL.DF.02.Y.ZZ.PE")) |>
  ggplot() + geom_line(aes(x = date, y = value)) +
  theme_minimal() + xlab("") + ylab("") +
  scale_x_date(breaks = seq(1960, 2100, 2) |> paste0("-01-01") |> as.Date(),
               labels = date_format("%Y")) +
  scale_y_continuous(breaks = seq(0, 500, 20))

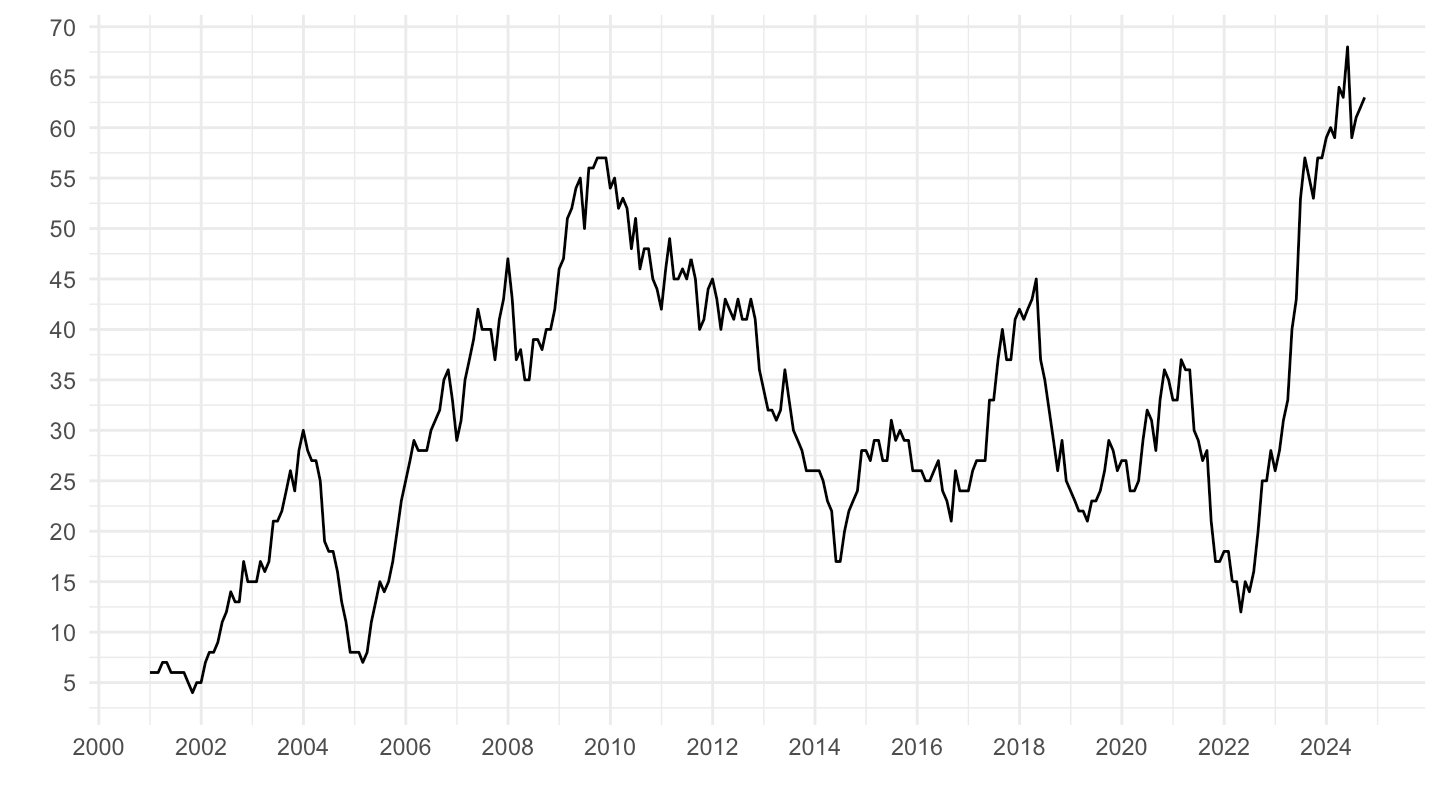
TP - Very small enterprises

Code
DIREN |>
  filter(variable %in% c("DIREN.M.FR.DE.UL.DF.02.Y.ZZ.TP")) |>
  ggplot() + geom_line(aes(x = date, y = value)) +
  theme_minimal() + xlab("") + ylab("") +
  scale_x_date(breaks = seq(1960, 2100, 2) |> paste0("-01-01") |> as.Date(),
               labels = date_format("%Y")) +
  scale_y_continuous(breaks = seq(0, 500, 20))

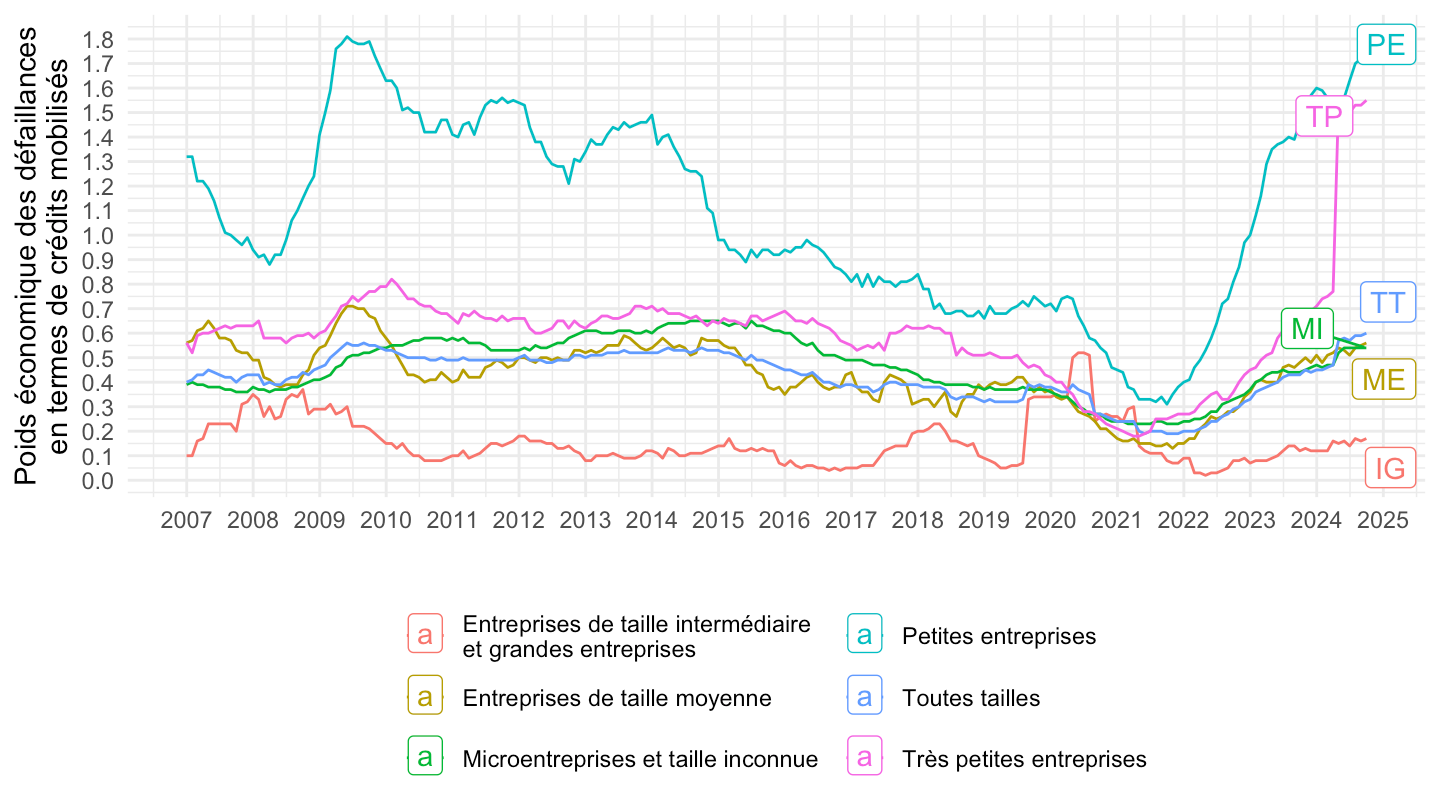
PC - Economic weight of business failures in terms of credit outstanding

Code
DIREN |>

  filter(DIREN_OBJET == "PC",
         !(DIREN_TAILLENT %in% c("NP", "PG", "PY", "GE"))) %>%
  left_join(DIREN_TAILLENT, by = "DIREN_TAILLENT") |>
  select_if(~ n_distinct(.) > 1) |>
  arrange(desc(date)) |>
  mutate(Diren_taillent = str_wrap(Diren_taillent, width = 35)) |>
  ggplot() + geom_line(aes(x = date, y = value, color = Diren_taillent)) +
  theme_minimal() + xlab("") + ylab("Economic weight of business failures\nin terms of credit outstanding") +
  scale_x_date(breaks = seq(1960, 2100, 1) |> paste0("-01-01") |> as.Date(),
               labels = date_format("%Y")) +
  scale_y_continuous(breaks = seq(0, 2, 0.1)) +
  theme(legend.position = "bottom",
        legend.title = element_blank()) + guides(color = guide_legend(ncol = 2)) +
  geom_label_repel(data = . %>% group_by(Diren_taillent) %>% filter(date == max(date)),
                   aes(x = date, y = value, color = Diren_taillent, label = DIREN_TAILLENT))

12-month cumulative (03)

All

No exclusions

Code
DIREN |>

  filter(REF_AREA == "FR",
         DIREN_THECO == "DE",
         DIREN_MESURE == "03",
         DIREN_SECTACT == "ZZ",
         DIREN_OBJET == "DF") %>%
  left_join(DIREN_TAILLENT, by = "DIREN_TAILLENT") |>
  select_if(~ n_distinct(.) > 1) |>
  ggplot() + geom_line(aes(x = date, y = value, color = Diren_taillent)) +
  theme_minimal() + xlab("") + ylab("") +
  scale_x_date(breaks = seq(1960, 2100, 2) |> paste0("-01-01") |> as.Date(),
               labels = date_format("%Y")) +
  theme(legend.position = c(0.3, 0.3),
        legend.title = element_blank())

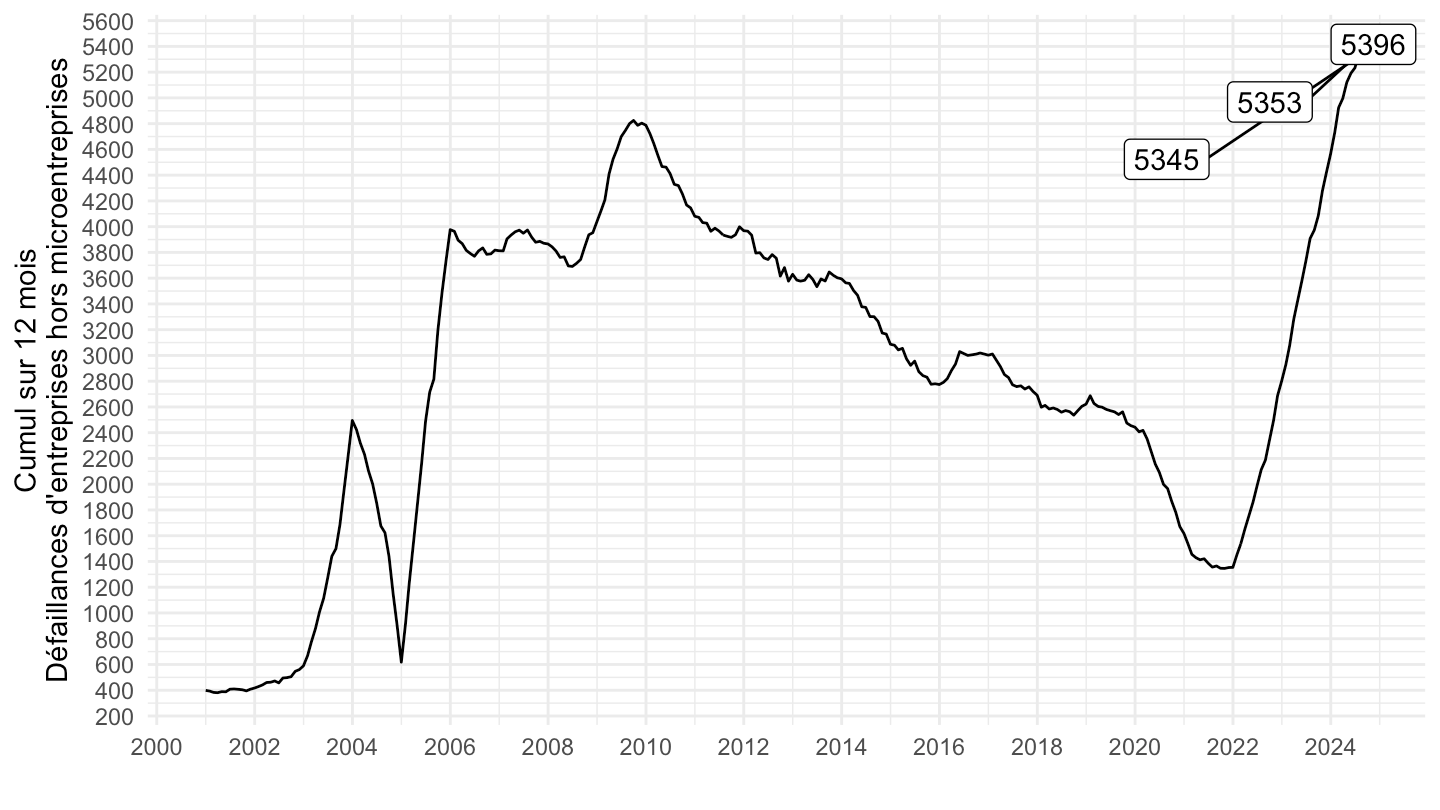
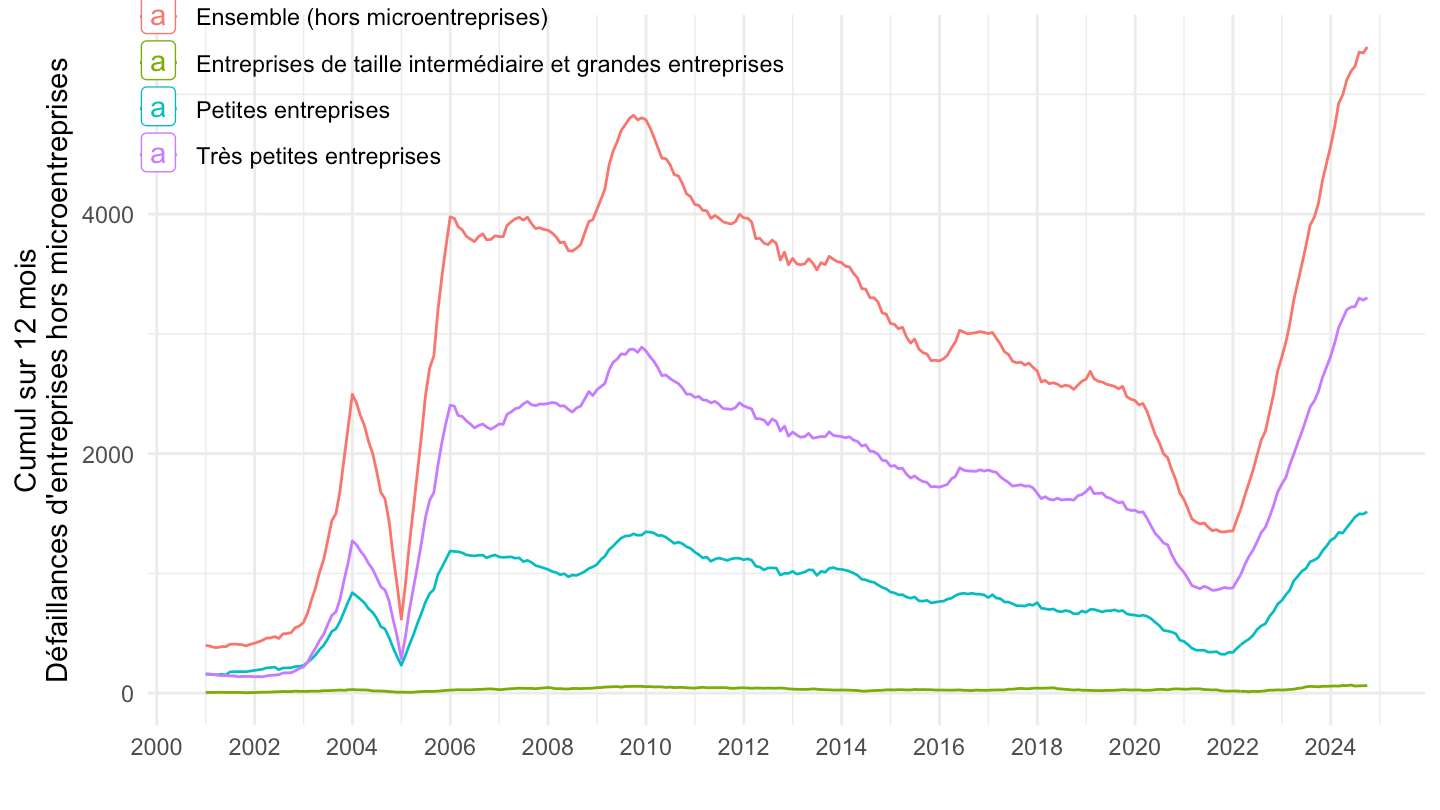
Excluding microenterprises

Code
data_TTMI <- DIREN |>

  filter(REF_AREA == "FR",
         DIREN_THECO == "DE",
         DIREN_MESURE == "03",
         DIREN_SECTACT == "ZZ",
         DIREN_OBJET == "DF",
         DIREN_TAILLENT %in% c("TT", "MI")) %>%
  select_if(~ n_distinct(.) > 1) |>
  select(DIREN_TAILLENT, date, value) |>
  spread(DIREN_TAILLENT, value) |>
  na.omit() |>
  mutate(value = `TT` - `MI`) |>
  select(-`TT`, -`MI`) |>
  mutate(DIREN_TAILLENT = "TT-MI", Diren_taillent = "All (excluding microenterprises)")

data_TTMI |>
  ggplot() + geom_line(aes(x = date, y = value)) +
  theme_minimal() + xlab("") + ylab("12-month cumulative\nBusiness failures excluding microenterprises") +
  scale_x_date(breaks = seq(1960, 2100, 2) |> paste0("-01-01") |> as.Date(),
               labels = date_format("%Y")) +
  scale_y_continuous(breaks = seq(0, 10000, 200)) +
  geom_label_repel(data = . %>% arrange(-value) %>% head(3), aes(x = date, y = value, label = value))

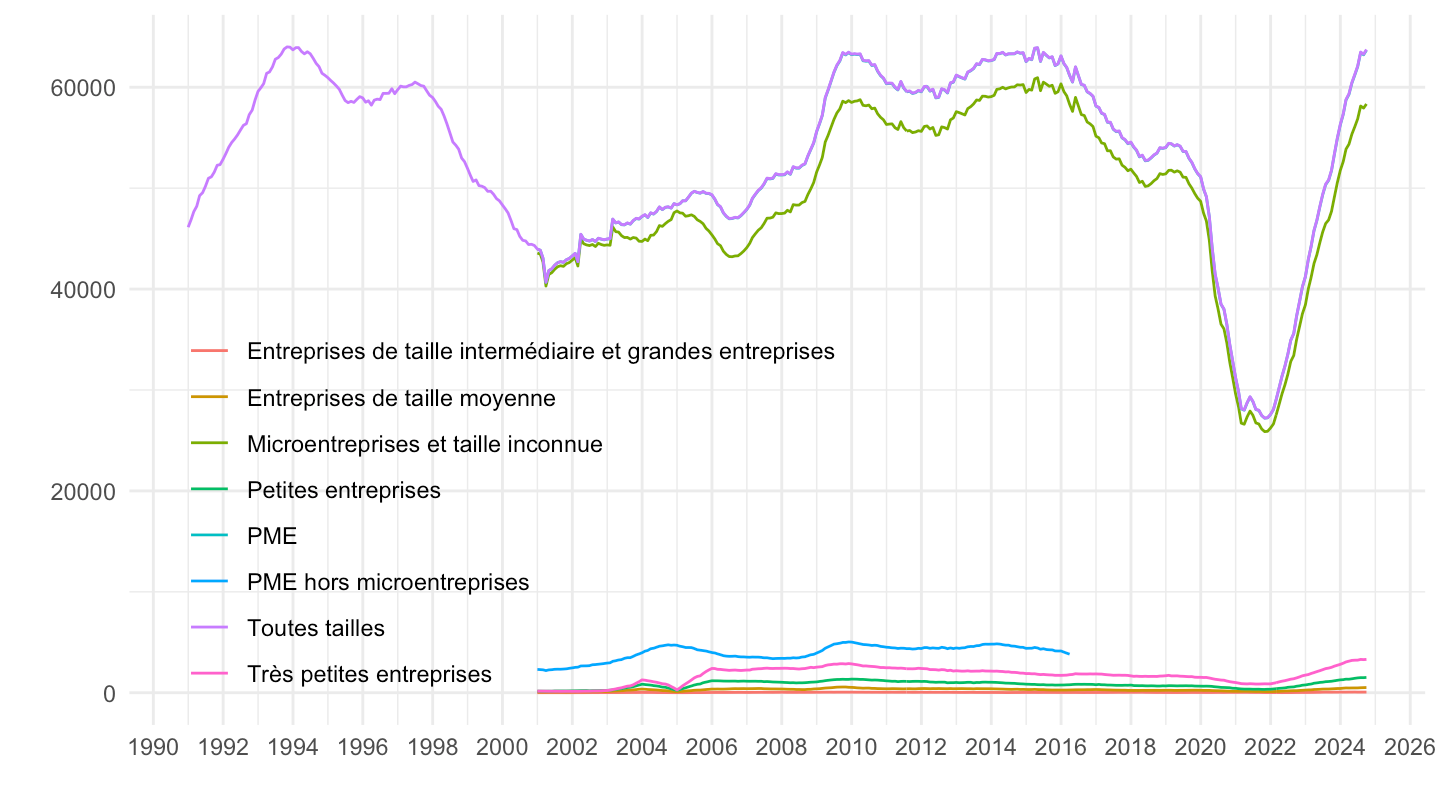
Number of failures

Code
DIREN |>

  filter(REF_AREA == "FR",
         DIREN_THECO == "DE",
         DIREN_MESURE == "03",
         DIREN_SECTACT == "ZZ",
         DIREN_OBJET == "DF",
         !(DIREN_TAILLENT %in% c("TT", "MI", "PM"))) %>%
  left_join(DIREN_TAILLENT, by = "DIREN_TAILLENT") |>
  select_if(~ n_distinct(.) > 1) |>
  ggplot() + geom_line(aes(x = date, y = value, color = Diren_taillent)) +
  theme_minimal() + xlab("") + ylab("") +
  scale_x_date(breaks = seq(1960, 2100, 2) |> paste0("-01-01") |> as.Date(),
               labels = date_format("%Y")) +
  theme(legend.position = c(0.3, 0.4),
        legend.title = element_blank())

Number of failures

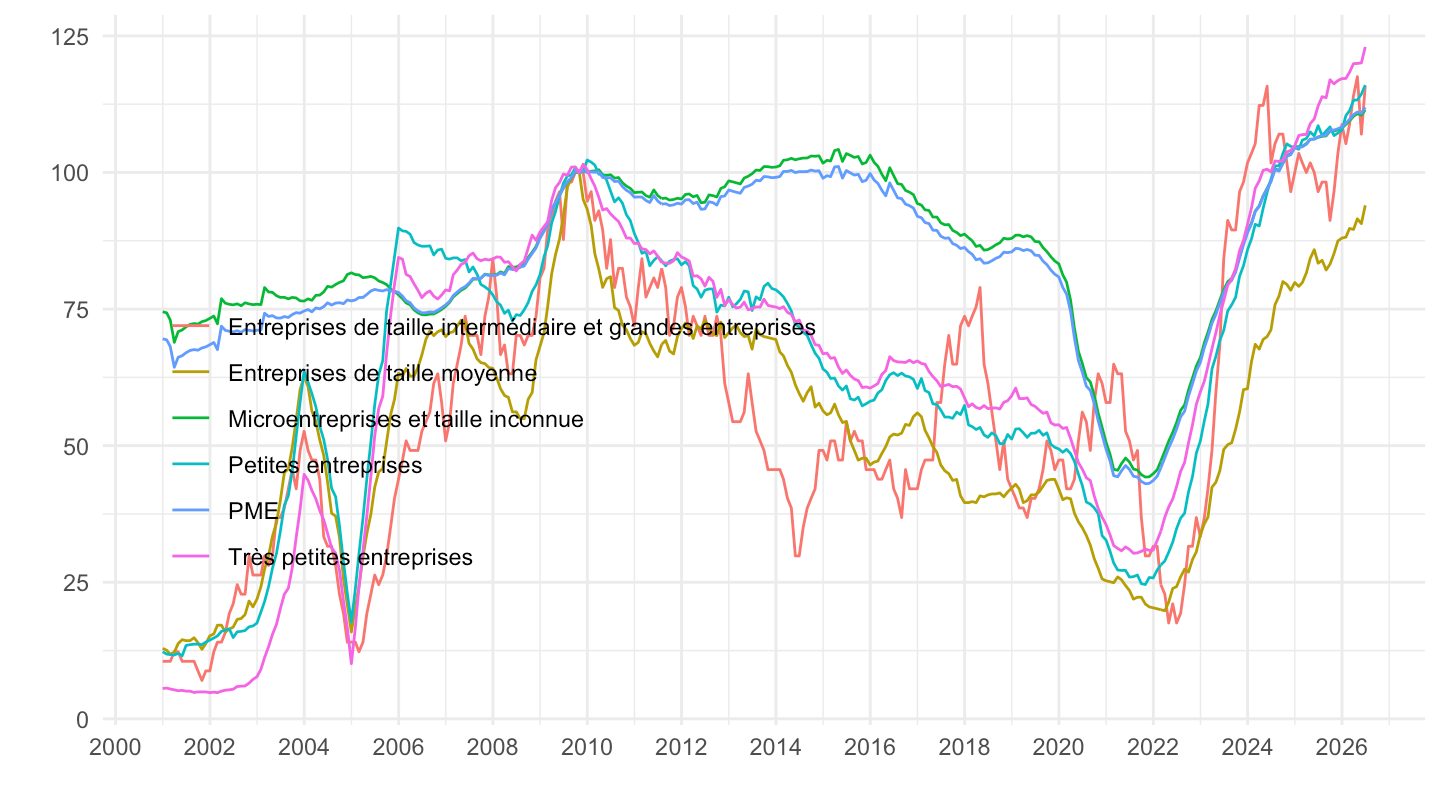
Why was the calculation of SMEs excluding microenterprises discontinued?

Code
DIREN |>

  filter(REF_AREA == "FR",
         DIREN_THECO == "DE",
         DIREN_MESURE == "03",
         DIREN_SECTACT == "ZZ",
         DIREN_OBJET == "DF",
         !(DIREN_TAILLENT %in% c("TT"))) %>%
  select_if(~ n_distinct(.) > 1) |>
  select(DIREN_TAILLENT, date, value) |>
  left_join(DIREN_TAILLENT, by = "DIREN_TAILLENT") |>
  group_by(DIREN_TAILLENT) |>
  arrange(date) |>
  mutate(value = 100*value/value[date == as.Date("2009-10-31")]) |>
  ggplot() + geom_line(aes(x = date, y = value, color = Diren_taillent)) +
  theme_minimal() + xlab("") + ylab("") +
  scale_x_date(breaks = seq(1960, 2100, 2) |> paste0("-01-01") |> as.Date(),
               labels = date_format("%Y")) +
  theme(legend.position = c(0.3, 0.4),
        legend.title = element_blank())

PE

Code
DIREN |>
  filter(variable %in% c("DIREN.M.FR.DE.UL.DF.03.N.ZZ.PE")) |>
  ggplot() + geom_line(aes(x = date, y = value)) +
  theme_minimal() + xlab("") + ylab("") +
  scale_x_date(breaks = seq(1960, 2100, 2) |> paste0("-01-01") |> as.Date(),
               labels = date_format("%Y")) +
  scale_y_continuous(breaks = seq(0, 10000, 100))

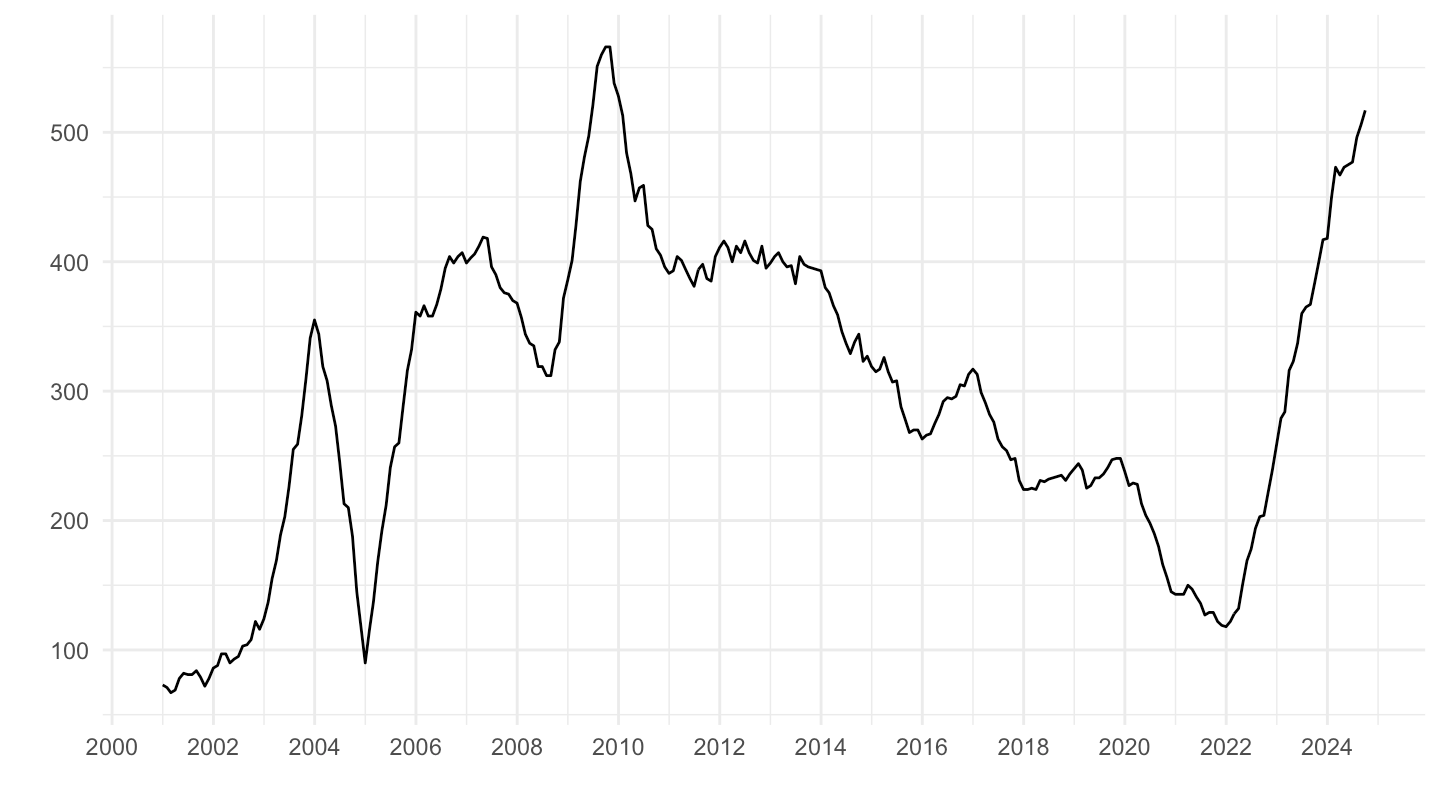
ME

Code
DIREN |>
  filter(variable %in% c("DIREN.M.FR.DE.UL.DF.03.N.ZZ.ME")) |>
  ggplot() + geom_line(aes(x = date, y = value)) +
  theme_minimal() + xlab("") + ylab("") +
  scale_x_date(breaks = seq(1960, 2100, 2) |> paste0("-01-01") |> as.Date(),
               labels = date_format("%Y")) +
  scale_y_continuous(breaks = seq(0, 10000, 100))

IG - Mid-tier enterprises and large enterprises

Code
DIREN |>
  filter(variable %in% c("DIREN.M.FR.DE.UL.DF.03.N.ZZ.IG")) |>
  ggplot() + geom_line(aes(x = date, y = value)) +
  theme_minimal() + xlab("") + ylab("") +
  scale_x_date(breaks = seq(1960, 2100, 2) |> paste0("-01-01") |> as.Date(),
               labels = date_format("%Y")) +
  scale_y_continuous(breaks = seq(0, 10000, 5))

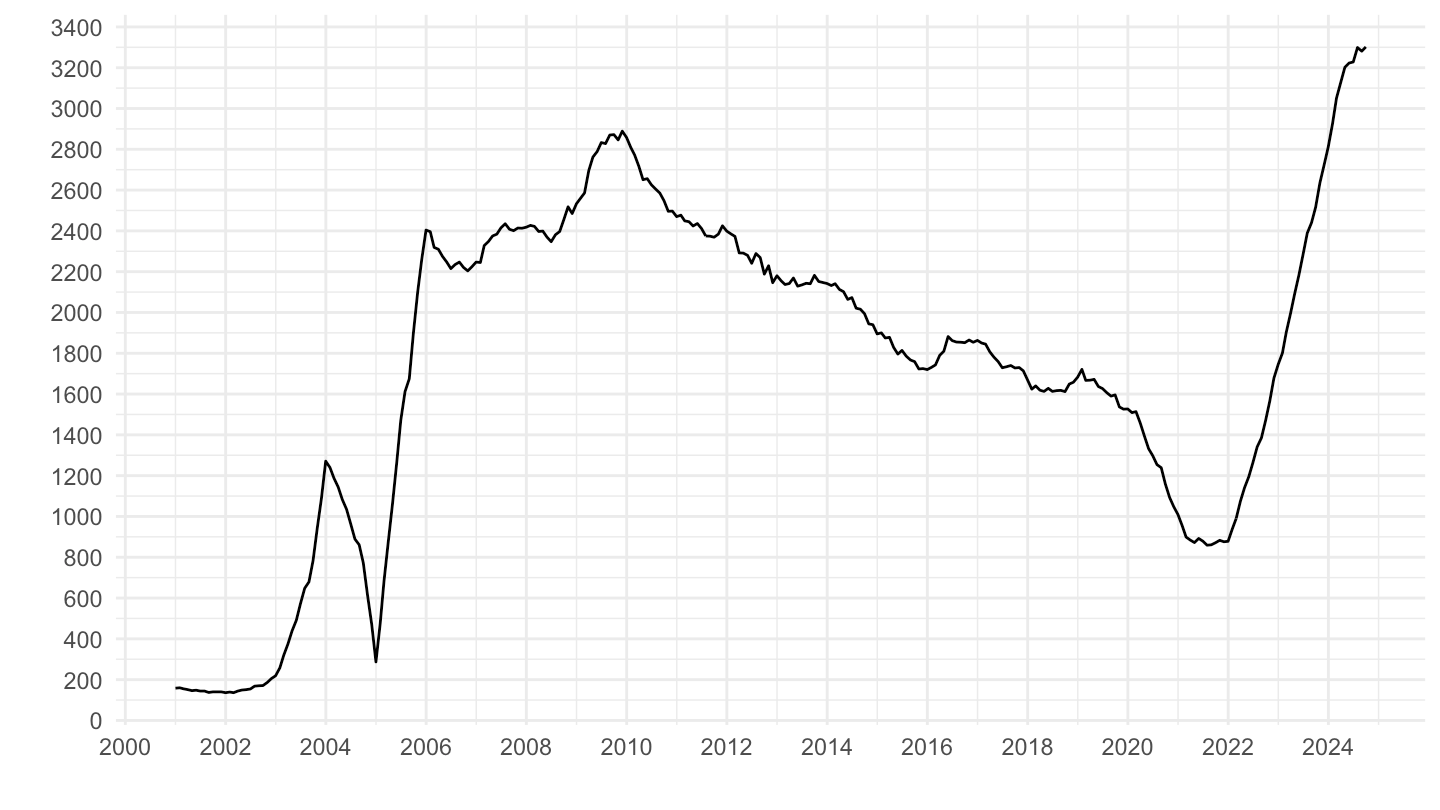
TP - Very small enterprises

Code
DIREN |>
  filter(variable %in% c("DIREN.M.FR.DE.UL.DF.03.N.ZZ.TP")) |>
  ggplot() + geom_line(aes(x = date, y = value)) +
  theme_minimal() + xlab("") + ylab("") +
  scale_x_date(breaks = seq(1960, 2100, 2) |> paste0("-01-01") |> as.Date(),
               labels = date_format("%Y")) +
  scale_y_continuous(breaks = seq(0, 10000, 200))

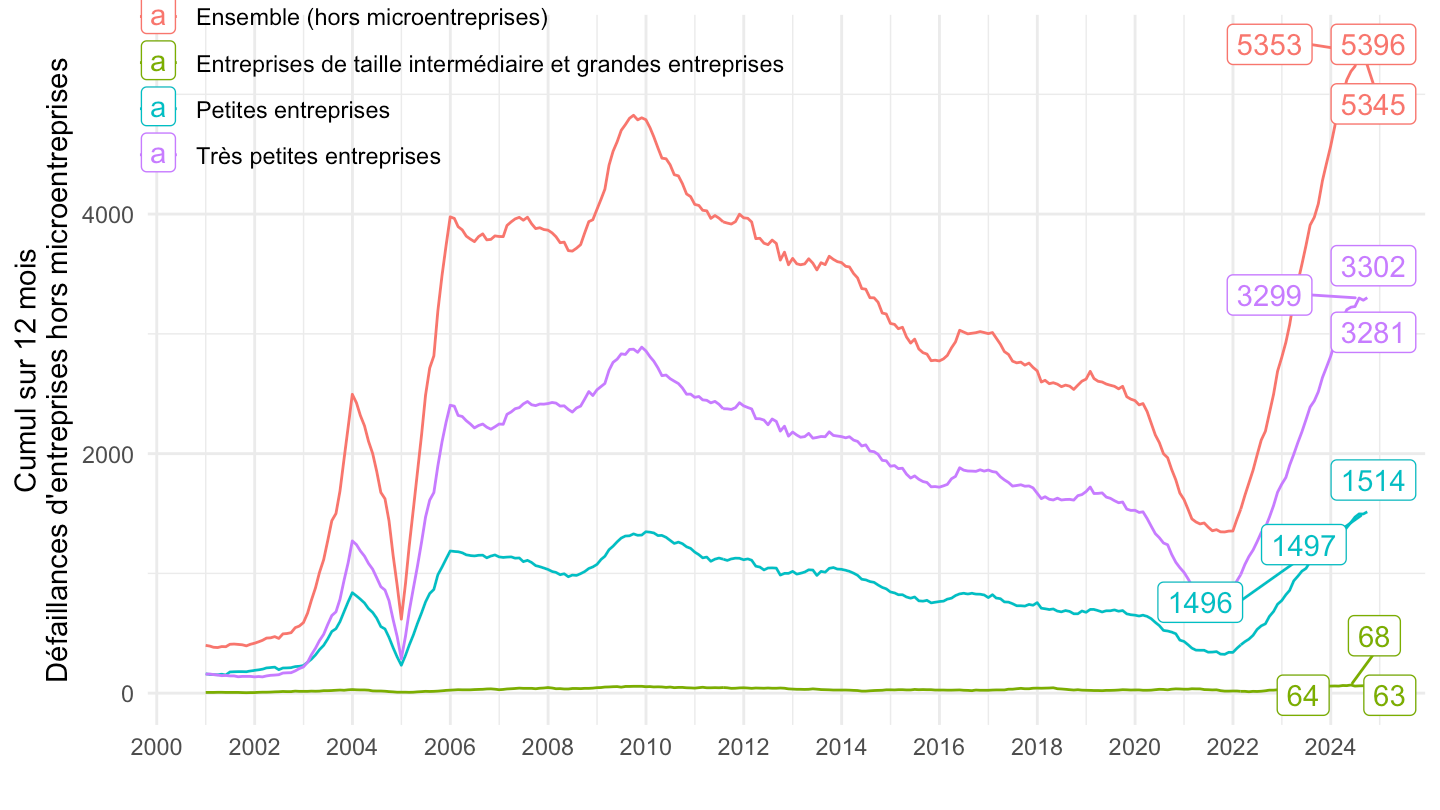
Facet wrap

Option 1

Code
DIREN |>

  filter(REF_AREA == "FR",
         DIREN_THECO == "DE",
         DIREN_MESURE == "03",
         DIREN_SECTACT == "ZZ",
         DIREN_OBJET == "DF",
         DIREN_TAILLENT %in% c("PE", "IG", "TP")) %>%
  select_if(~ n_distinct(.) > 1) |>
  select(DIREN_TAILLENT, date, value) |>
  left_join(DIREN_TAILLENT, by = "DIREN_TAILLENT") |>
  bind_rows(data_TTMI) |>
  ggplot() + geom_line(aes(x = date, y = value, color = Diren_taillent)) +
  theme_minimal() + xlab("") + ylab("12-month cumulative\nBusiness failures excluding microenterprises") +
  scale_x_date(breaks = seq(1960, 2100, 2) |> paste0("-01-01") |> as.Date(),
               labels = date_format("%Y")) +
  theme(legend.position = c(0.25, 0.9),
        legend.title = element_blank()) +
  geom_label_repel(data = . %>%
                     filter(date %in% c(as.Date("2024-03-01"),
                                        as.Date("2024-02-01"),
                                        as.Date("2009-09-01"))), aes(x = date, y = value, label = value, color = Diren_taillent))

Option 2

Code
DIREN |>

  filter(REF_AREA == "FR",
         DIREN_THECO == "DE",
         DIREN_MESURE == "03",
         DIREN_SECTACT == "ZZ",
         DIREN_OBJET == "DF",
         DIREN_TAILLENT %in% c("PE", "IG", "TP")) %>%
  select_if(~ n_distinct(.) > 1) |>
  select(DIREN_TAILLENT, date, value) |>
  left_join(DIREN_TAILLENT, by = "DIREN_TAILLENT") |>
  bind_rows(data_TTMI) |>
  ggplot() + geom_line(aes(x = date, y = value, color = Diren_taillent)) +
  theme_minimal() + xlab("") + ylab("12-month cumulative\nBusiness failures excluding microenterprises") +
  scale_x_date(breaks = seq(1960, 2100, 2) |> paste0("-01-01") |> as.Date(),
               labels = date_format("%Y")) +
  theme(legend.position = c(0.25, 0.9),
        legend.title = element_blank()) +
  geom_label_repel(data = . %>%
                    group_by(DIREN_TAILLENT) %>%
                     arrange(-value) %>%
                     slice(1:3), aes(x = date, y = value, label = value, color = Diren_taillent))

Option 3

Code
DIREN |>

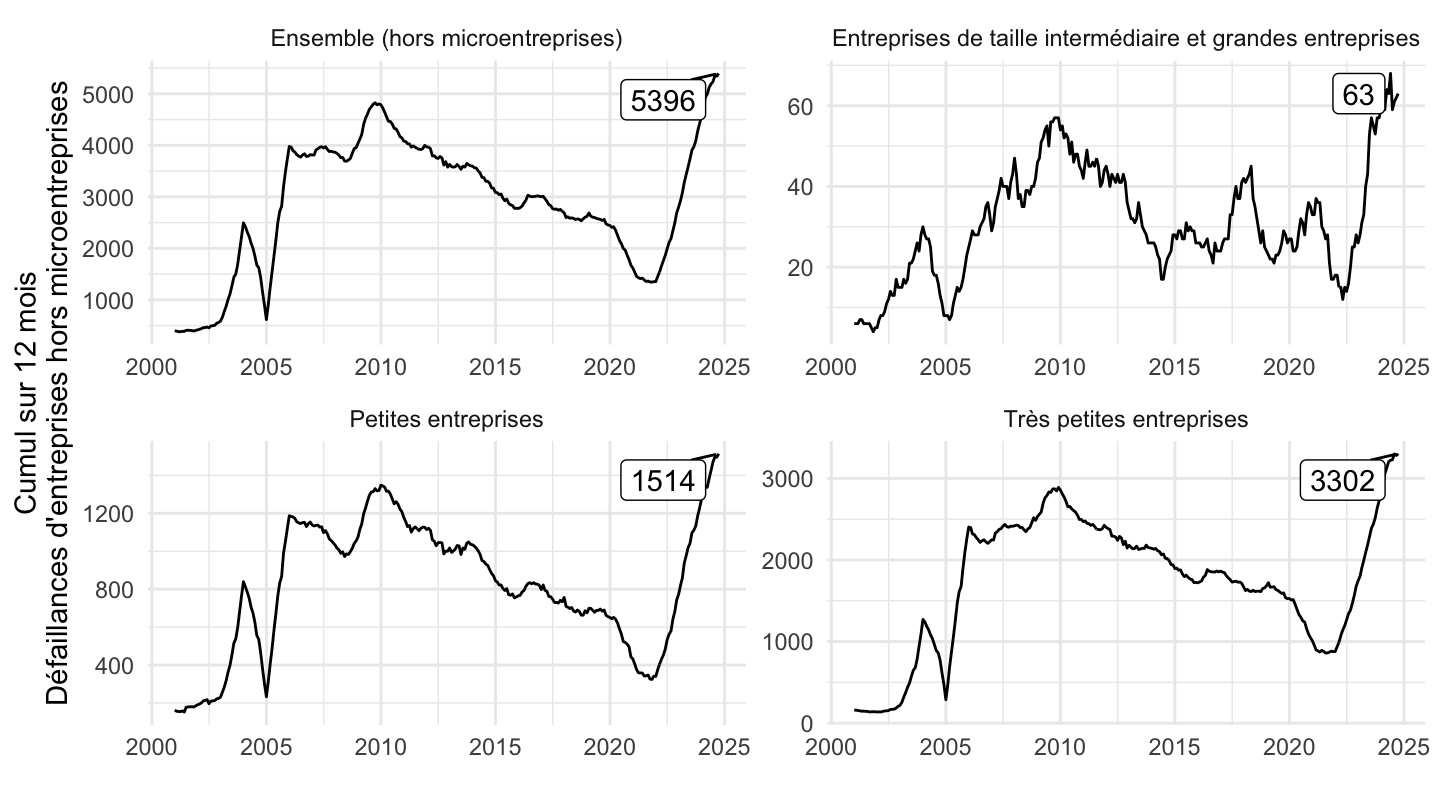
  filter(REF_AREA == "FR",
         DIREN_THECO == "DE",
         DIREN_MESURE == "03",
         DIREN_SECTACT == "ZZ",
         DIREN_OBJET == "DF",
         DIREN_TAILLENT %in% c("PE", "IG", "TP")) %>%
  select_if(~ n_distinct(.) > 1) |>
  select(DIREN_TAILLENT, date, value) |>
  left_join(DIREN_TAILLENT, by = "DIREN_TAILLENT") |>
  bind_rows(data_TTMI) |>
  arrange(desc(date)) |>
  ggplot() + geom_line(aes(x = date, y = value)) +
  theme_minimal() + xlab("") + ylab("12-month cumulative\nBusiness failures excluding microenterprises") +
  scale_x_date(breaks = seq(1960, 2100, 5) |> paste0("-01-01") |> as.Date(),
               labels = date_format("%Y")) +
  theme(legend.position = c(0.25, 0.9),
        legend.title = element_blank()) +
  geom_label_repel(data = . %>%
                     group_by(DIREN_TAILLENT) %>%
                     filter(date == max(date)), aes(x = date, y = value, label = value)) +
  facet_wrap(~ Diren_taillent, scales = "free")