DIREN |>

  filter(REF_AREA == "FR",
         DIREN_THECO == "DE",
         DIREN_MESURE == "03",
         DIREN_SECTACT == "ZZ",
         DIREN_OBJET == "DF",
         DIREN_TAILLENT %in% c("PE", "IG", "TP")) %>%
  select(where(~ n_distinct(.) > 1) | any_of(c("date", "value", "DIREN_TAILLENT", "Diren_taillent", "Diren_sectact", "DIREN_SECTACT"))) |>
  select(DIREN_TAILLENT, Diren_taillent, date, value) |>
  bind_rows(data_TTMI) |>
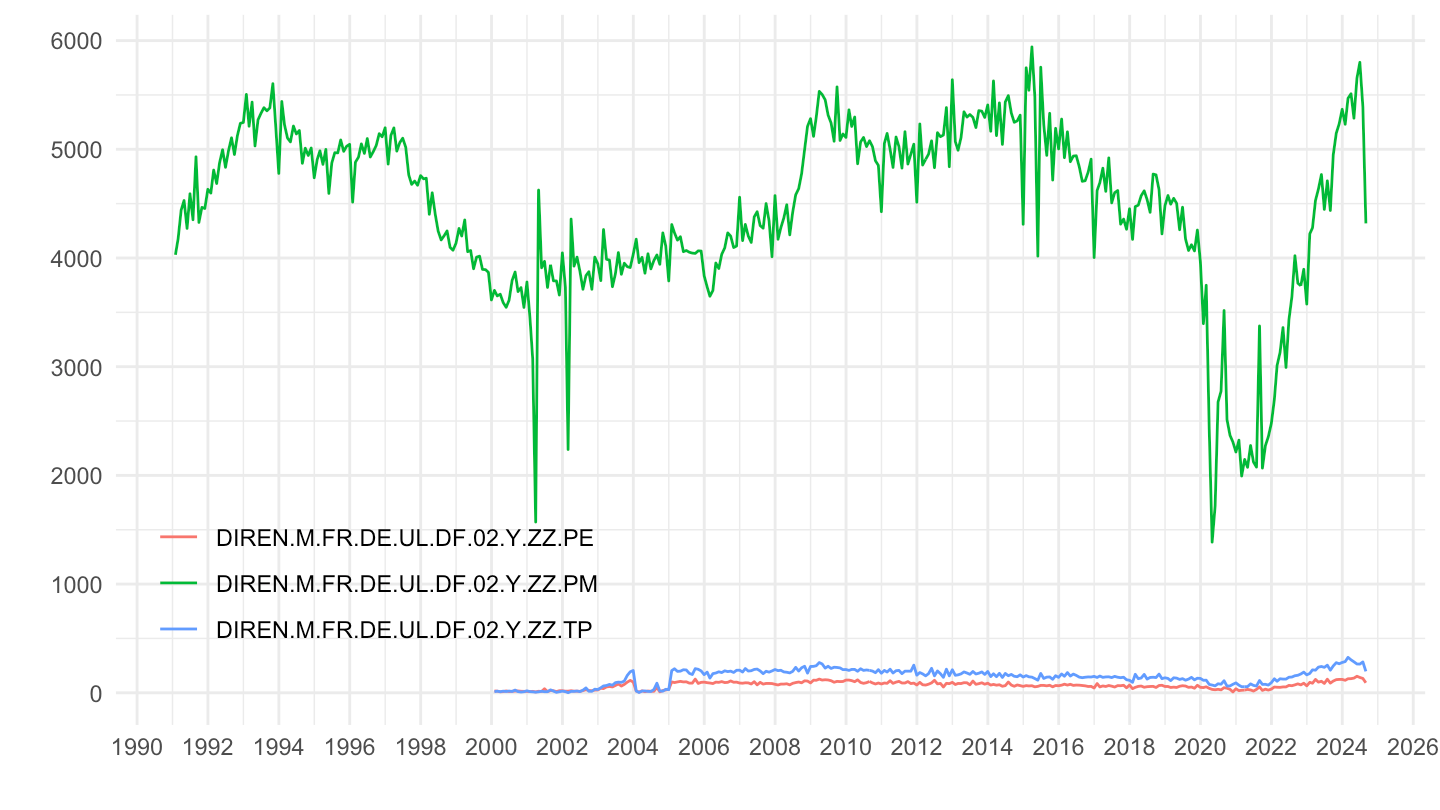
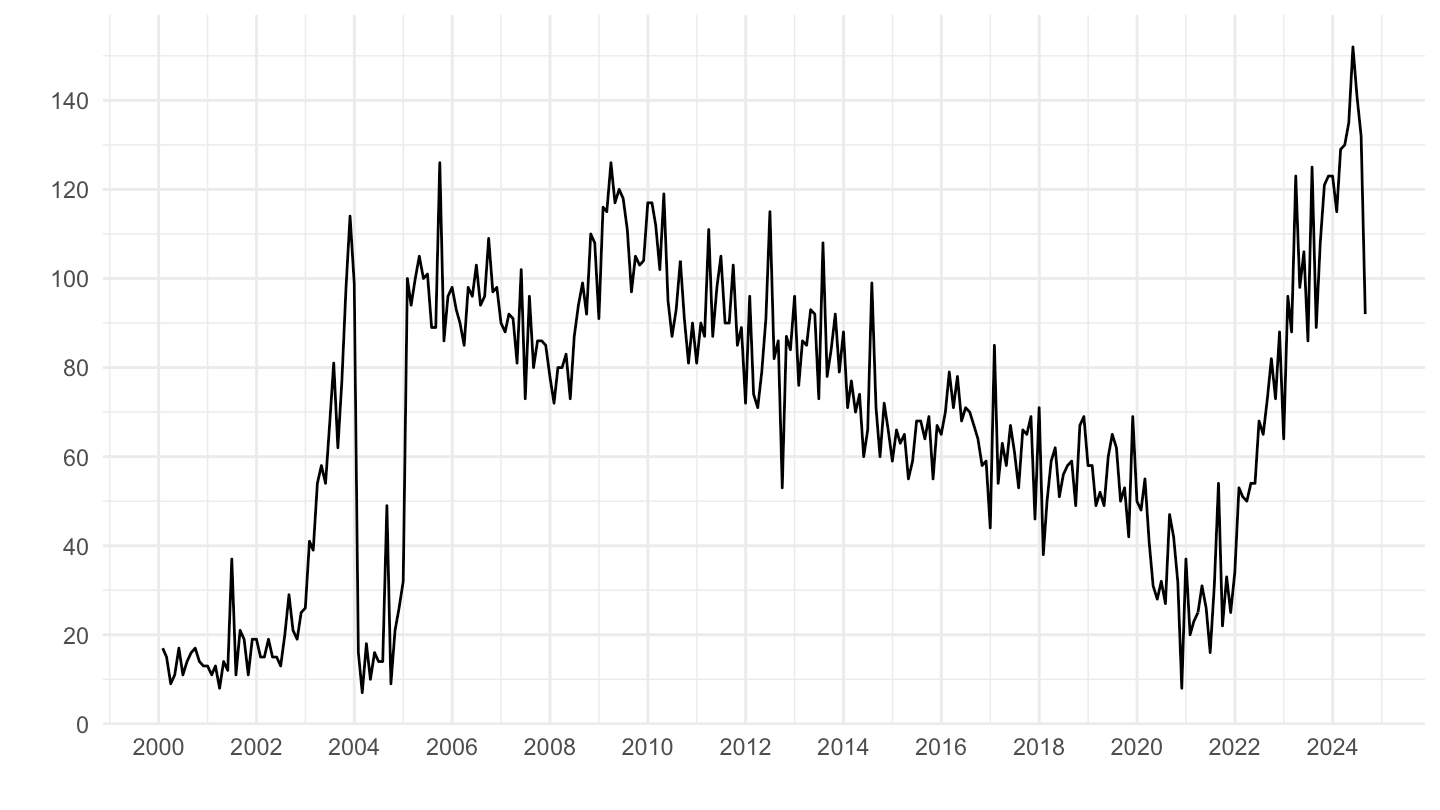
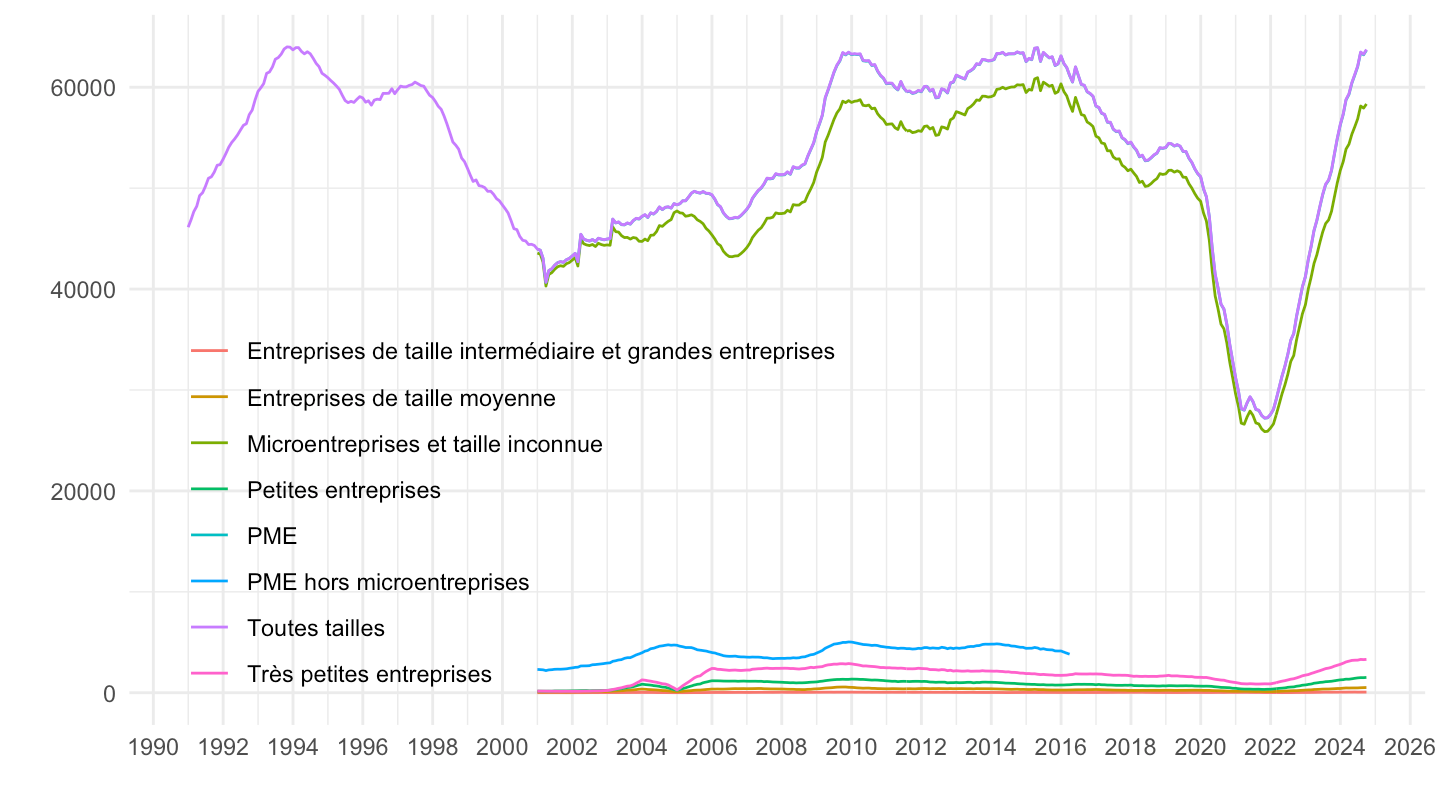
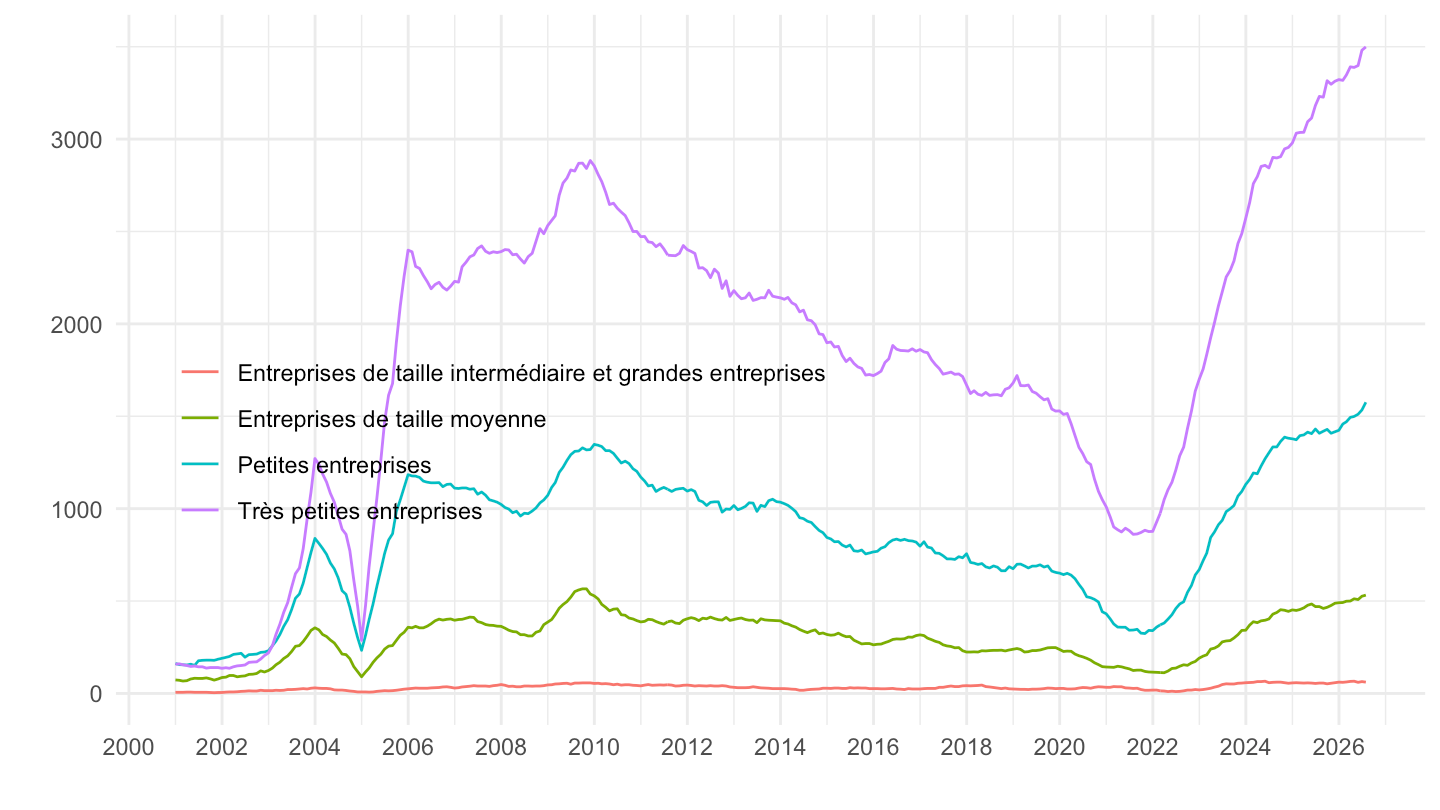
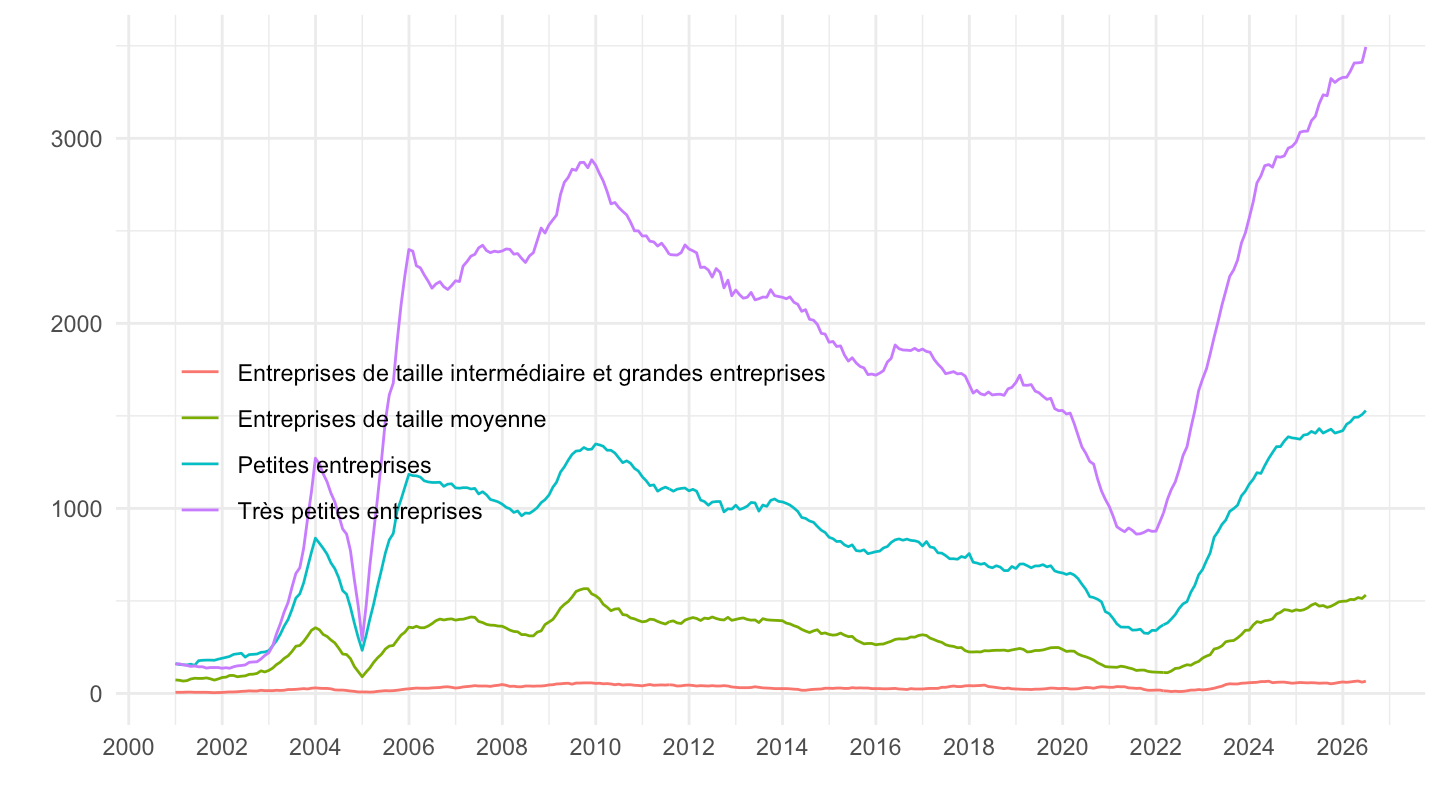
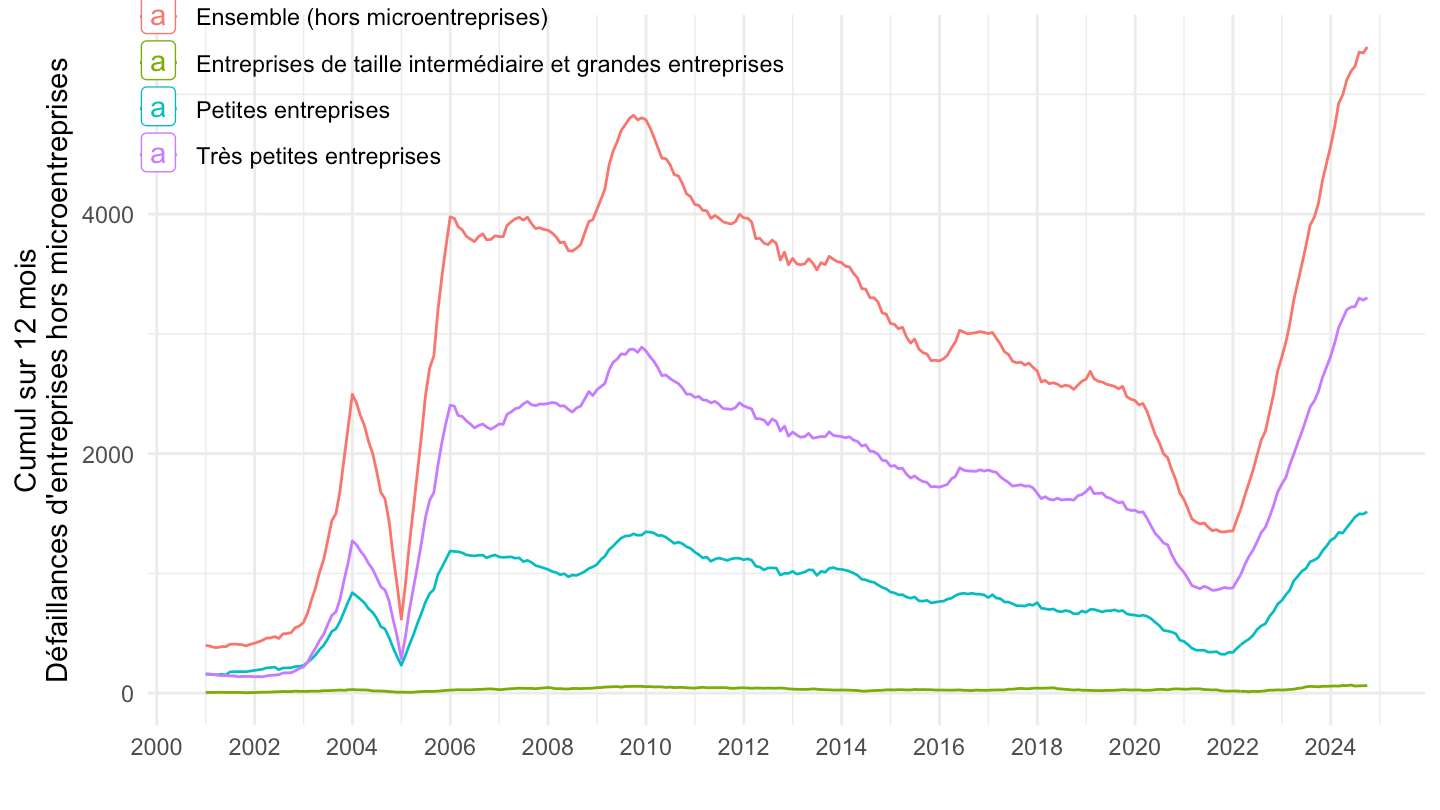
  ggplot() + geom_line(aes(x = date, y = value, color = Diren_taillent)) +
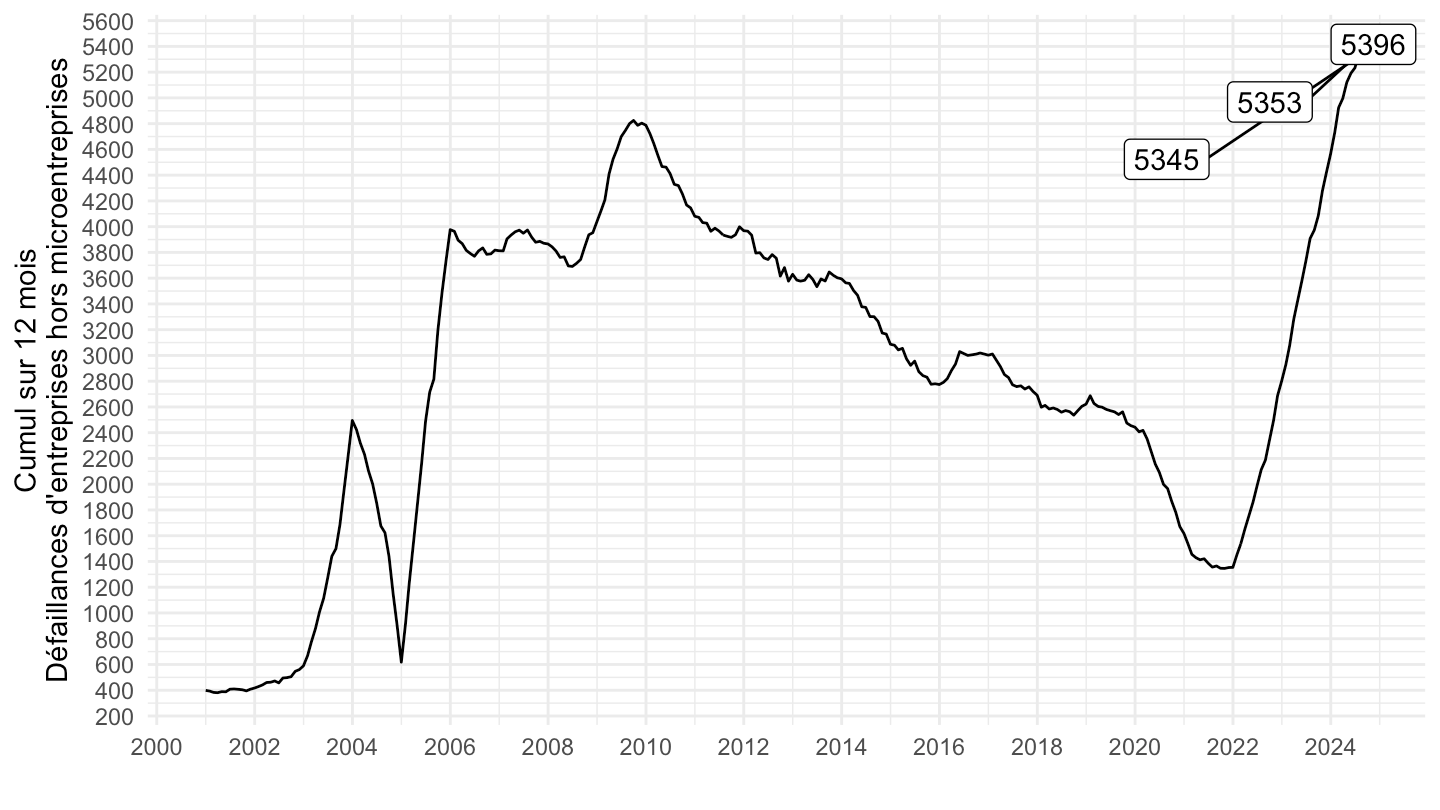
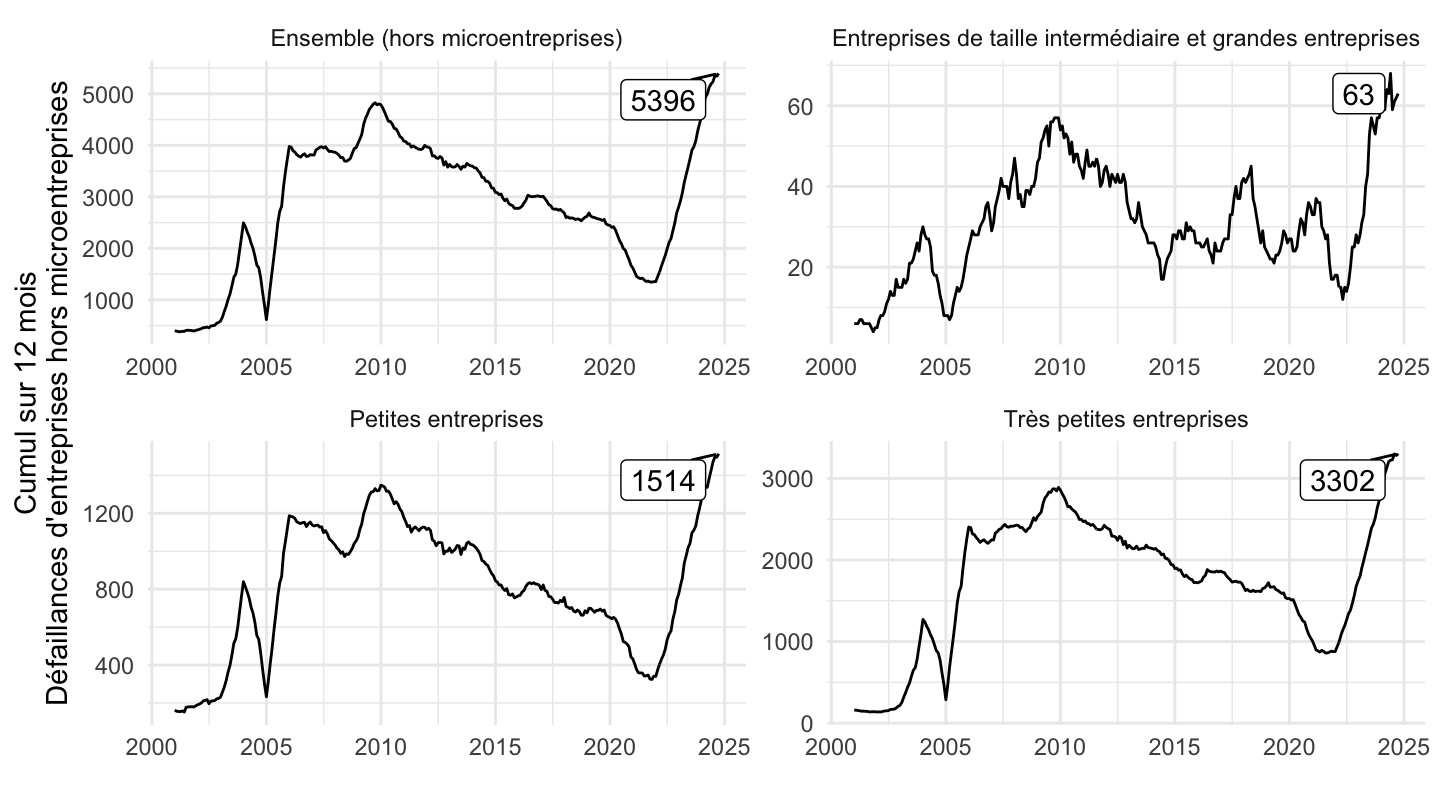
  theme_minimal() + xlab("") + ylab("Cumul sur 12 mois\nDéfaillances d'entreprises hors microentreprises") +
  scale_x_date(breaks = seq(1960, 2100, 2) |> paste0("-01-01") |> as.Date(),
               labels = date_format("%Y")) +
  theme(legend.position = c(0.25, 0.9),
        legend.title = element_blank()) +
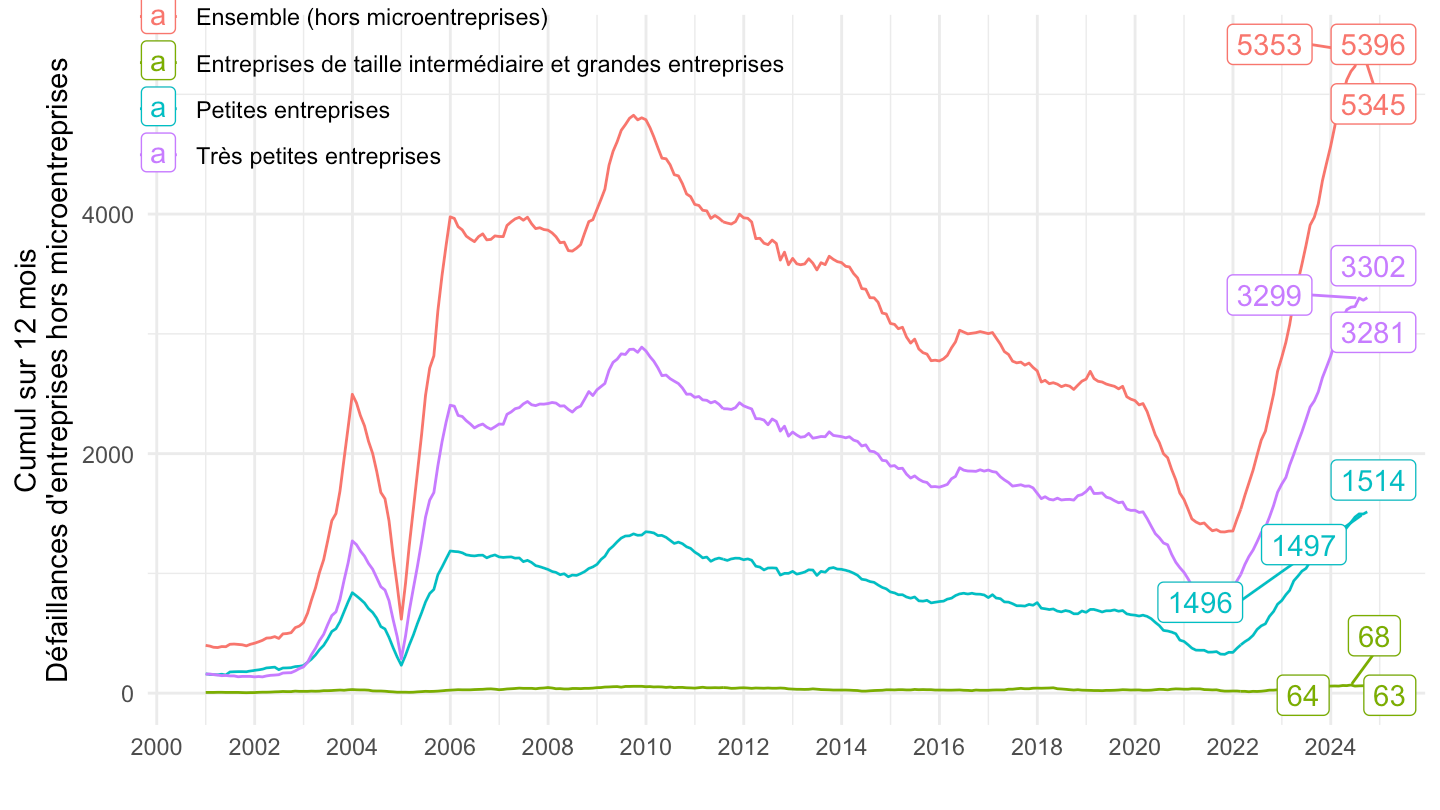
  geom_label_repel(data = . %>%
                     filter(date %in% c(as.Date("2024-03-01"),
                                        as.Date("2024-02-01"),
                                        as.Date("2009-09-01"))), aes(x = date, y = value, label = value, color = Diren_taillent))