
Last observation: Q2 2026 (N = 20330)
First observation: Q1 2003 (N = 162)
Last data update: 11 sept. 2026, 22:49
Last compile: 09 oct. 2026, 22:31
lfsi_sla_q |>
  filter(geo %in% c("FR", "DE", "ES", "IT"),
         wstatus == "SLACK",
         unit == "PC_ELF",
         s_adj == "SA",
         sex == "T",
         age == "Y15-74") |>
  quarter_to_date() |>
  add_flag_color("Geo") |>
  mutate(values = values/100) |>
  ggplot() + geom_line(aes(x = date, y = values, color = color)) +
  theme_minimal() + scale_color_identity() + add_flags +
  scale_x_date(breaks = as.Date(paste0(seq(2003, 2100, 2), "-01-01")),
               labels = date_format("%Y")) +
  xlab("") + ylab("Labour market slack (% of extended labour force)") +
  scale_y_continuous(labels = scales::percent_format(accuracy = 1))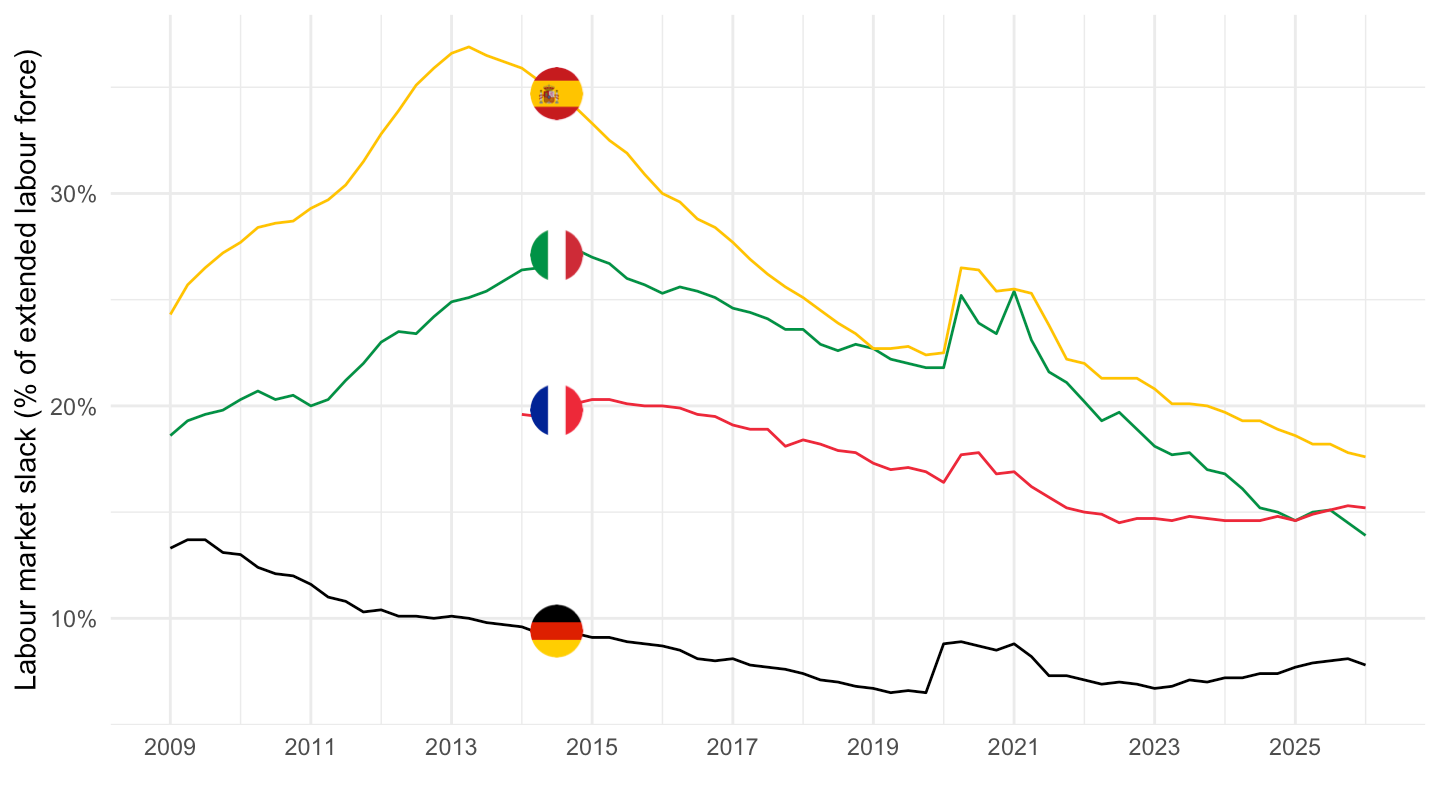
lfsi_sla_q |>
  filter(geo == "FR",
         wstatus %in% c("SLACK", "UEMP_PT", "NSEEK_AVL", "SEEK_NAVL"),
         unit == "PC_ELF",
         s_adj == "SA",
         sex == "T",
         age == "Y15-74") |>
  quarter_to_date() |>
  mutate(values = values/100) |>
  ggplot() + geom_line(aes(x = date, y = values, color = Wstatus)) +
  theme_minimal() +
  scale_x_date(breaks = as.Date(paste0(seq(2003, 2100, 2), "-01-01")),
               labels = date_format("%Y")) +
  theme(legend.position = "right") +
  xlab("") + ylab("Share of extended labour force") +
  scale_y_continuous(labels = scales::percent_format(accuracy = 1))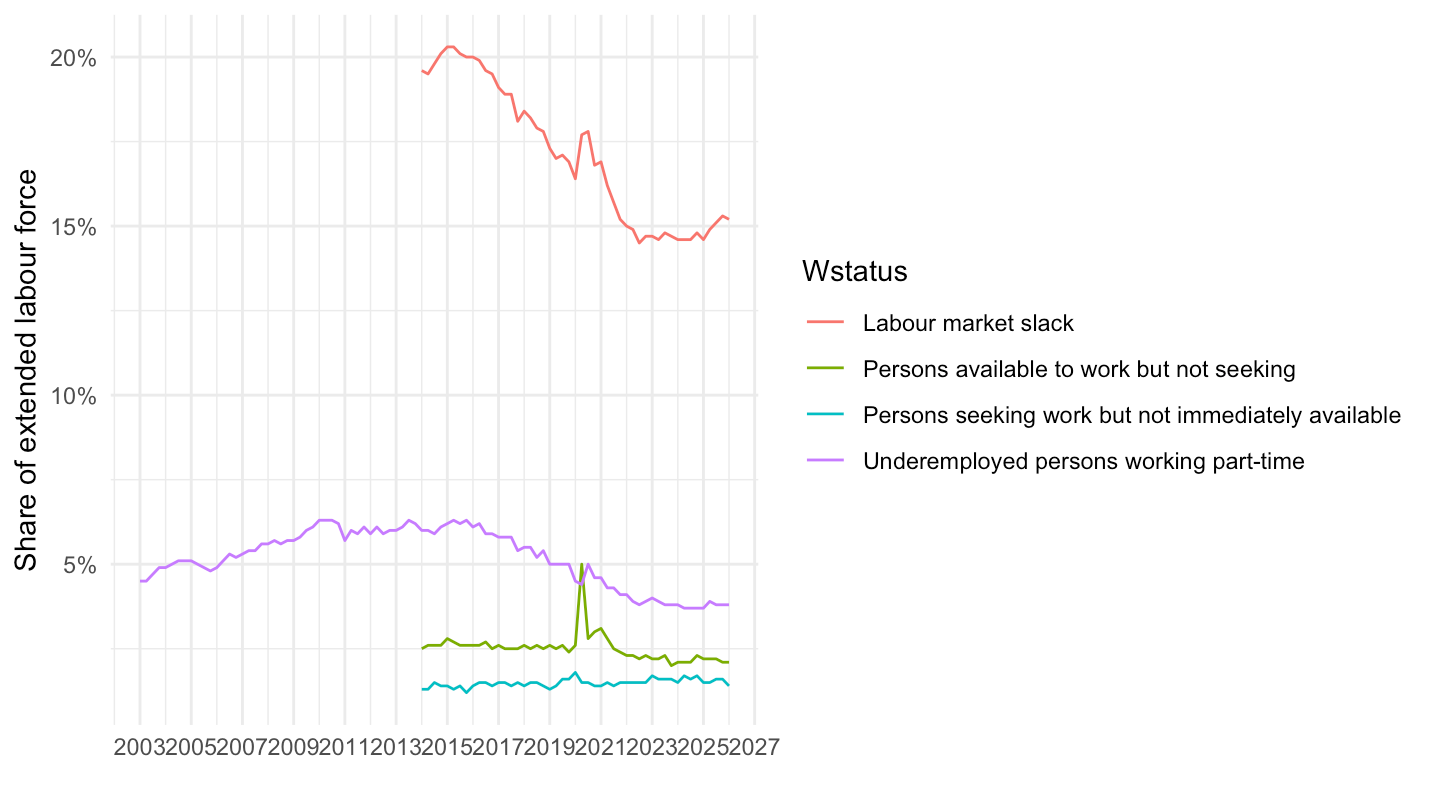
lfsi_long_q |>
  left_join(geo, by = "geo") |>
  group_by(geo, Geo) |>
  summarise(Nobs = n()) |>
  arrange(-Nobs) |>
  mutate(Geo = ifelse(geo == "DE", "Germany", Geo)) |>
  mutate(Flag = gsub(" ", "-", str_to_lower(Geo)),
         Flag = paste0('<img src="../../bib/flags/vsmall/', Flag, '.png" alt="Flag">')) |>
  select(Flag, everything()) %>%
{if (is_html_output()) datatable(., filter = 'top', rownames = F, escape = F) else .}lfsi_long_q |>
filter(geo == "FR",
sex == "T",
s_adj == "SA",
unit == "THS_PER",
time %in% c("2015Q2", "2021Q2", "2019Q2", "2017Q2")) |>
filter(!is.na(values)) |>
left_join(indic_em, by = "indic_em") |>
select(indic_em, Indic_em, time, values) |>
spread(time, values) |>
print_table_conditional()| indic_em | Indic_em | 2015Q2 | 2017Q2 | 2019Q2 | 2021Q2 |
|---|---|---|---|---|---|
| E_E | Transition employment - employment | 25265 | 25565 | 26004 | 26288 |
| E_I | Transition employment - outside the labour force | 554 | 553 | 601 | 644 |
| E_U | Transition employment - unemployment | 524 | 447 | 434 | 441 |
| I_E | Transition outside the labour force - employment | 447 | 616 | 499 | 704 |
| I_I | Transition outside the labour force - outside the labour force | 16609 | 16882 | 17132 | 16836 |
| I_U | Transition outside the labour force - unemployment | 672 | 723 | 628 | 706 |
| U_E | Transition unemployment - employment | 643 | 638 | 599 | 630 |
| U_I | Transition unemployment - outside the labour force | 544 | 562 | 567 | 581 |
| U_U | Transition unemployment - unemployment | 1867 | 1640 | 1411 | 1233 |
lfsi_long_q |>
  filter(geo == "FR",
         sex == "T",
         s_adj == "SA",
         unit != "THS_PER",
         indic_em %in% c("E_E", "I_I")) |>
  filter(!is.na(values)) |>
  left_join(indic_em, by = "indic_em") |>
  select(indic_em, Indic_em, time, values) |>
  quarter_to_date() |>
  ggplot() + theme_minimal() + xlab("") + ylab("") +
  geom_line(aes(x = date, y = values/100, color = Indic_em)) +
  scale_color_manual(values = viridis(3)[1:2]) +
  scale_x_date(breaks = as.Date(paste0(seq(1960, 2100, 1), "-01-01")),
               labels = date_format("%Y")) +
  theme(legend.position = c(0.3, 0.85),
        legend.title = element_blank()) +
  scale_y_continuous(breaks = 0.01*seq(0, 100, 1),
                     labels = scales::percent_format(acc = 1))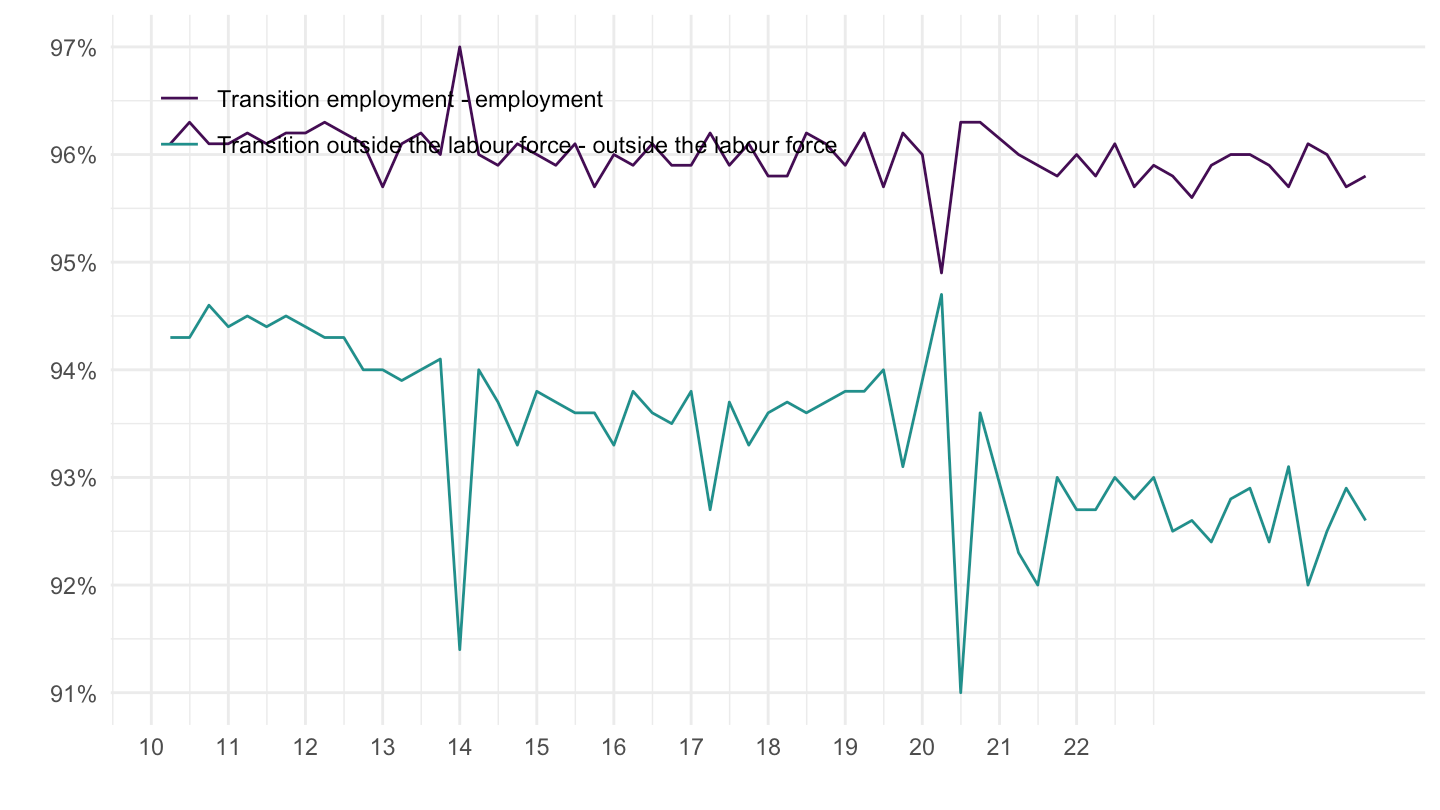
lfsi_long_q |>
  filter(geo == "IT",
         sex == "T",
         s_adj == "SA",
         unit != "THS_PER",
         indic_em %in% c("E_E", "I_I")) |>
  filter(!is.na(values)) |>
  left_join(indic_em, by = "indic_em") |>
  select(indic_em, Indic_em, time, values) |>
  quarter_to_date() |>
  ggplot() + theme_minimal() + xlab("") + ylab("") +
  geom_line(aes(x = date, y = values/100, color = Indic_em)) +
  scale_color_manual(values = viridis(3)[1:2]) +
  scale_x_date(breaks = as.Date(paste0(seq(1960, 2100, 1), "-01-01")),
               labels = date_format("%Y")) +
  theme(legend.position = c(0.3, 0.85),
        legend.title = element_blank()) +
  scale_y_continuous(breaks = 0.01*seq(0, 100, 1),
                     labels = scales::percent_format(acc = 1))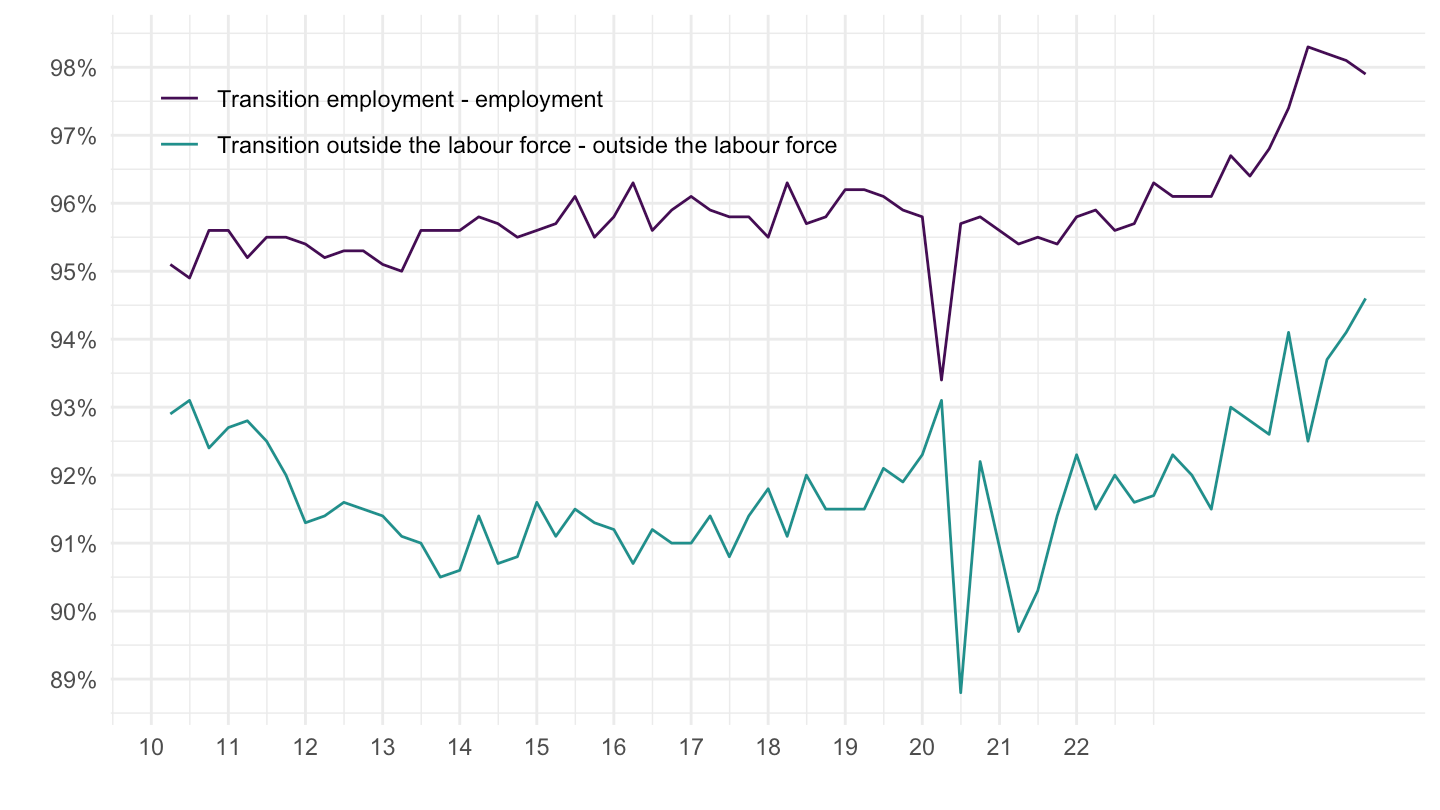
lfsi_sla_q |>
  filter(geo %in% c("EA20", "FR", "DE", "ES", "IT"),
         wstatus == "SLACK", unit == "PC_ELF", s_adj == "SA",
         sex == "T", age == "Y15-74") |>
  quarter_to_date() |>
  filter(!is.na(values)) |>
  mutate(Geo = ifelse(geo == "EA20", "Europe", Geo),
         Geo = ifelse(geo == "DE", "Germany", Geo)) |>
  add_flag_color("Geo") |>
  mutate(values = values / 100) |>
  ggplot() + geom_line(aes(x = date, y = values, color = color)) +
  theme_minimal() + scale_color_identity() + add_flags +
  scale_x_date(breaks = as.Date(paste0(seq(2005, 2100, 2), "-01-01")),
               labels = date_format("%Y")) +
  xlab("") + ylab("Labour market slack (% of extended labour force)") +
  scale_y_continuous(labels = scales::percent_format(accuracy = 1))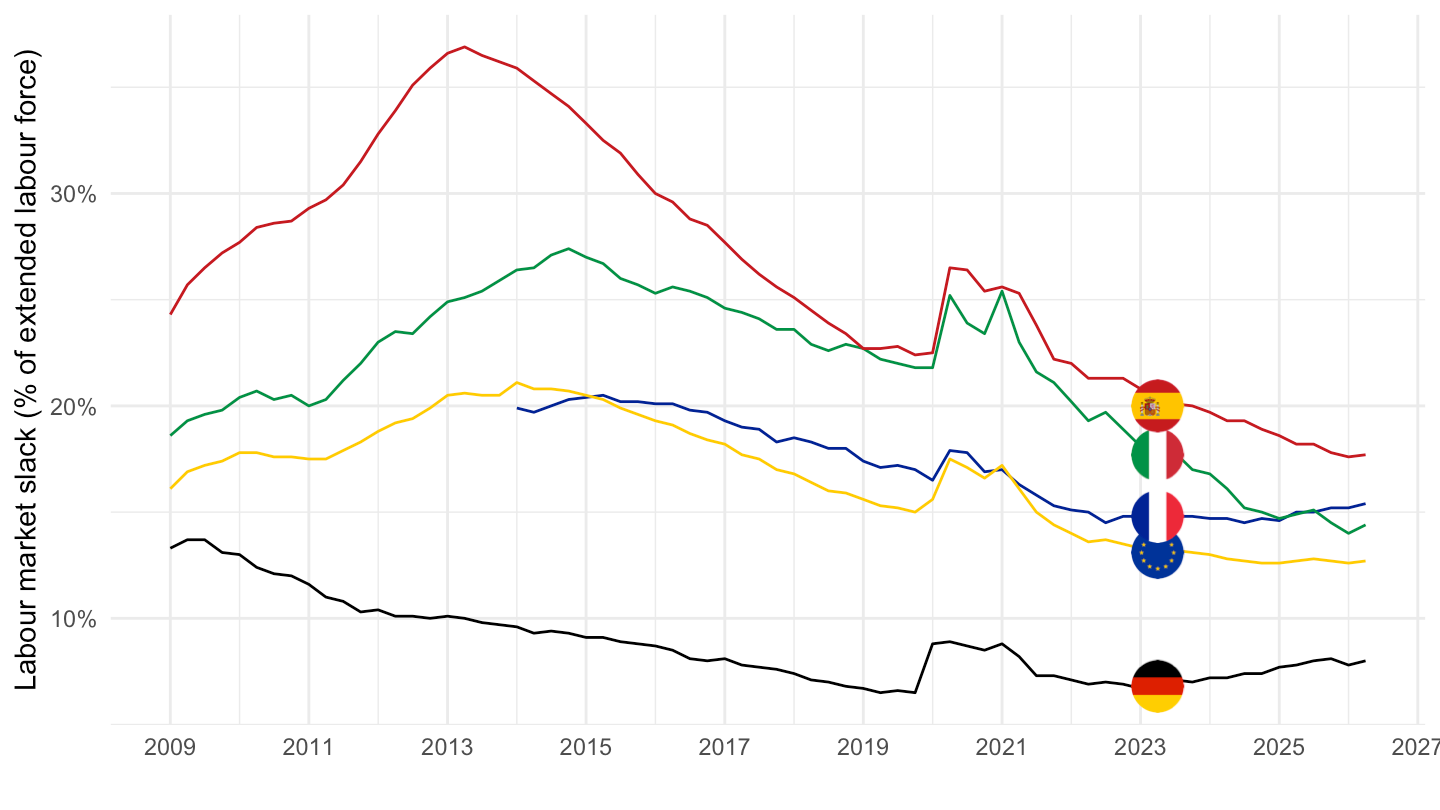
lfsi_sla_q |>
  filter(geo == "EA20",
         wstatus %in% c("UEMP_PT", "NSEEK_AVL", "SEEK_NAVL"),
         unit == "PC_ELF", s_adj == "SA", sex == "T", age == "Y15-74") |>
  quarter_to_date() |>
  filter(!is.na(values)) |>
  mutate(values = values / 100) |>
  ggplot() + geom_line(aes(x = date, y = values, color = Wstatus)) +
  theme_minimal() +
  scale_x_date(breaks = as.Date(paste0(seq(2005, 2100, 2), "-01-01")),
               labels = date_format("%Y")) +
  theme(legend.position = "right", legend.title = element_blank()) +
  xlab("") + ylab("Hidden slack, % of extended labour force") +
  scale_y_continuous(labels = scales::percent_format(accuracy = 1))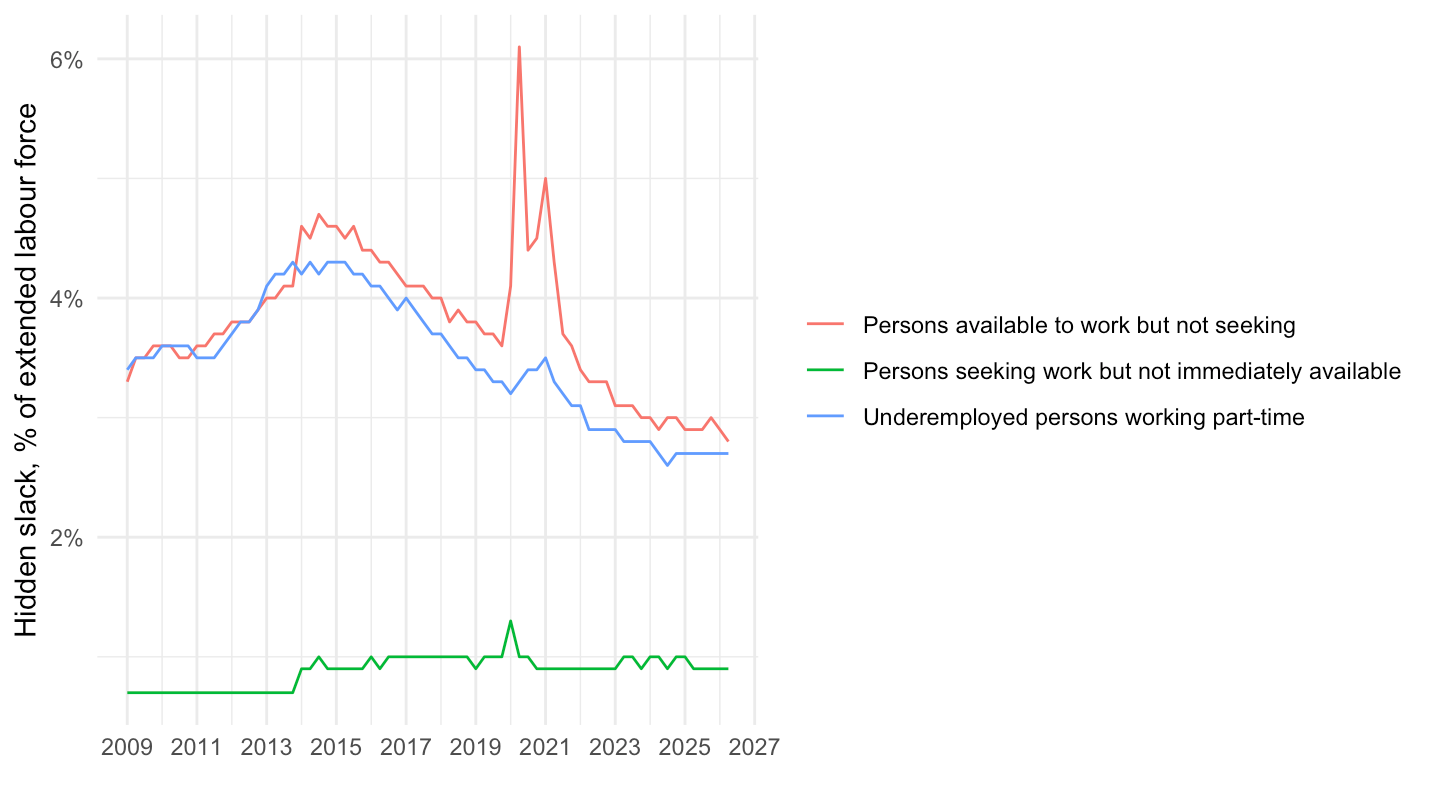
| source | dataset | Title | Updated |
|---|---|---|---|


