Code
ig_d("oecd", "QNA_EXPENDITURE_CAPITA", "USA-EA-1999-flags")| Source | Dataset | Updated | PNG | |
|---|---|---|---|---|
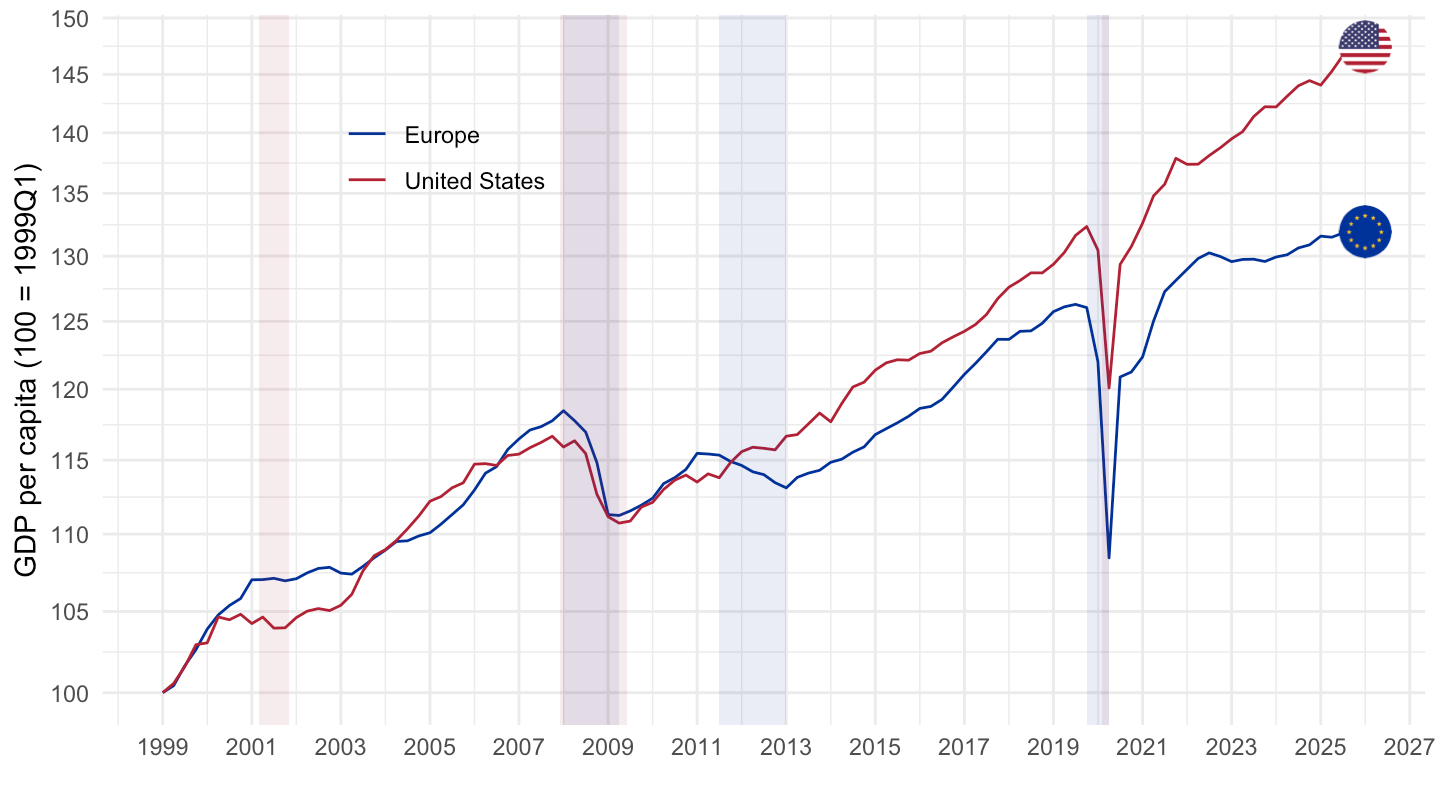
Slack — the gap between what the economy does produce and what it could produce without pushing up inflation — is not observed directly. This page gathers the pieces of evidence that, taken together, suggest the euro area operated with substantial and persistent slack for most of the decade that followed the 2008 crisis, and that pockets of it are still visible.
The individual charts live on their own dataset pages; here they are lined up by theme.
ig_d("oecd", "QNA_EXPENDITURE_CAPITA", "USA-EA-1999-flags")| Source | Dataset | Updated | PNG | |
|---|---|---|---|---|
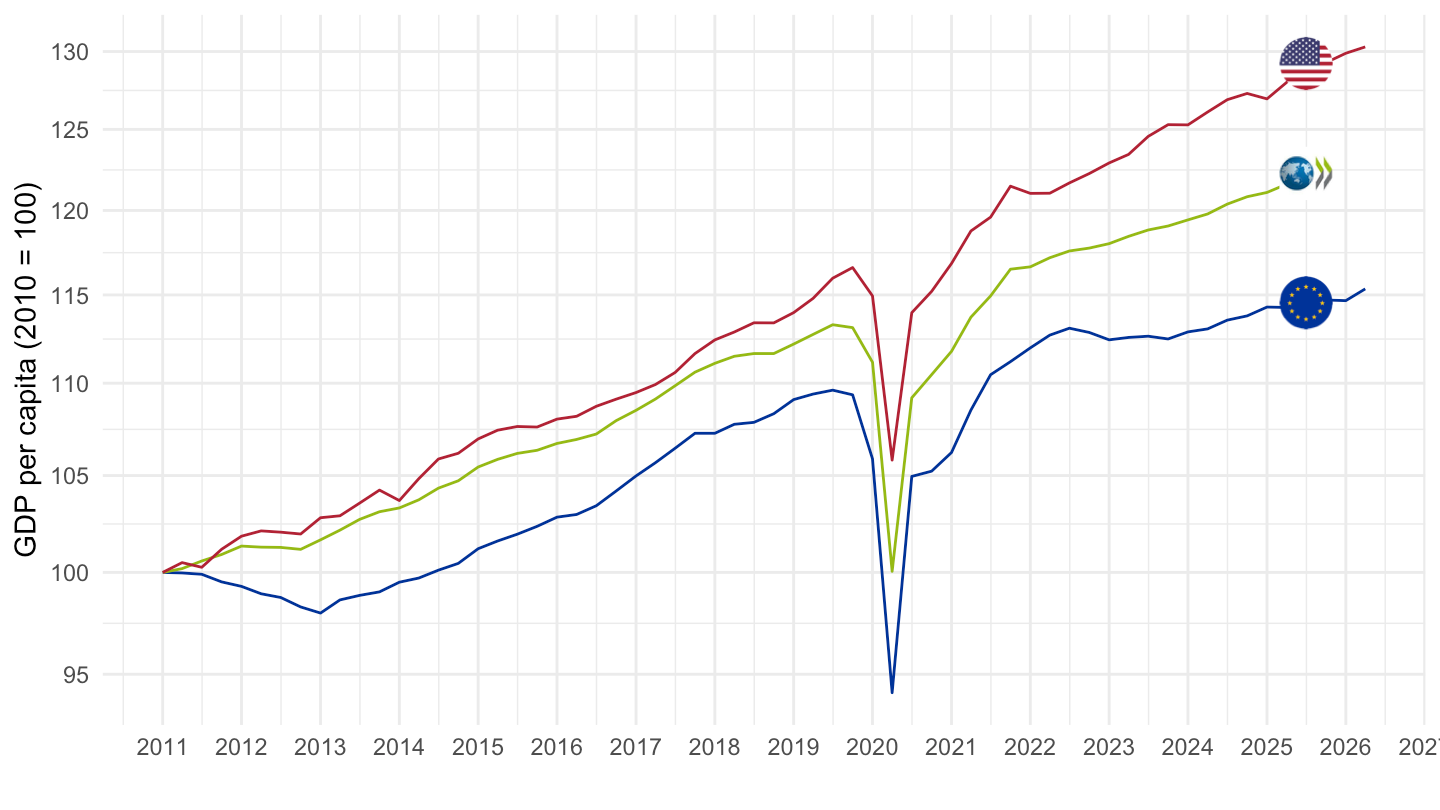
ig_d("oecd", "QNA_EXPENDITURE_CAPITA", "USA-EA-OECD-2011-new-english")| Source | Dataset | Updated | PNG | |
|---|---|---|---|---|
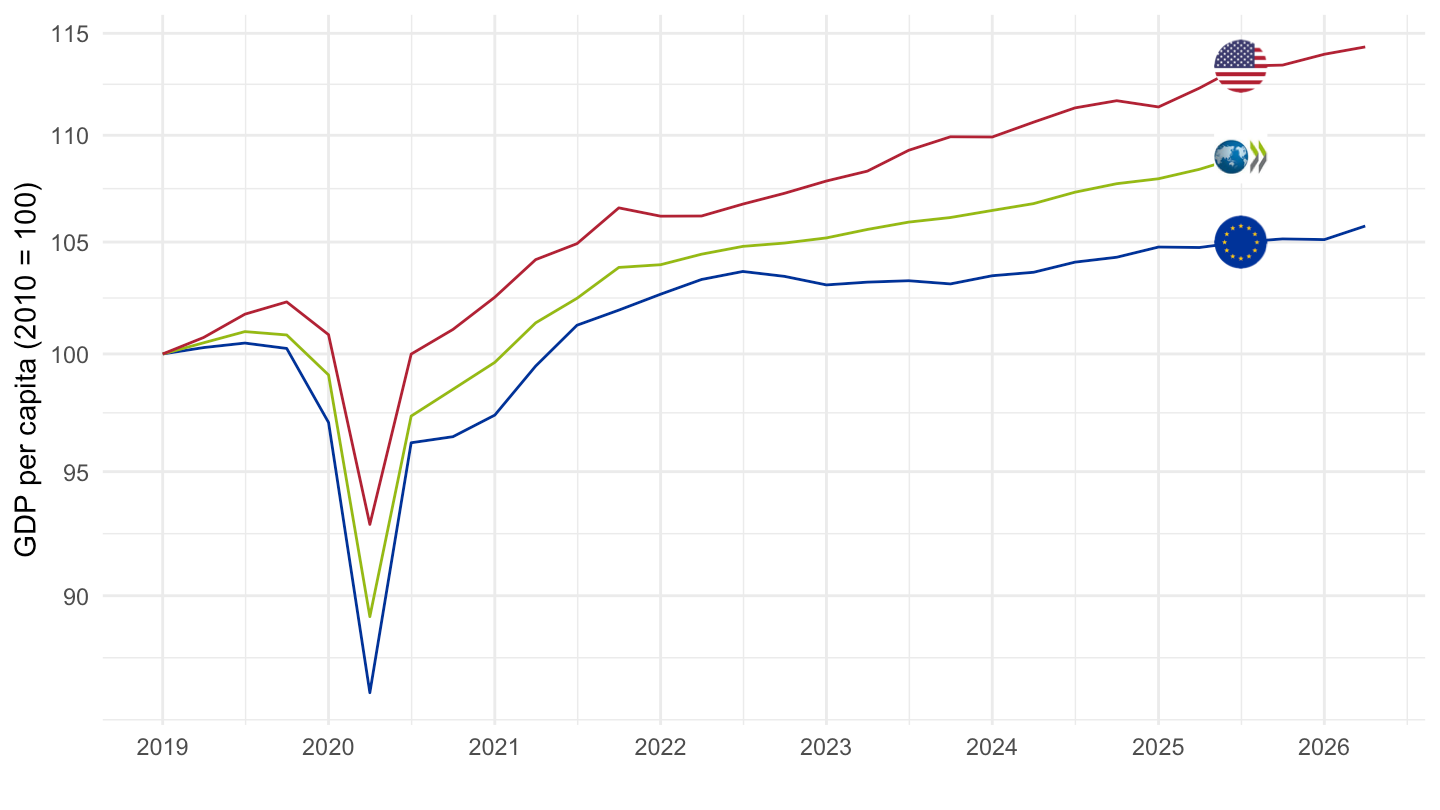
ig_d("oecd", "QNA_EXPENDITURE_CAPITA", "USA-EA-OECD-2019-new-english")| Source | Dataset | Updated | PNG | |
|---|---|---|---|---|
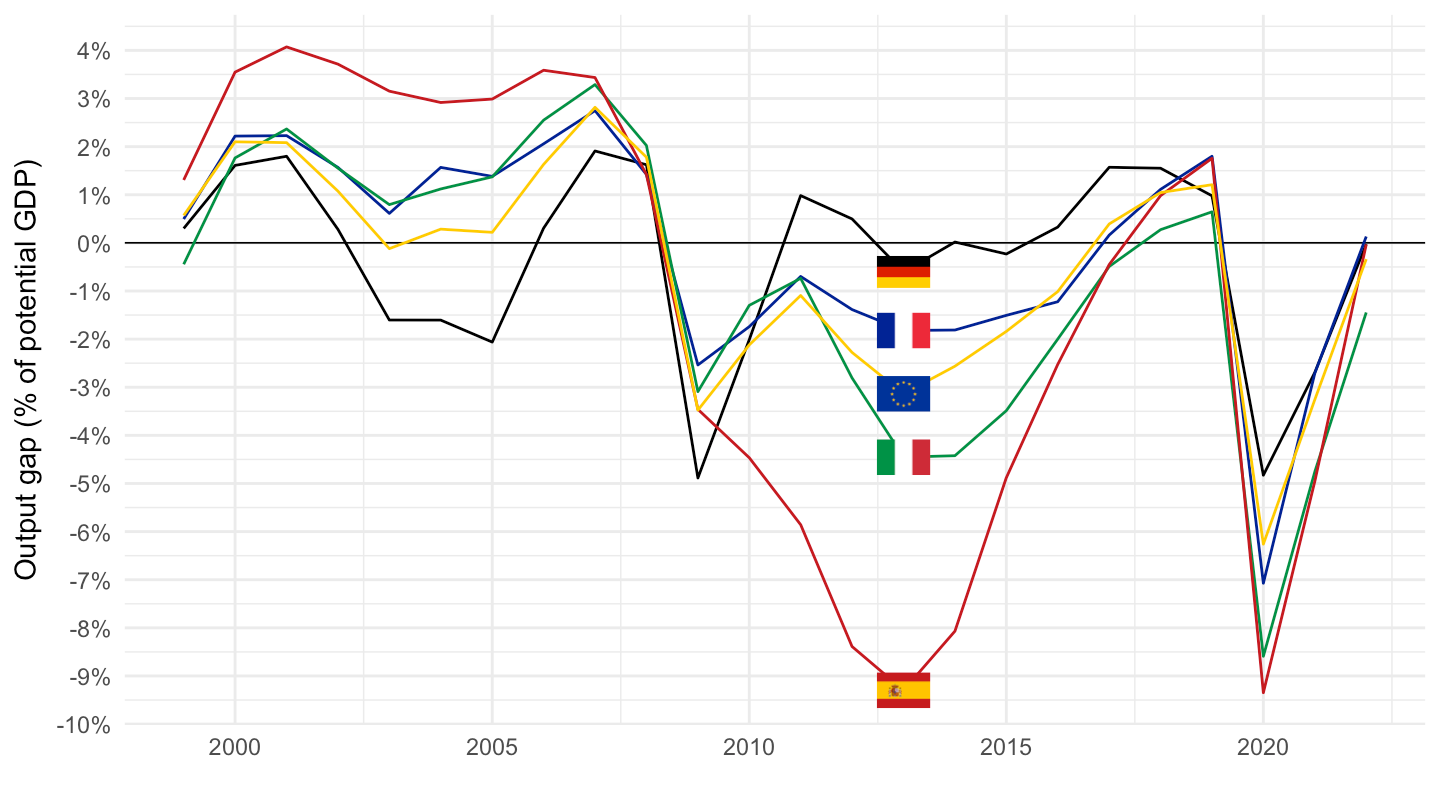
The European Commission’s own accounts put the euro area below potential from 2009 to 2019, with double-digit gaps in Spain and Italy at the trough.
ig_d("ameco", "AVGDGP", "EA19-DEU-FRA-ITA-ESP")| Source | Dataset | Updated | PNG | |
|---|---|---|---|---|
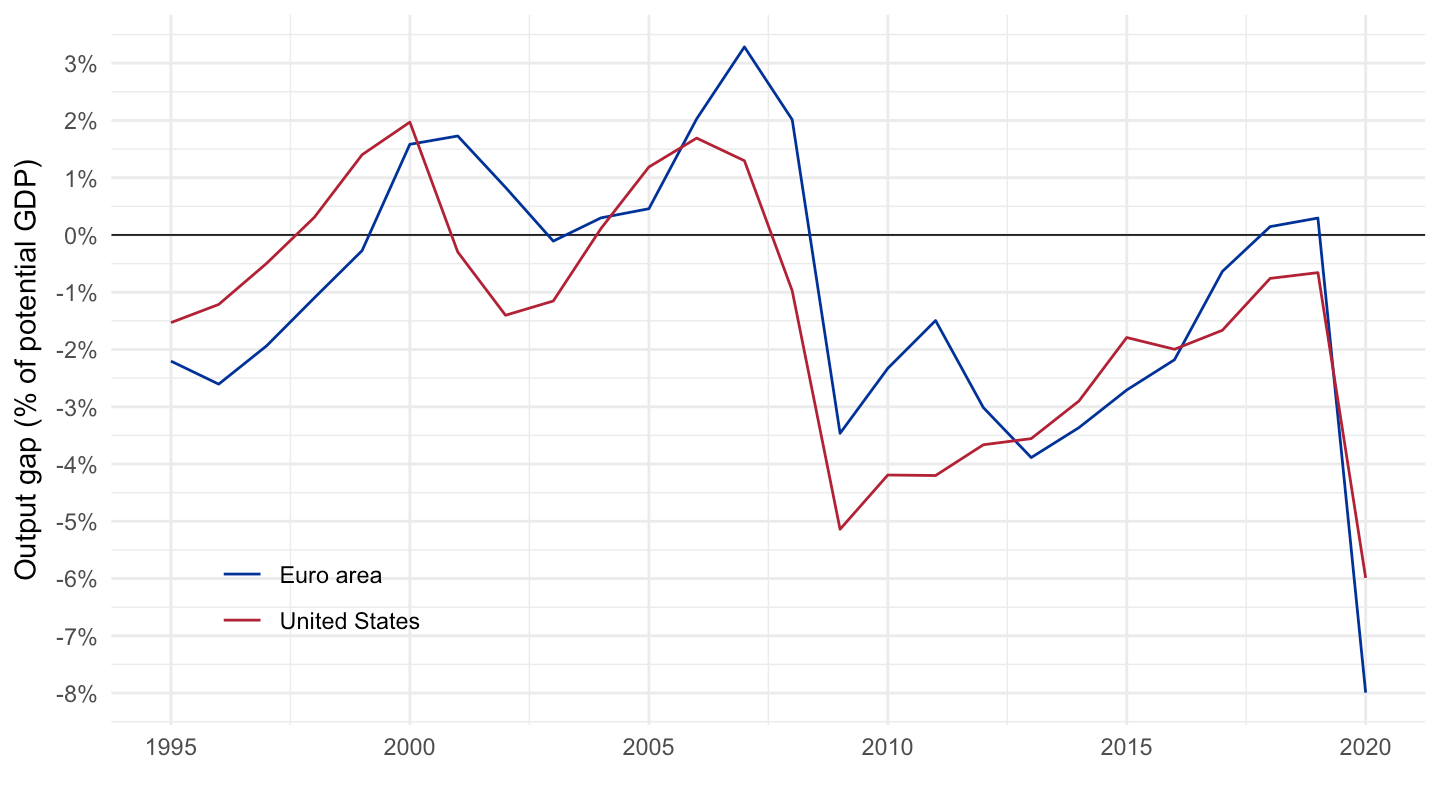
The euro area suffered a double dip (2011-2013) that the United States did not: activity fell back below potential a second time as fiscal policy tightened and the sovereign-debt crisis spread.
ig_d("oecd", "EO_GAP", "EA17-USA")| Source | Dataset | Updated | PNG | |
|---|---|---|---|---|
ig_d("eurostat", "une_rt_m", "EA21-since-1998")| Source | Dataset | Updated | PNG | |
|---|---|---|---|---|
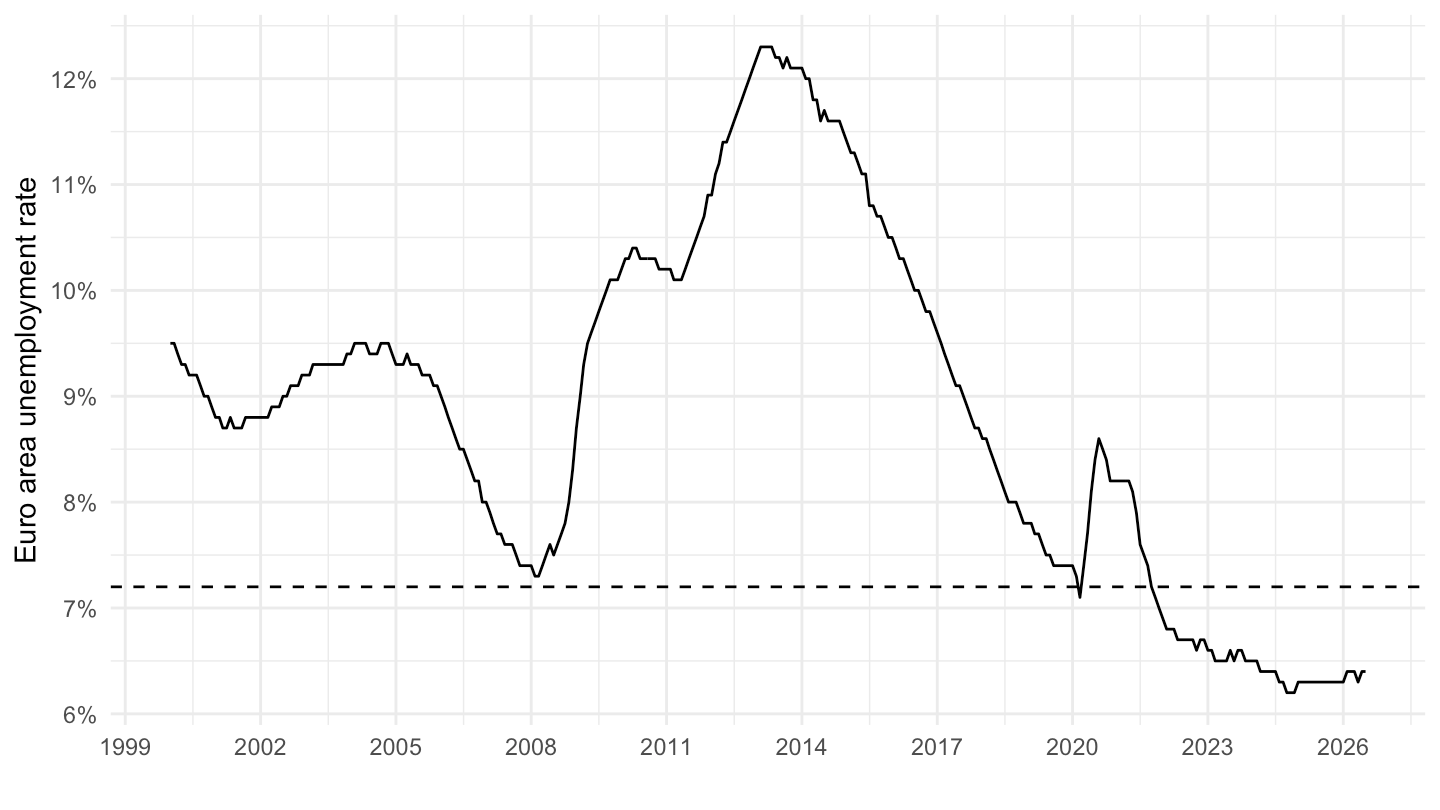
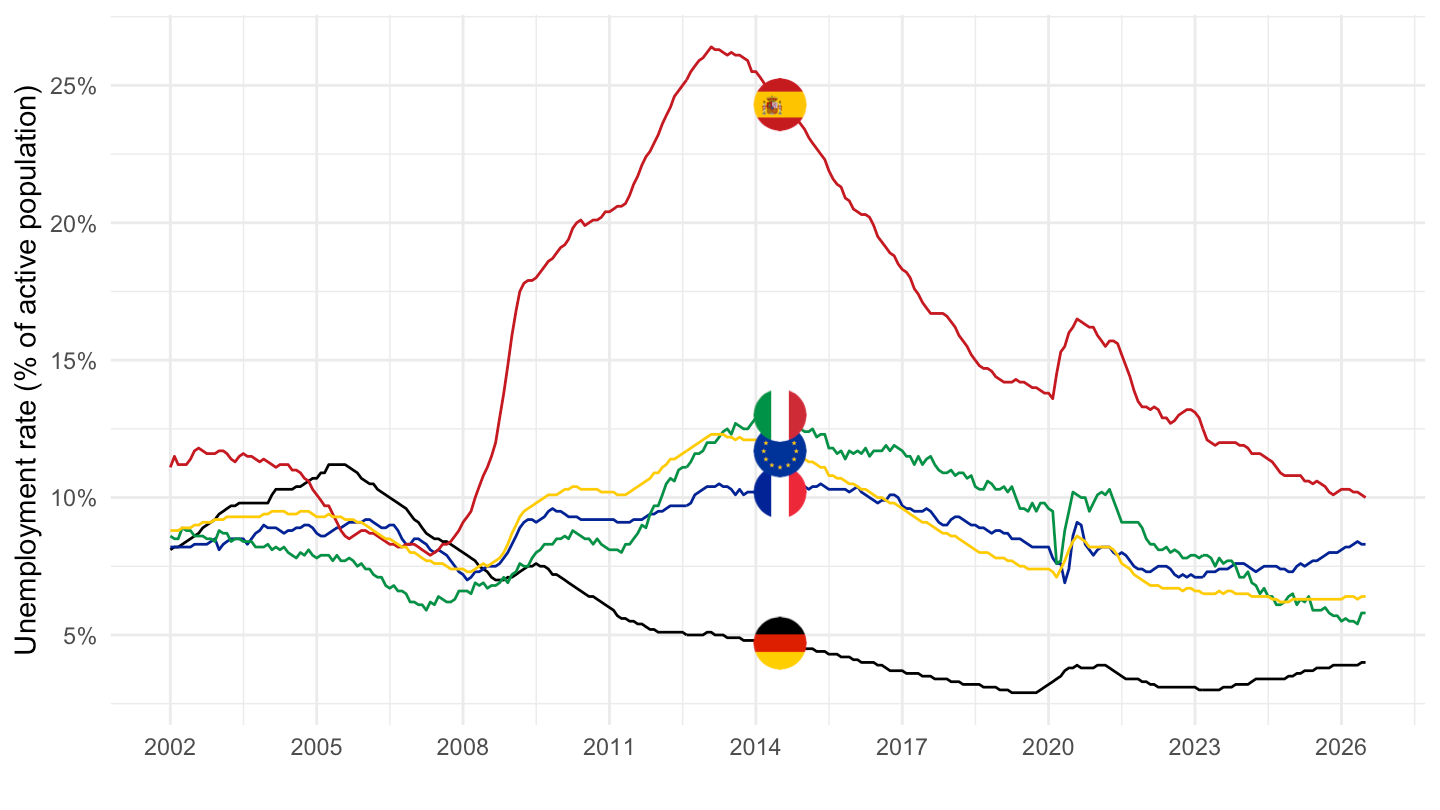
The aggregate hides a wide and long-lasting dispersion: Spanish and Italian unemployment stayed in double digits for most of the 2010s.
ig_d("eurostat", "une_rt_m", "EA21-FR-DE-IT-ES-2002")| Source | Dataset | Updated | PNG | |
|---|---|---|---|---|
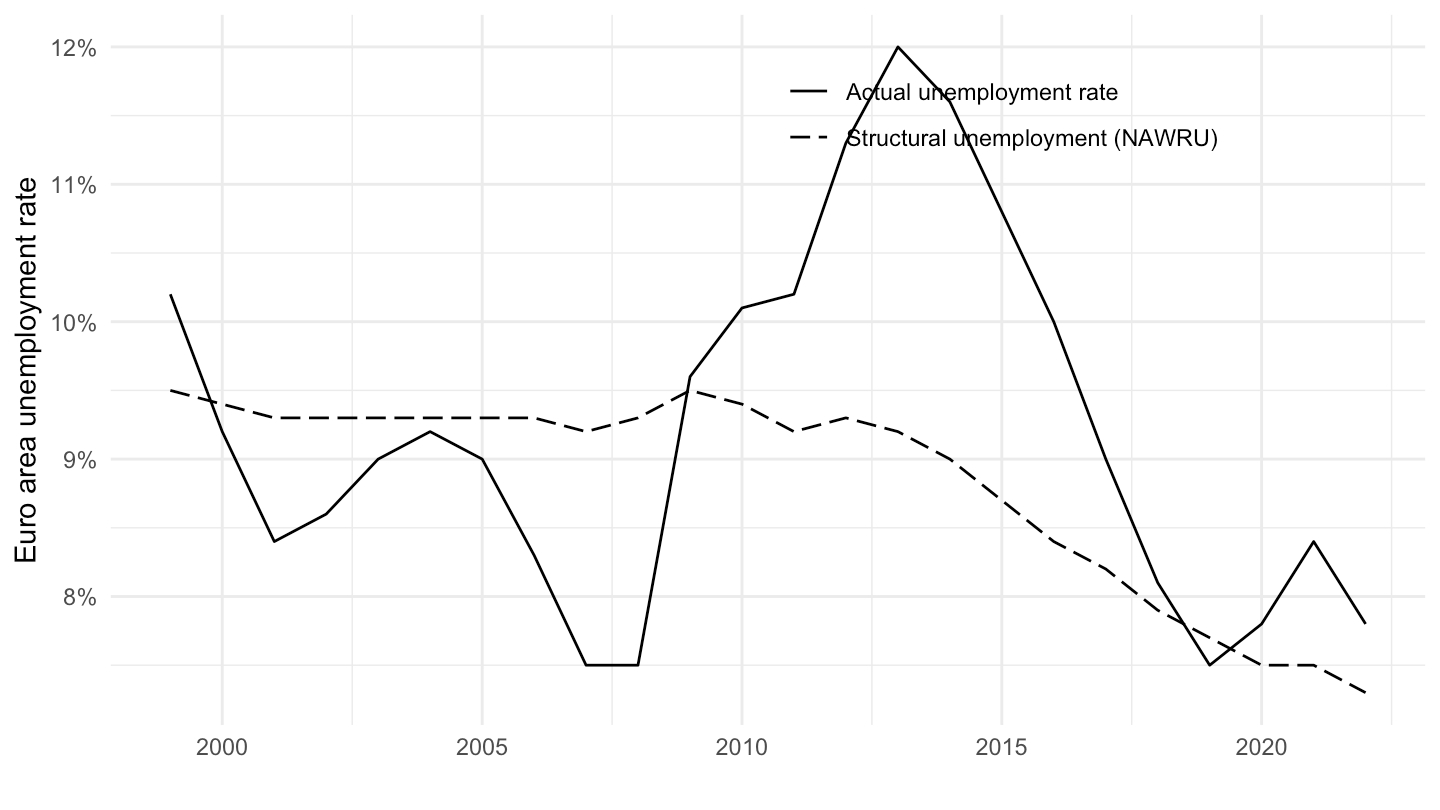
AMECO’s estimate of structural unemployment (the NAWRU) drifts up whenever actual unemployment rises, mechanically re-labelling cyclical joblessness as structural and shrinking the measured amount of slack. Even so, actual unemployment stayed above the NAWRU from 2009 to 2018.
ig_d("ameco", "ZNAWRU", "EA19-unemp-vs-nawru")| Source | Dataset | Updated | PNG | |
|---|---|---|---|---|
The unemployment rate understates slack. Eurostat’s broad measure adds involuntary part-timers, people available to work but not searching, and people searching but not immediately available. On that gauge roughly one in seven members of the extended euro-area labour force was under-used even in 2018-2019.
ig_d("eurostat", "lfsi_sla_q", "SLACK-EA20-FR-DE-ES-IT")| Source | Dataset | Updated | PNG | |
|---|---|---|---|---|
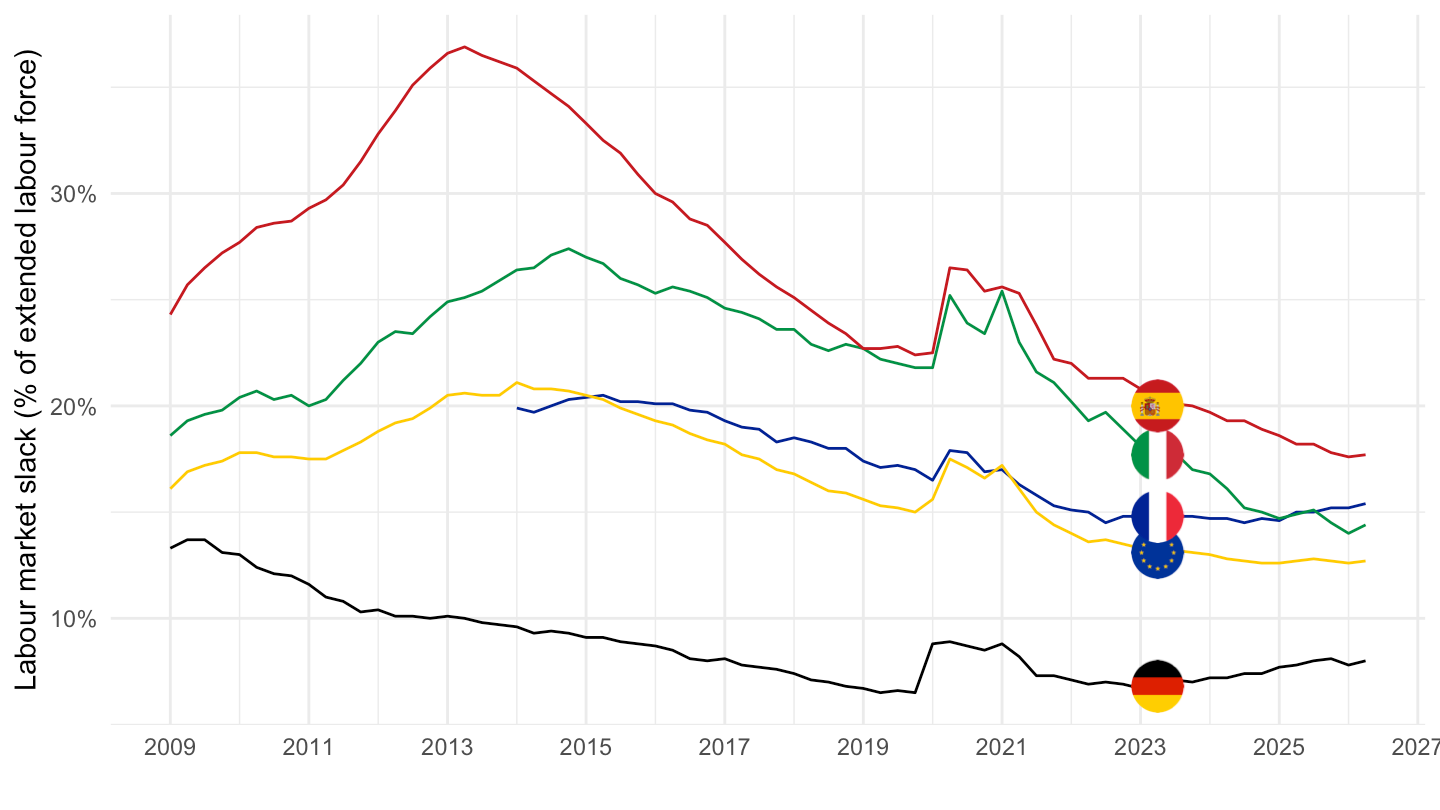
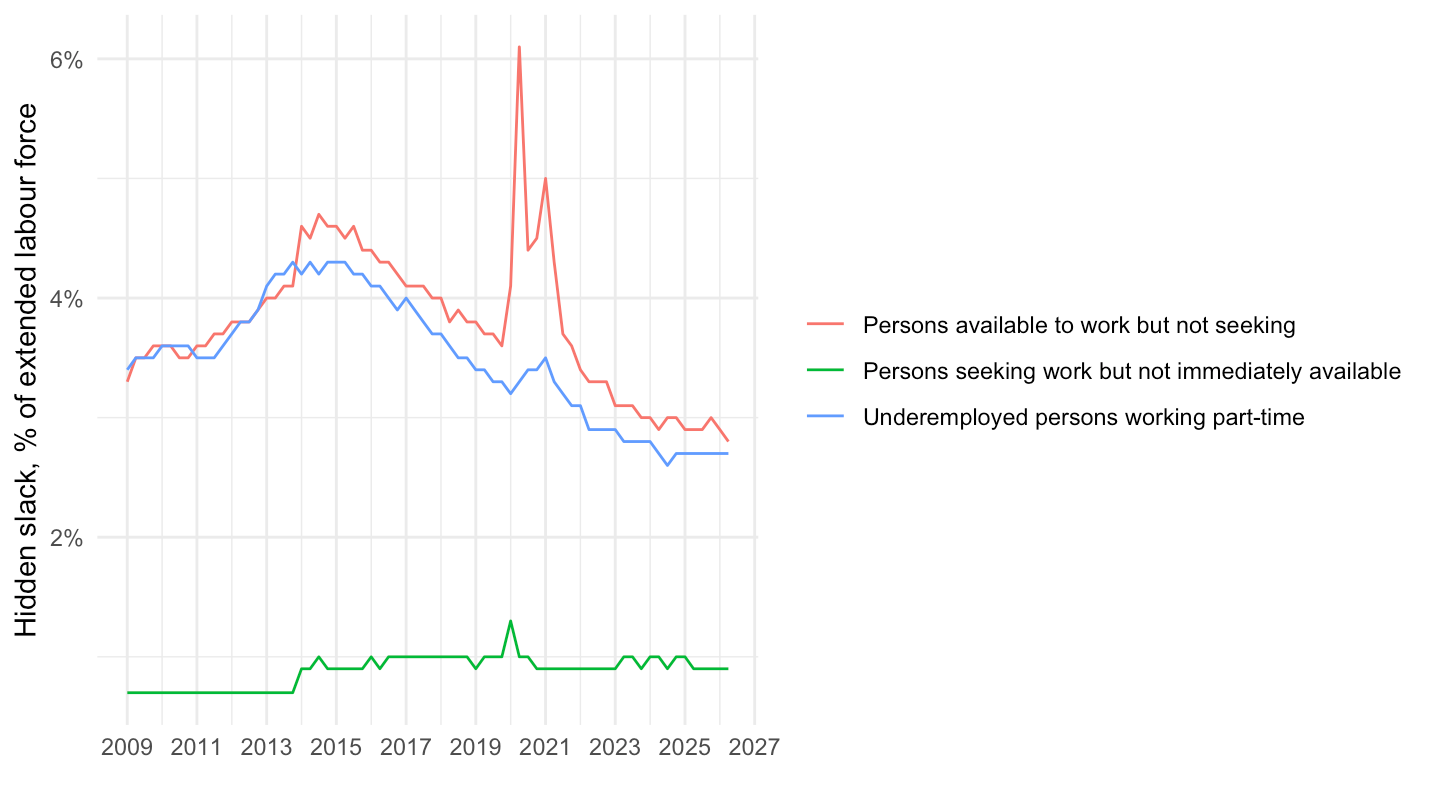
On top of the unemployed, three groups make up broad slack: people working part-time who want more hours, people available to work but not currently searching, and people searching but not immediately available. Together they add several percentage points of the extended labour force.
ig_d("eurostat", "lfsi_sla_q", "EA20-slack-components")| Source | Dataset | Updated | PNG | |
|---|---|---|---|---|
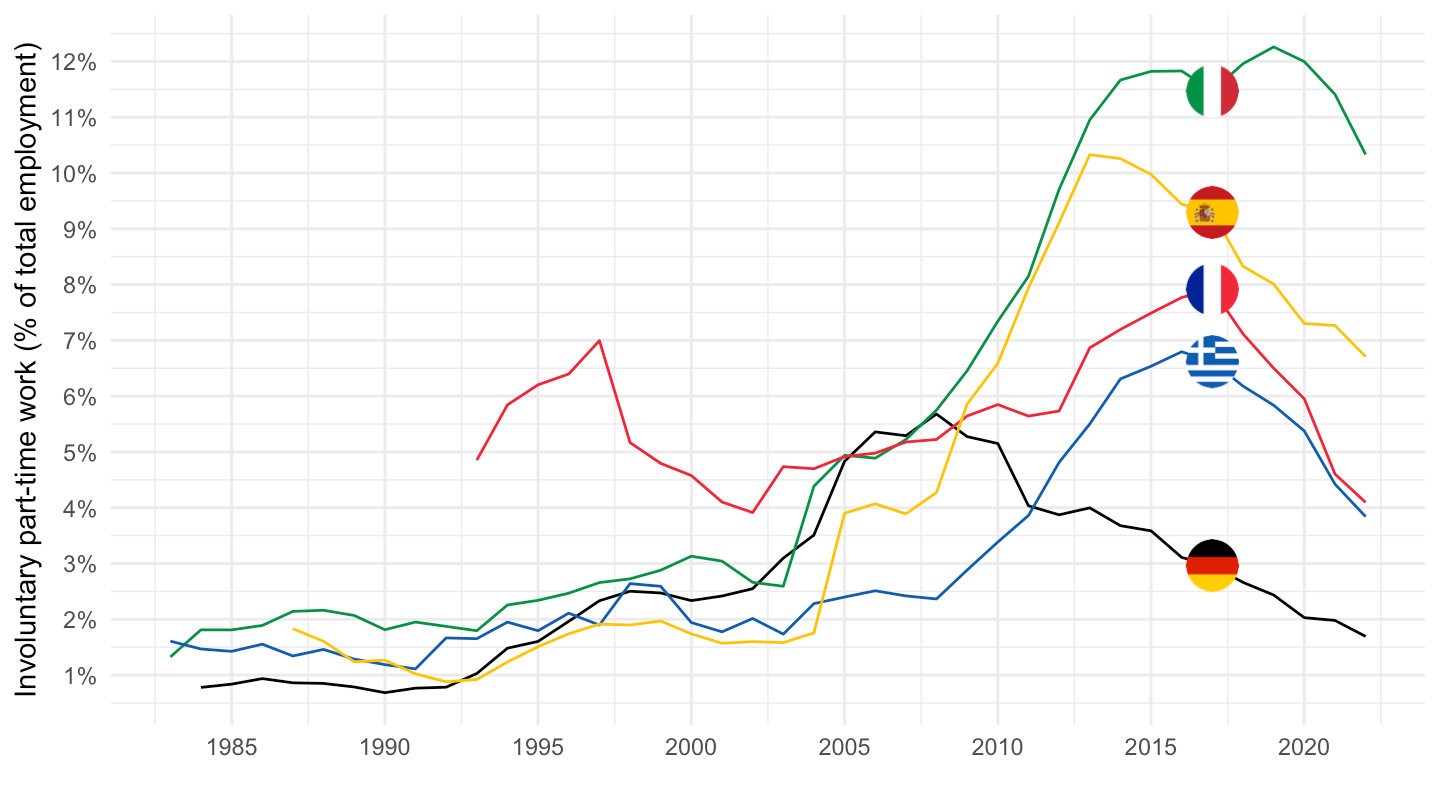
Involuntary part-time employment — people working short hours because they cannot find full-time work — roughly doubled in France, Italy, Spain and Greece after 2008 while it fell in Germany.
ig_d("oecd", "INVPT_I", "SHINV-EMP-FRA-DEU-ITA-ESP-GRC")| Source | Dataset | Updated | PNG | |
|---|---|---|---|---|
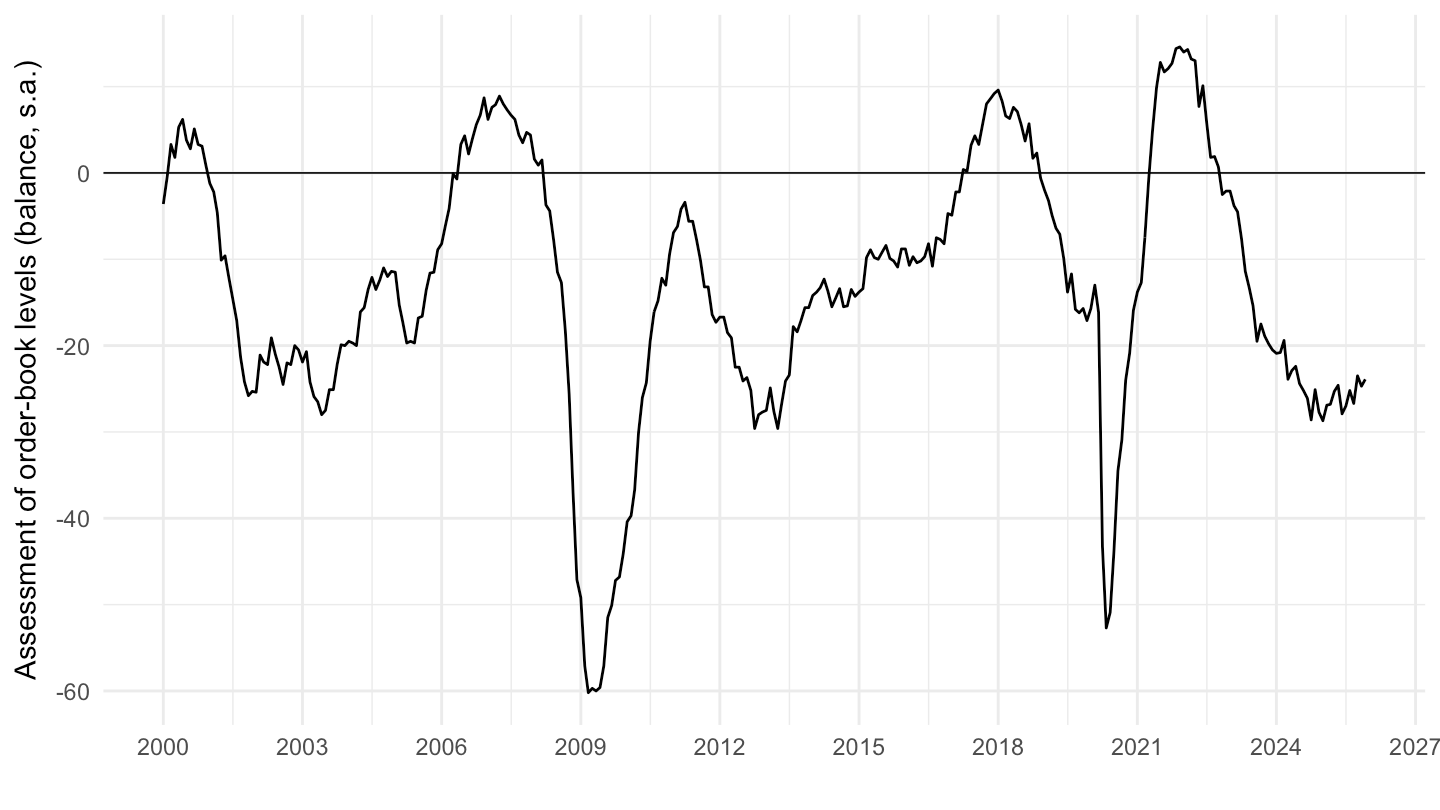
In the European Commission’s industry survey, the balance of firms judging their order books “above” vs “below” normal stayed deeply negative from 2008 through 2013, briefly recovered around 2017-2018, and has turned negative again since 2023: for long stretches the binding constraint has been customers, not capacity.
ig_d("eurostat", "ei_bsin_m_r2", "BS-IOB-EA20-2000")| Source | Dataset | Updated | PNG | |
|---|---|---|---|---|
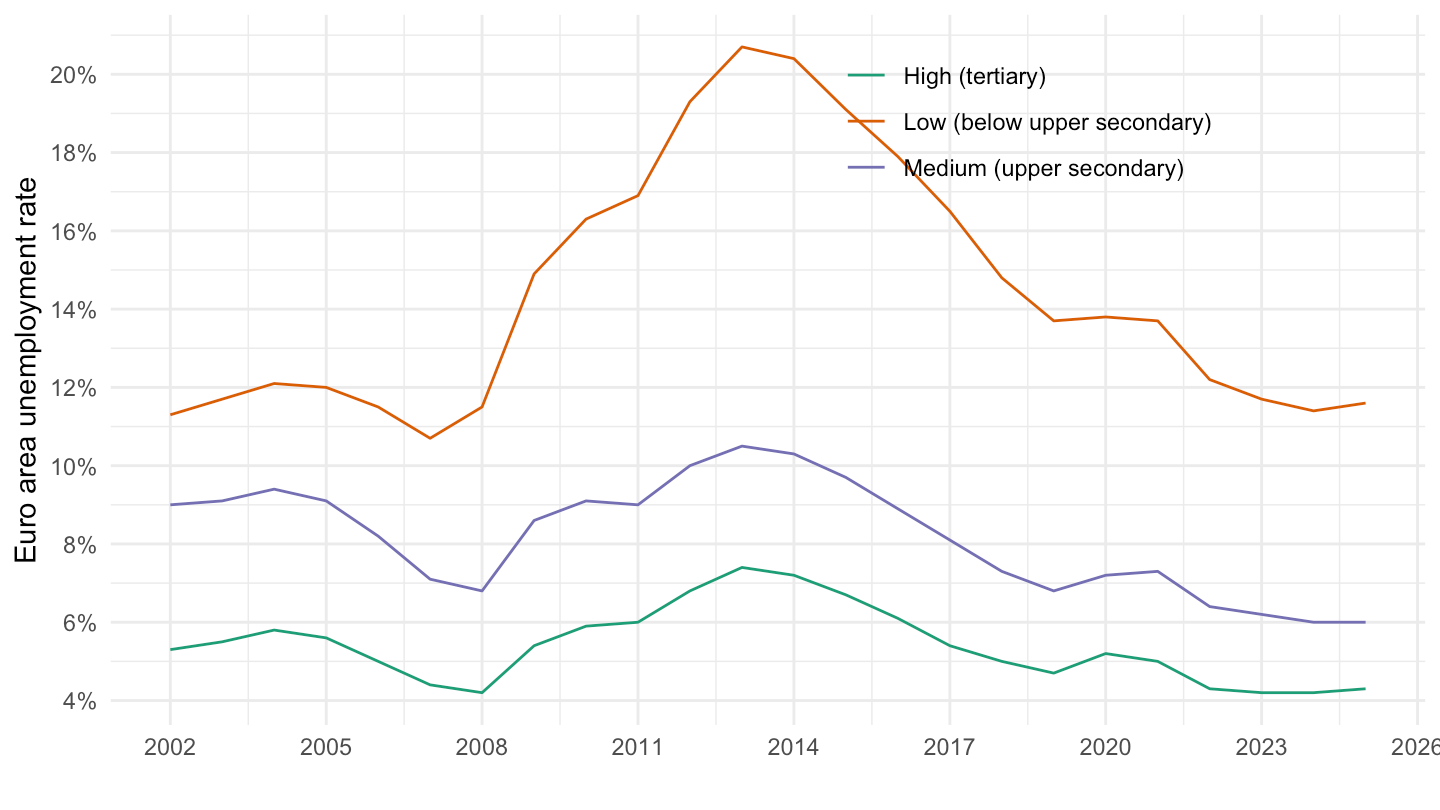
Slack reached the highly educated too: the unemployment rate of the tertiary-educated in the euro area rose after 2008 and stayed elevated, a sign that the shortfall in jobs was economy-wide rather than a qualifications problem.
ig_d("eurostat", "lfsa_urgaed", "EA-unemployment-by-education")| Source | Dataset | Updated | PNG | |
|---|---|---|---|---|
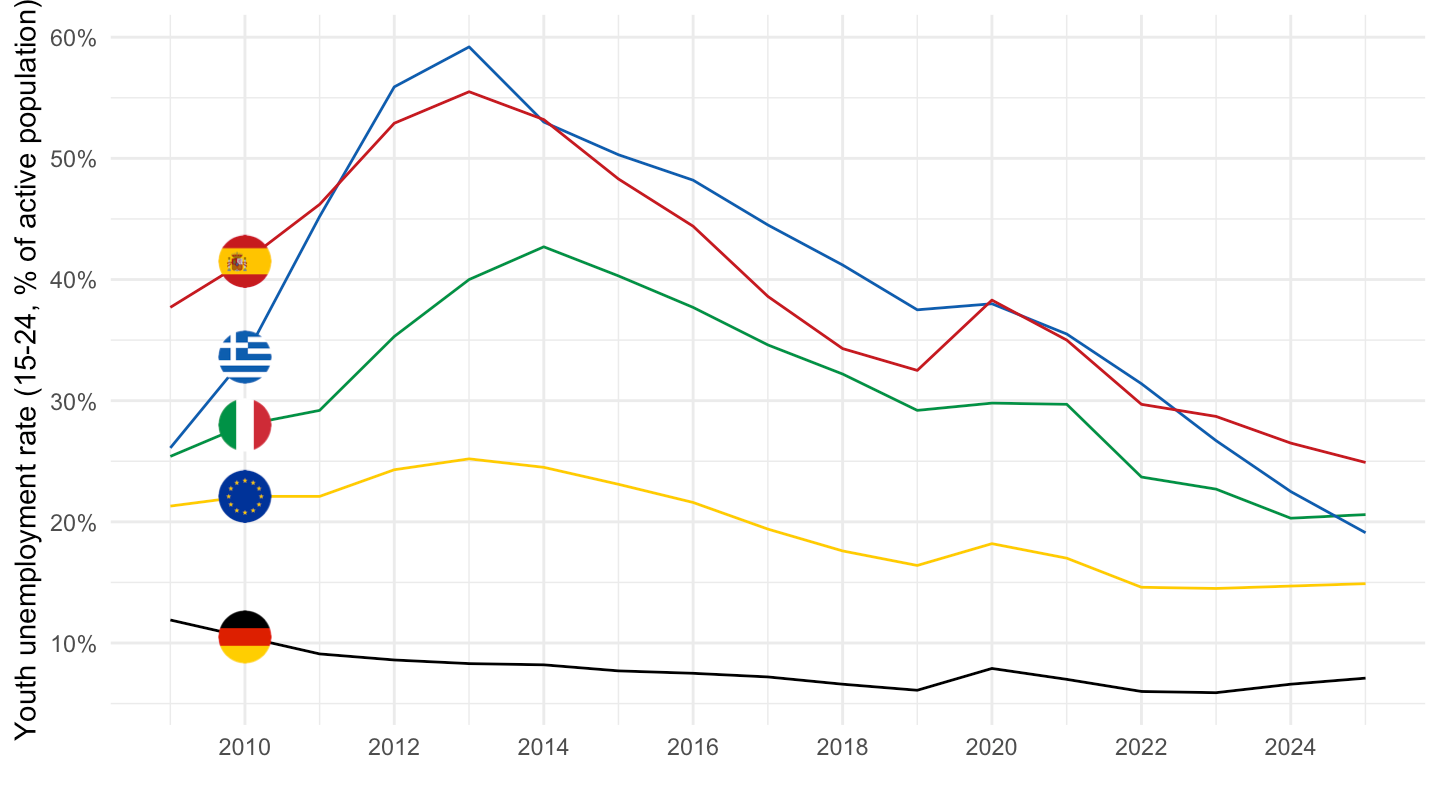
ig_d("eurostat", "tipslm80", "EA20-EL-ES-IT-DE")| Source | Dataset | Updated | PNG | |
|---|---|---|---|---|
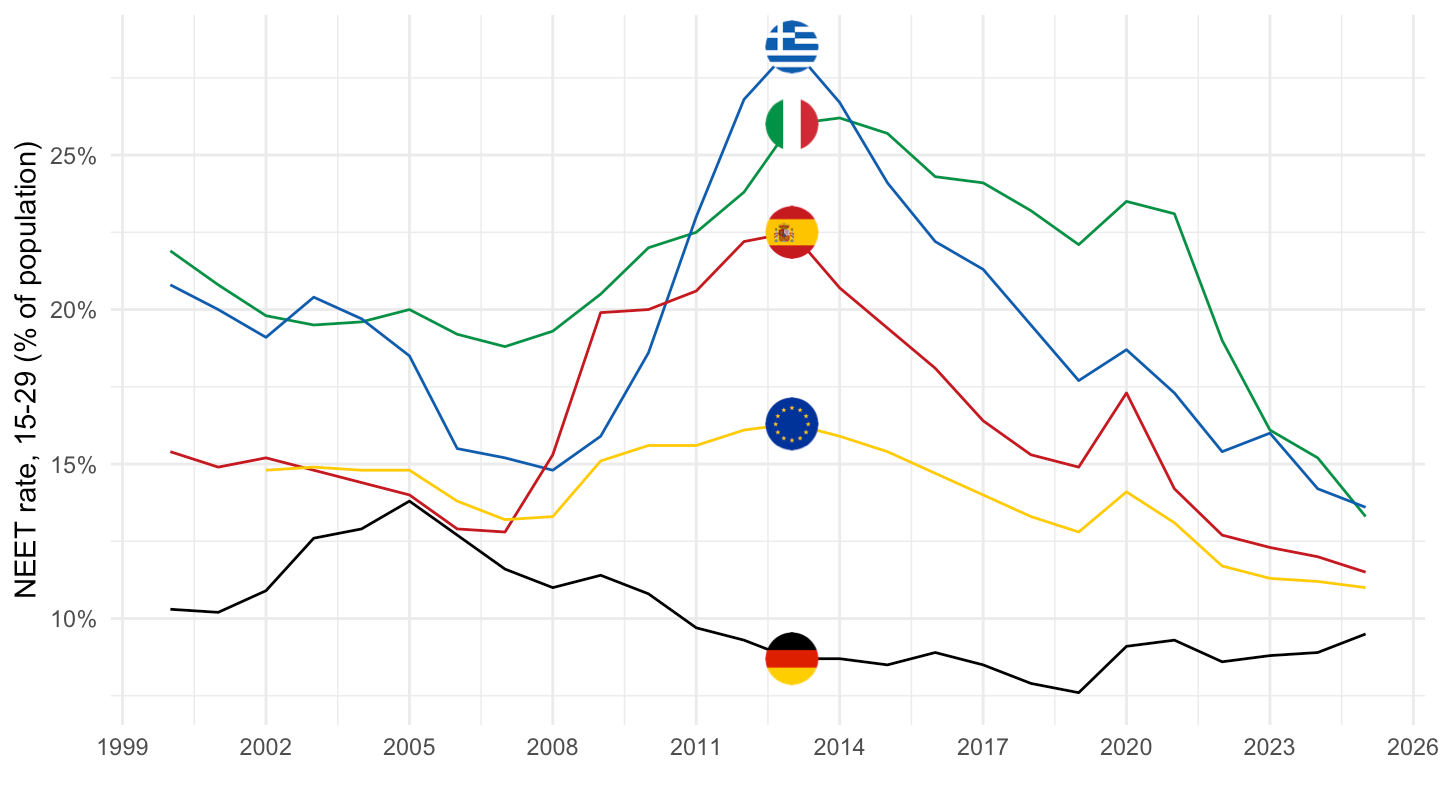
ig_d("eurostat", "edat_lfse_18", "NEET-EA21-IT-ES-EL-DE")| Source | Dataset | Updated | PNG | |
|---|---|---|---|---|
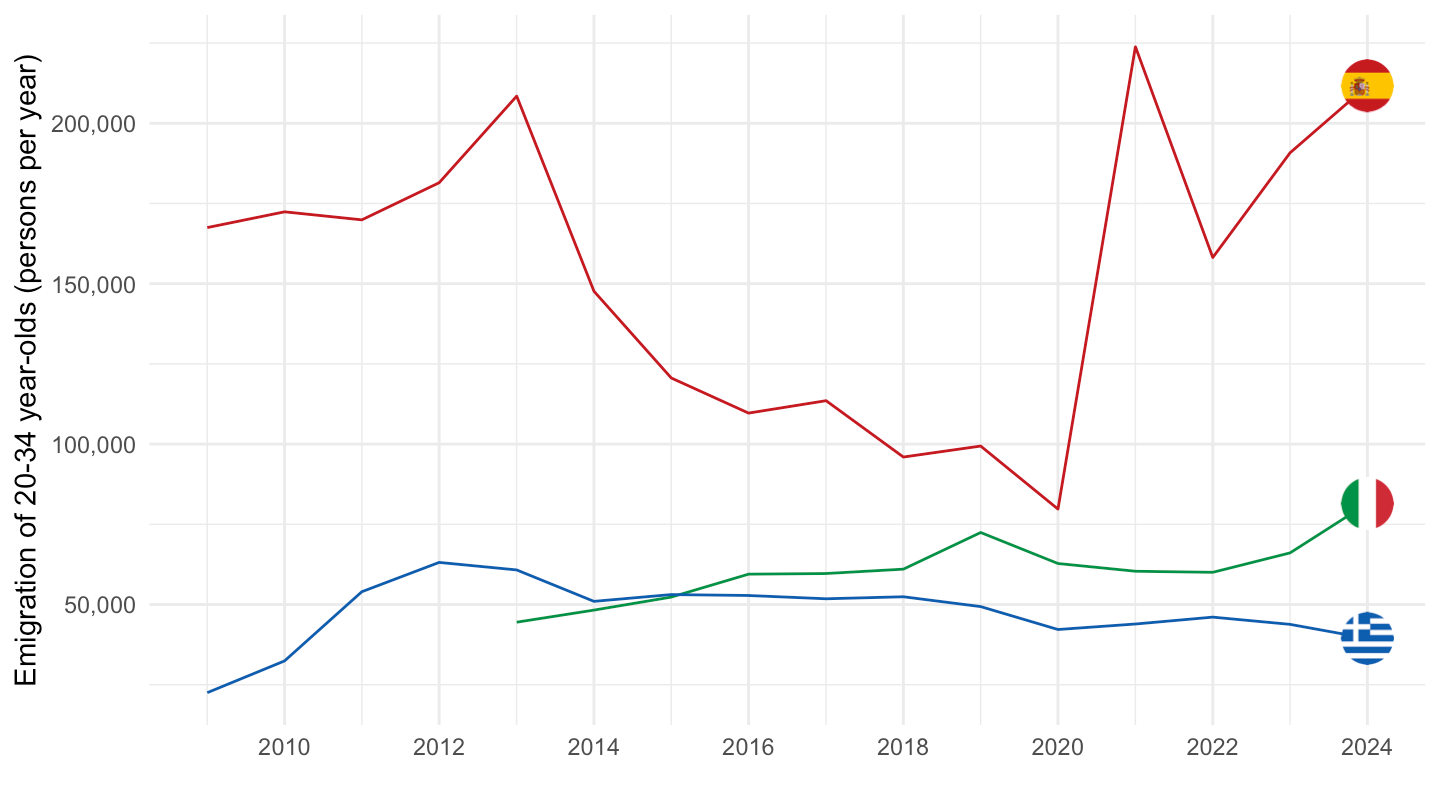
When domestic labour markets stay slack, workers leave. Emigration of 20-34 year-olds from Italy rose through the 2010s and is still climbing; Spain and Greece spiked during the crisis years. (Spain’s series also reflects large numbers of foreign nationals leaving again, so read the level with care — the direction is the point.)
ig_d("eurostat", "migr_emi2", "emigration-young-south")| Source | Dataset | Updated | PNG | |
|---|---|---|---|---|
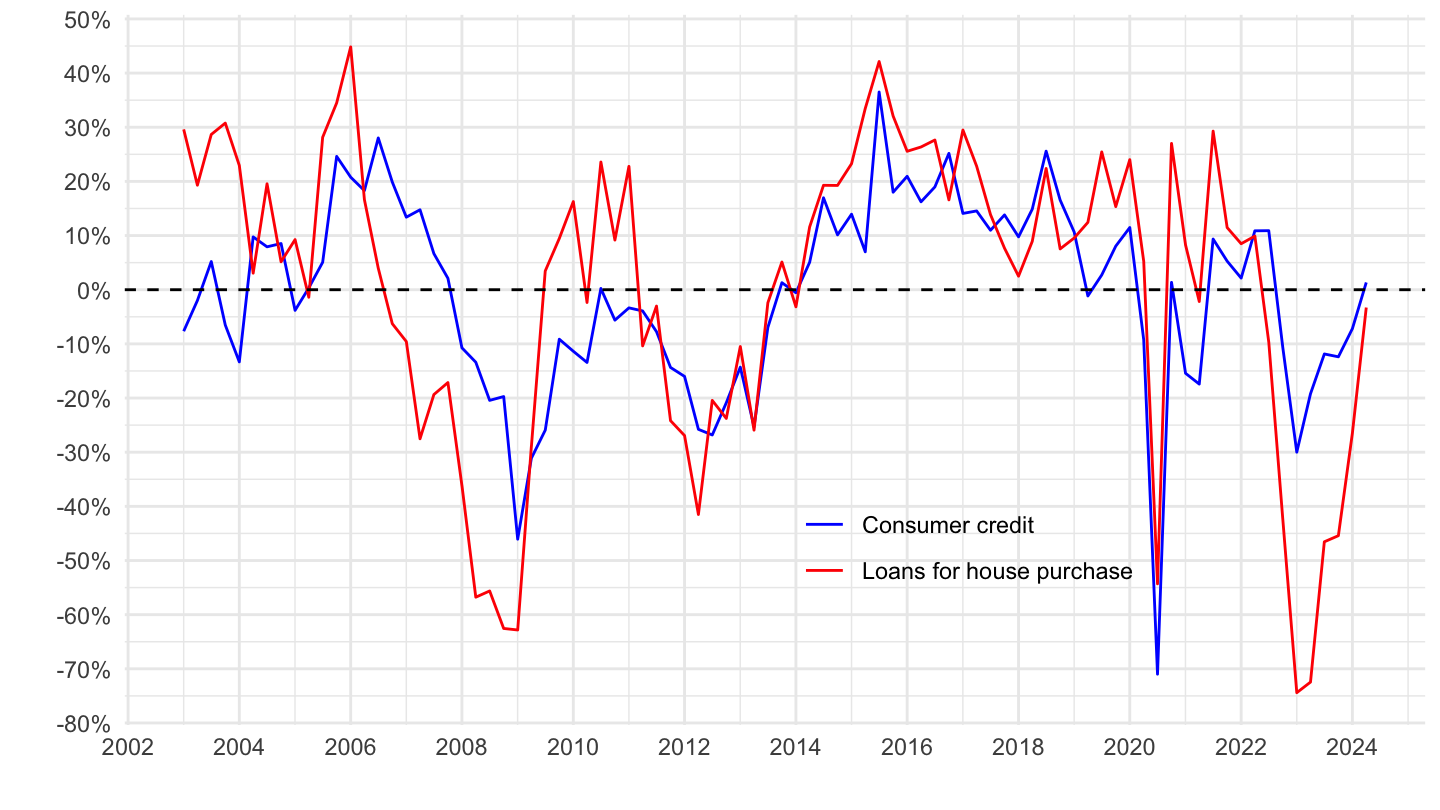
ig_d("ecb", "BLS", "BLS.Q.U2.ALL.Z.H.H-C.B3.ZZ.D.WFNET")| Source | Dataset | Updated | PNG | |
|---|---|---|---|---|
| source | dataset | Title | Updated |
|---|---|---|---|
 ameco ameco |
AVGDGP | Gap between actual and potential gross domestic product at 2015 reference levels - AVGDGP | 2026-10-15 |
| ameco |
ZNAWRU | Non-accelerating wage rate of unemployment - ZNAWRU | 2026-10-15 |
 ecb ecb |
BLS | Bank Lending Survey Statistics - BLS | 2026-10-15 |
 eurostat eurostat |
edat_lfse_18 | Participation rate of young persons in education and training by labour status (incl. NEET rates) - edat_lfse_18 | 2026-09-11 |
| eurostat |
ei_bsin_m_r2 | Business surveys - NACE Rev. 2 activity - Industry - monthly data - ei_bsin_m_r2 | 2026-09-30 |
| eurostat |
lfsa_urgaed | Unemployment rates by sex, age and educational attainment level (%) - lfsa_urgaed | 2026-09-11 |
| eurostat |
lfsi_sla_q | Labour market transitions - quarterly data - lfsi_sla_q | 2026-09-11 |
| eurostat |
migr_emi2 | Emigration by age and sex - migr_emi2 | 2026-09-23 |
| eurostat |
tipslm80 | Youth unemployment rate - % of active population aged 15-24 - tipslm80 | 2026-09-11 |
| eurostat |
une_rt_m | Unemployment by sex and age – monthly data - une_rt_m | 2026-10-09 |
 oecd oecd |
EO_GAP | Output gap as a percentage of potential GDP - GAP - EO - EO_GAP | 2026-08-02 |
| oecd |
INVPT_I | Incidence of involuntary part time workers - INVPT_I | 2026-08-02 |
| oecd |
QNA_EXPENDITURE_CAPITA | Quarterly National Accounts, GDP Per Capita - QNA_EXPENDITURE_CAPITA | 2026-10-15 |