
Last observation: 2025 (N = 7497)
First observation: 2000 (N = 4561)
Last data update: 11 sept. 2026, 23:00
Last compile: 09 oct. 2026, 22:14
NEET rate = young people who are Neither Employed nor in Education or Training, i.e. wstatus == "NEMP" (not employed) and training == "NO_FE_NO_NFE" (neither formal nor non-formal education/training), as a percentage of the population of the age group.
edat_lfse_18 |>
  filter(geo %in% c("FR", "DE", "IT", "ES", "EL", "PL"),
         age == "Y15-29",
         sex == "T",
         wstatus == "NEMP",
         training == "NO_FE_NO_NFE") |>
  year_to_date() |>

  add_flag_color("Geo") |>
  mutate(values = values/100) |>
  ggplot() + geom_line(aes(x = date, y = values, color = color)) +
  theme_minimal() + scale_color_identity() + add_flags +
  scale_x_date(breaks = as.Date(paste0(seq(1960, 2100, 2), "-01-01")),
               labels = date_format("%Y")) +
  xlab("") + ylab("NEET rate, 15-29 years (% of population)") +
  scale_y_continuous(breaks = 0.01*seq(0, 100, 2),
                     labels = scales::percent_format(accuracy = 1))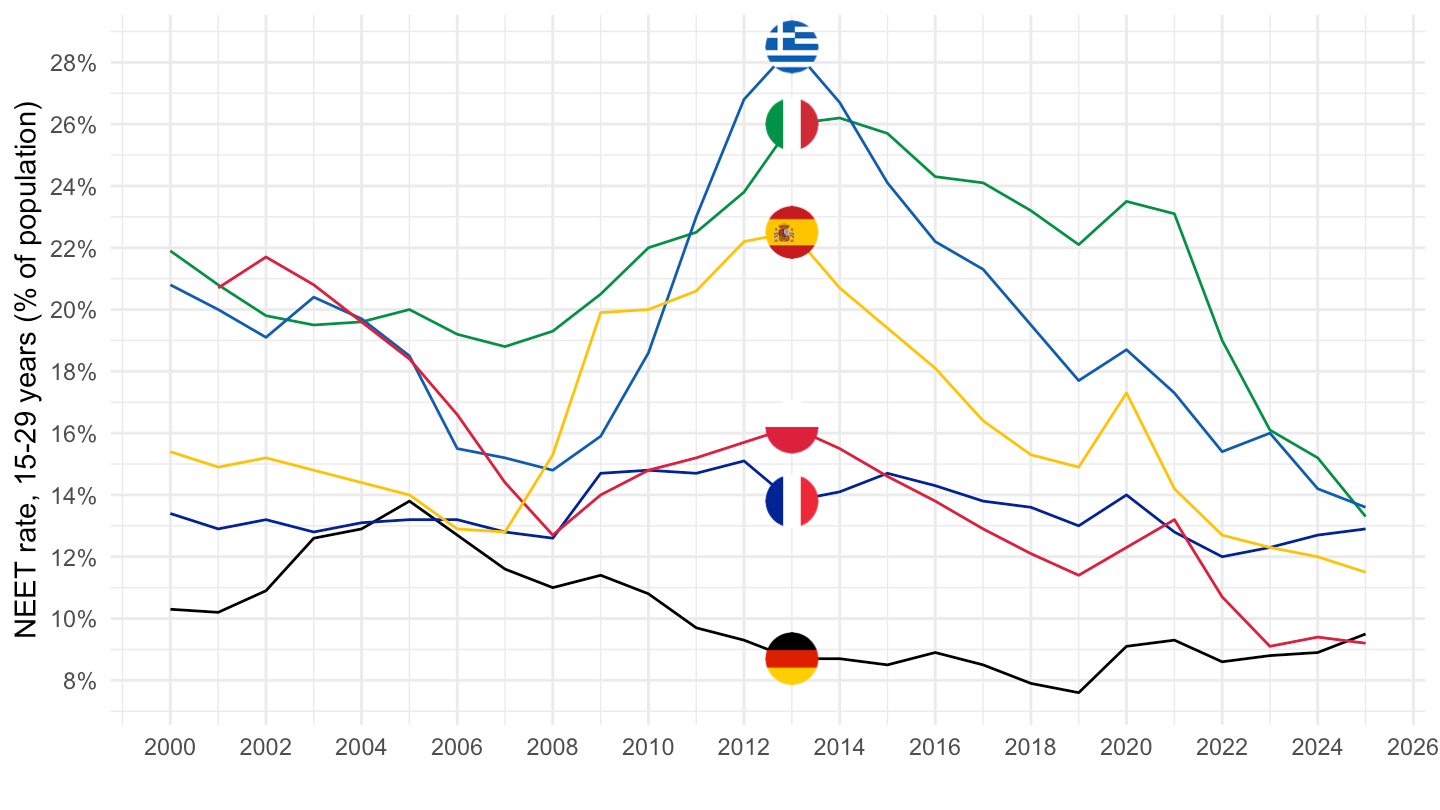
edat_lfse_18 |>
  filter(geo == "FR",
         age %in% c("Y15-19", "Y20-24", "Y25-29"),
         sex == "T",
         wstatus == "NEMP",
         training == "NO_FE_NO_NFE") |>
  year_to_date() |>

  ggplot() + geom_line() + theme_minimal() +
  aes(x = date, y = values/100, color = Age, linetype = Age) +
  scale_color_manual(values = viridis(4)[1:3]) +
  scale_x_date(breaks = as.Date(paste0(seq(1960, 2100, 2), "-01-01")),
               labels = date_format("%Y")) +
  theme(legend.position = c(0.15, 0.85),
        legend.title = element_blank()) +
  xlab("") + ylab("NEET rate in France (% of population)") +
  scale_y_continuous(breaks = 0.01*seq(0, 100, 2),
                     labels = scales::percent_format(accuracy = 1))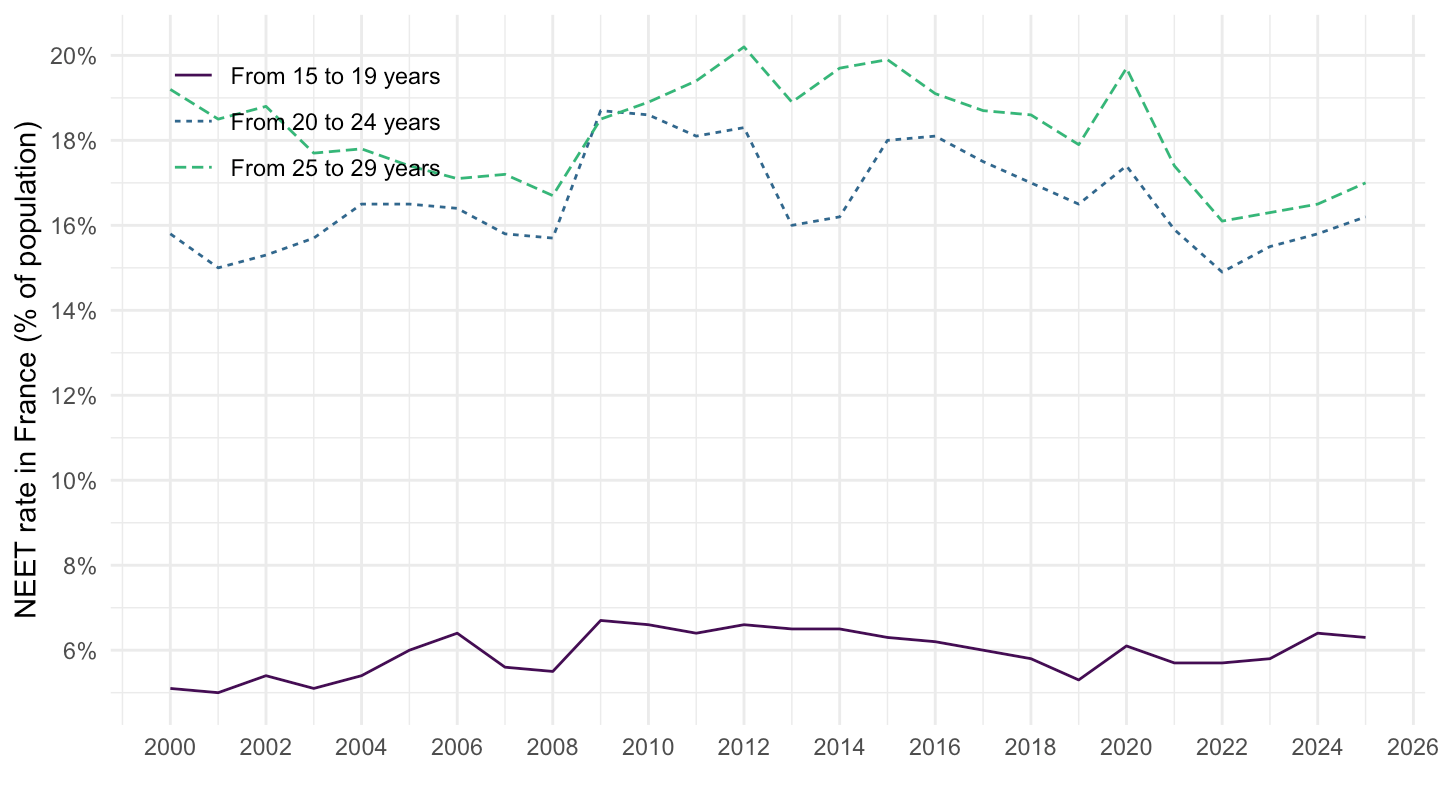
edat_lfse_18 |>
  filter(geo == "EU27_2020",
         age == "Y15-29",
         sex %in% c("M", "F"),
         wstatus == "NEMP",
         training == "NO_FE_NO_NFE") |>
  year_to_date() |>

  ggplot() + geom_line() + theme_minimal() +
  aes(x = date, y = values/100, color = Sex) +
  scale_x_date(breaks = as.Date(paste0(seq(1960, 2100, 2), "-01-01")),
               labels = date_format("%Y")) +
  theme(legend.position = c(0.15, 0.85),
        legend.title = element_blank()) +
  xlab("") + ylab("NEET rate, EU27 15-29 years (% of population)") +
  scale_y_continuous(breaks = 0.01*seq(0, 100, 2),
                     labels = scales::percent_format(accuracy = 1))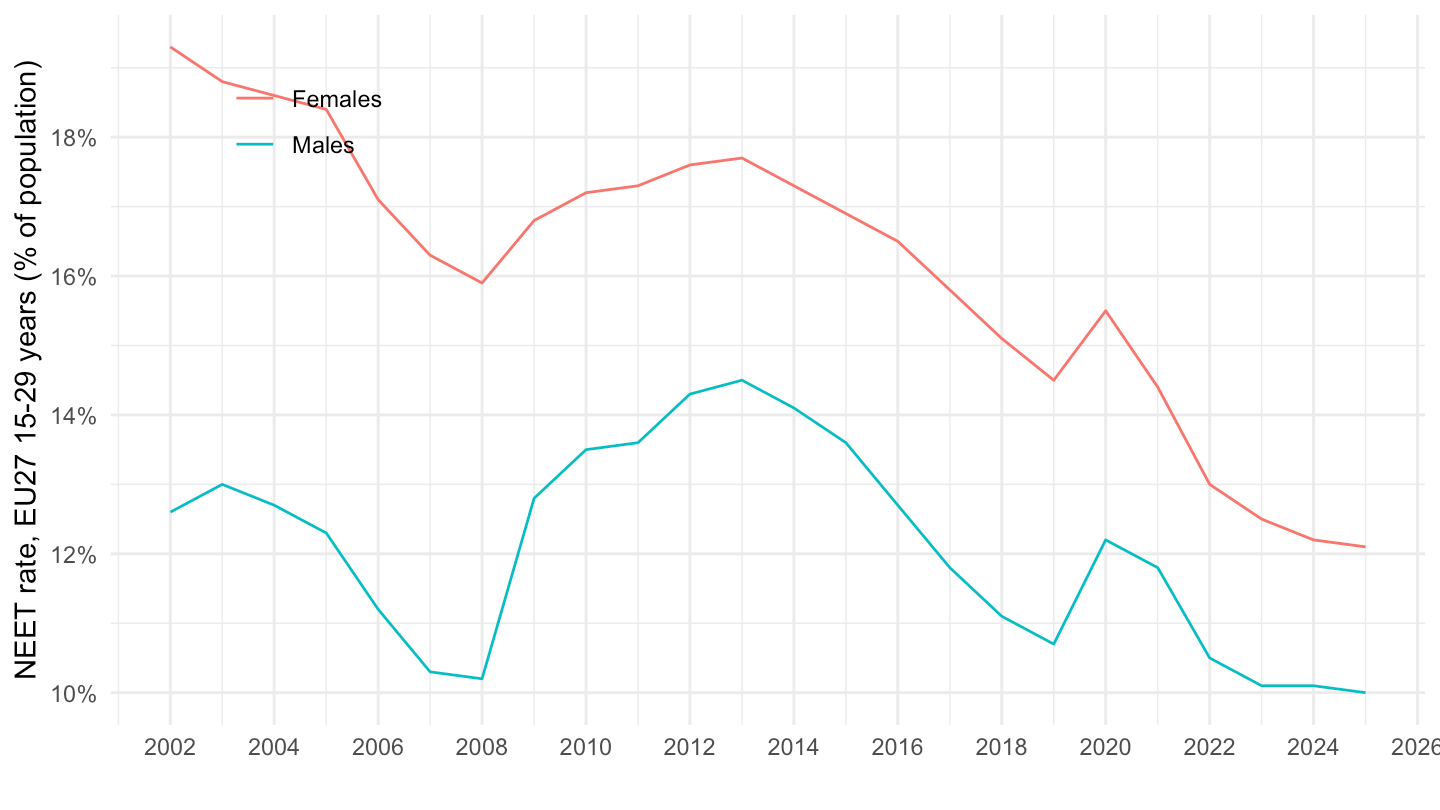
Two complementary measures of labour market slack among young Europeans: the unemployment rate (share of the active population aged 15-24 without a job) and the NEET rate (share of the whole population aged 15-29 neither employed nor in education/training, which also captures discouraged/inactive youth who have left the labour force altogether).
neet_eu <- edat_lfse_18 |>
  filter(geo == "EU27_2020",
         age == "Y15-29",
         sex == "T",
         wstatus == "NEMP",
         training == "NO_FE_NO_NFE") |>
  transmute(time, `NEET rate (15-29)` = values)

une_eu <- une_rt_a |>
  filter(geo == "EU27_2020",
         age == "Y15-24",
         sex == "T",
         unit == "PC_ACT") |>
  transmute(time, `Unemployment rate (15-24)` = values)

neet_eu |>
  full_join(une_eu, by = "time") |>
  year_to_date() |>
  gather(Variable, value, -date) |>
  filter(!is.na(value)) |>

  ggplot() + geom_line() + theme_minimal() +
  aes(x = date, y = value/100, color = Variable) +
  scale_color_manual(values = viridis(3)[1:2]) +
  scale_x_date(breaks = as.Date(paste0(seq(1960, 2100, 2), "-01-01")),
               labels = date_format("%Y")) +
  theme(legend.position = c(0.25, 0.9),
        legend.title = element_blank()) +
  xlab("") + ylab("Percentage") +
  scale_y_continuous(breaks = 0.01*seq(0, 100, 2),
                     labels = scales::percent_format(accuracy = 1))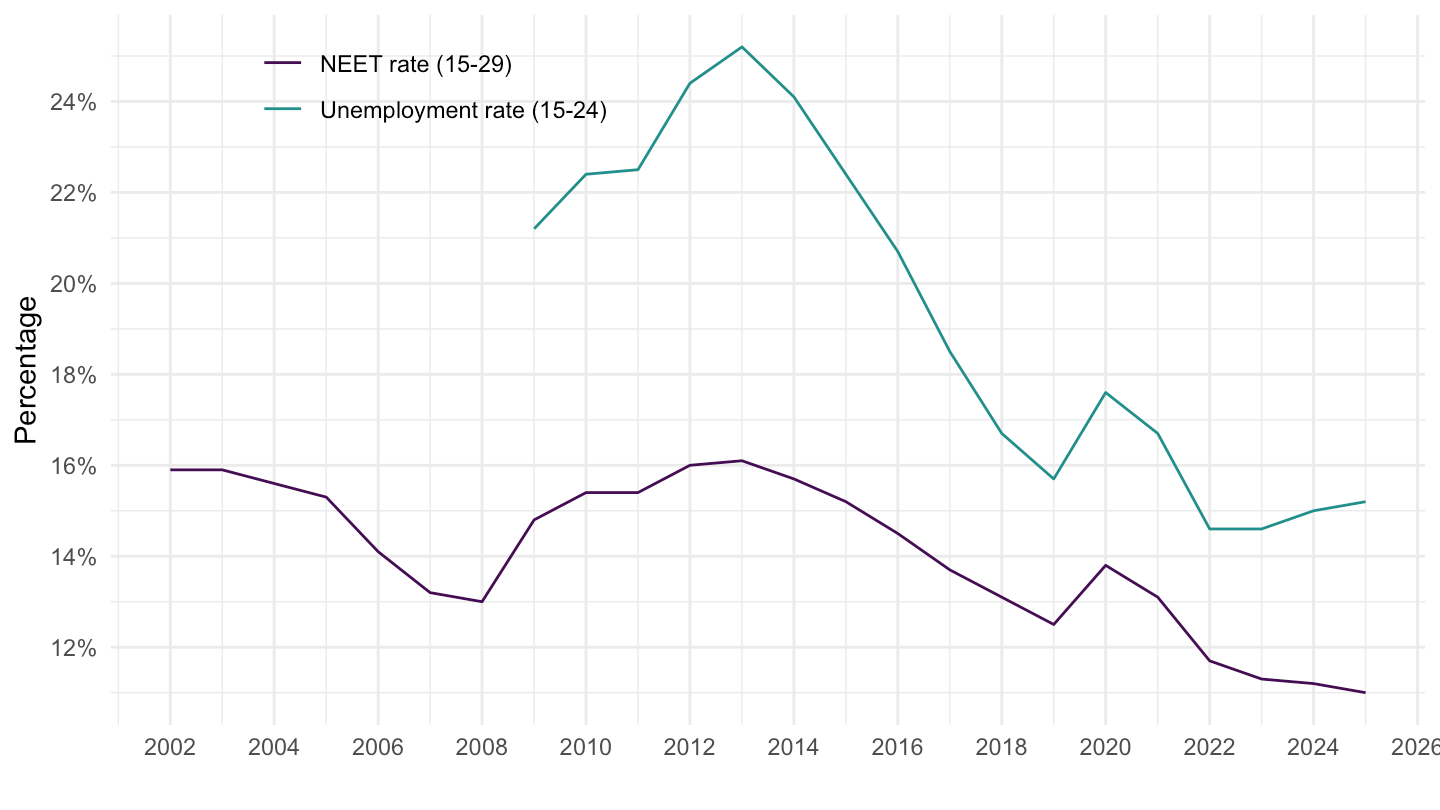
neet_countries <- edat_lfse_18 |>
  filter(geo %in% c("FR", "DE", "IT", "ES", "EL"),
         age == "Y15-29",
         sex == "T",
         wstatus == "NEMP",
         training == "NO_FE_NO_NFE") |>
  transmute(geo, Geo, time, `NEET rate (15-29)` = values)

une_countries <- une_rt_a |>
  filter(geo %in% c("FR", "DE", "IT", "ES", "EL"),
         age == "Y15-24",
         sex == "T",
         unit == "PC_ACT") |>
  transmute(geo, time, `Unemployment rate (15-24)` = values)

neet_countries |>
  full_join(une_countries, by = c("geo", "time")) |>
  year_to_date() |>
  gather(Variable, value, -geo, -Geo, -date) |>
  filter(!is.na(value)) |>

  ggplot() + geom_line() + theme_minimal() +
  aes(x = date, y = value/100, color = Variable, linetype = Variable) +
  facet_wrap(~Geo) +
  scale_color_manual(values = viridis(3)[1:2]) +
  scale_x_date(breaks = as.Date(paste0(seq(1960, 2100, 5), "-01-01")),
               labels = date_format("%Y")) +
  theme(legend.position = "bottom",
        legend.title = element_blank()) +
  xlab("") + ylab("Percentage") +
  scale_y_continuous(breaks = 0.01*seq(0, 100, 10),
                     labels = scales::percent_format(accuracy = 1))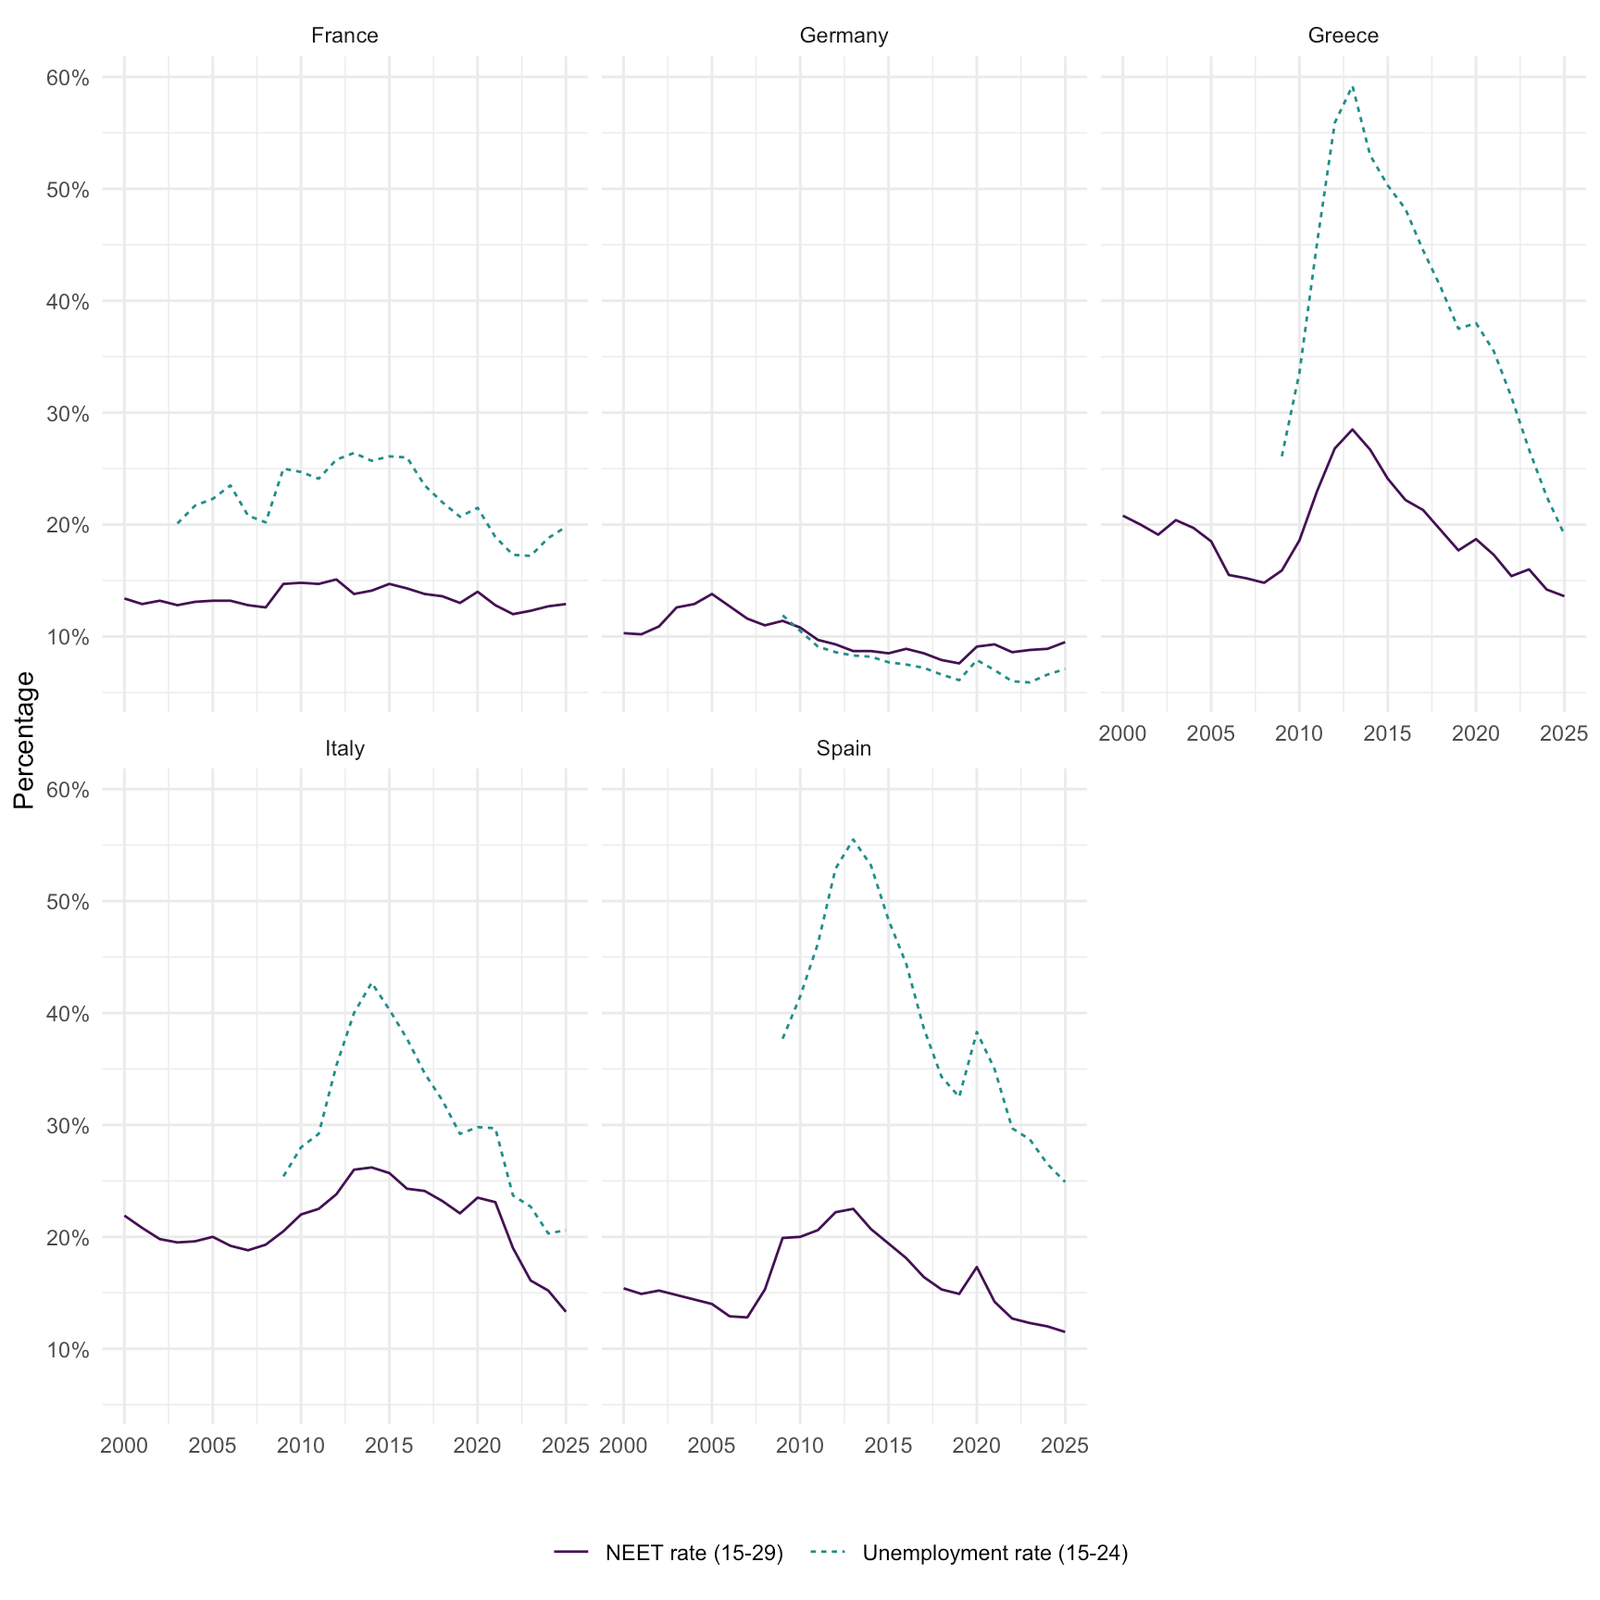
edat_lfse_18 |>
  filter(geo %in% c("EA21", "IT", "ES", "EL", "DE"),
         age == "Y15-29", sex == "T",
         wstatus == "NEMP", training == "NO_FE_NO_NFE") |>
  year_to_date() |>
  filter(!is.na(values)) |>
  mutate(Geo = ifelse(geo == "EA21", "Europe", Geo),
         Geo = ifelse(geo == "DE", "Germany", Geo)) |>
  add_flag_color("Geo") |>
  mutate(values = values / 100) |>
  ggplot() + geom_line(aes(x = date, y = values, color = color)) +
  theme_minimal() + scale_color_identity() + add_flags +
  scale_x_date(breaks = as.Date(paste0(seq(1990, 2100, 3), "-01-01")),
               labels = date_format("%Y")) +
  xlab("") + ylab("NEET rate, 15-29 (% of population)") +
  scale_y_continuous(breaks = 0.01 * seq(0, 100, 5),
                     labels = scales::percent_format(accuracy = 1))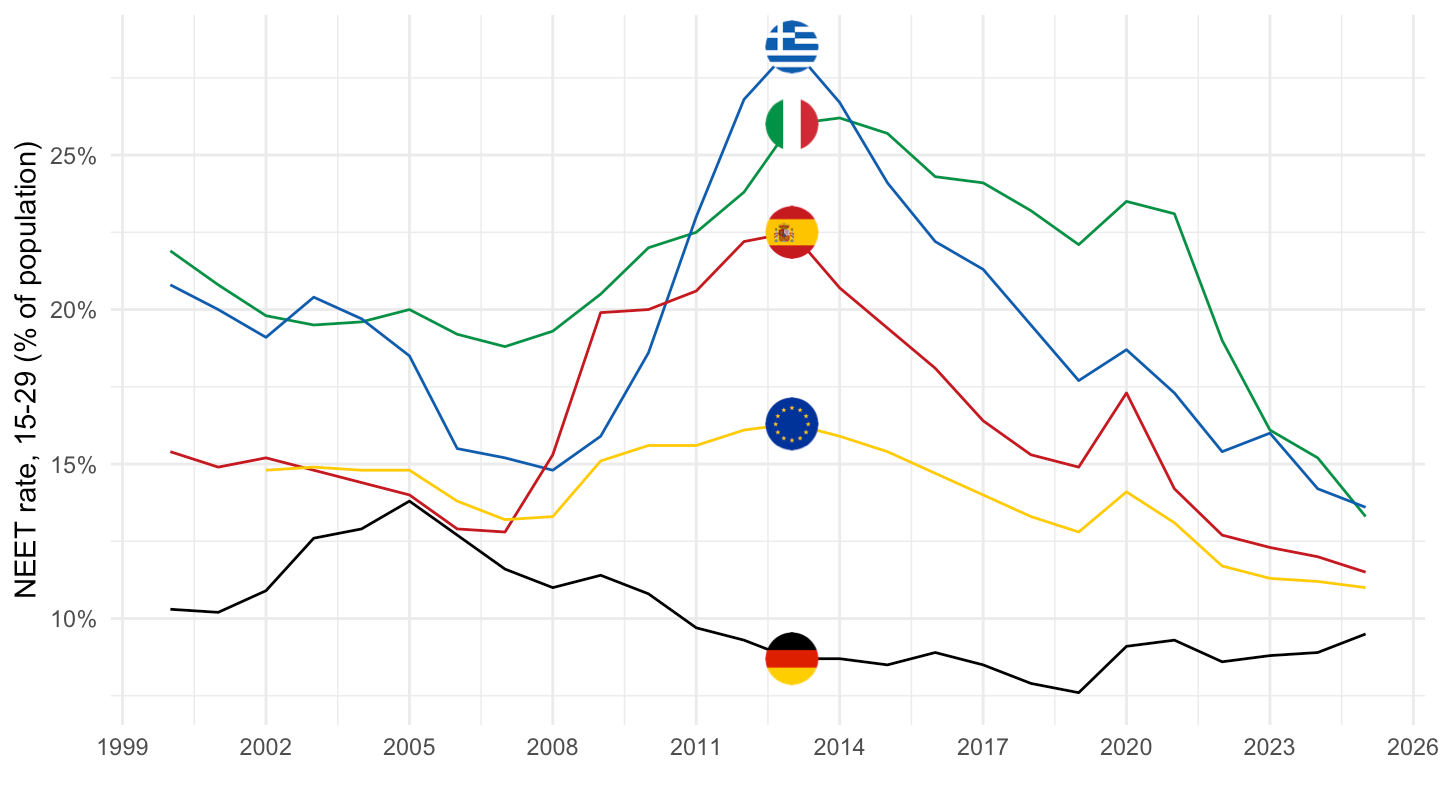
| source | dataset | Title | Updated |
|---|---|---|---|


