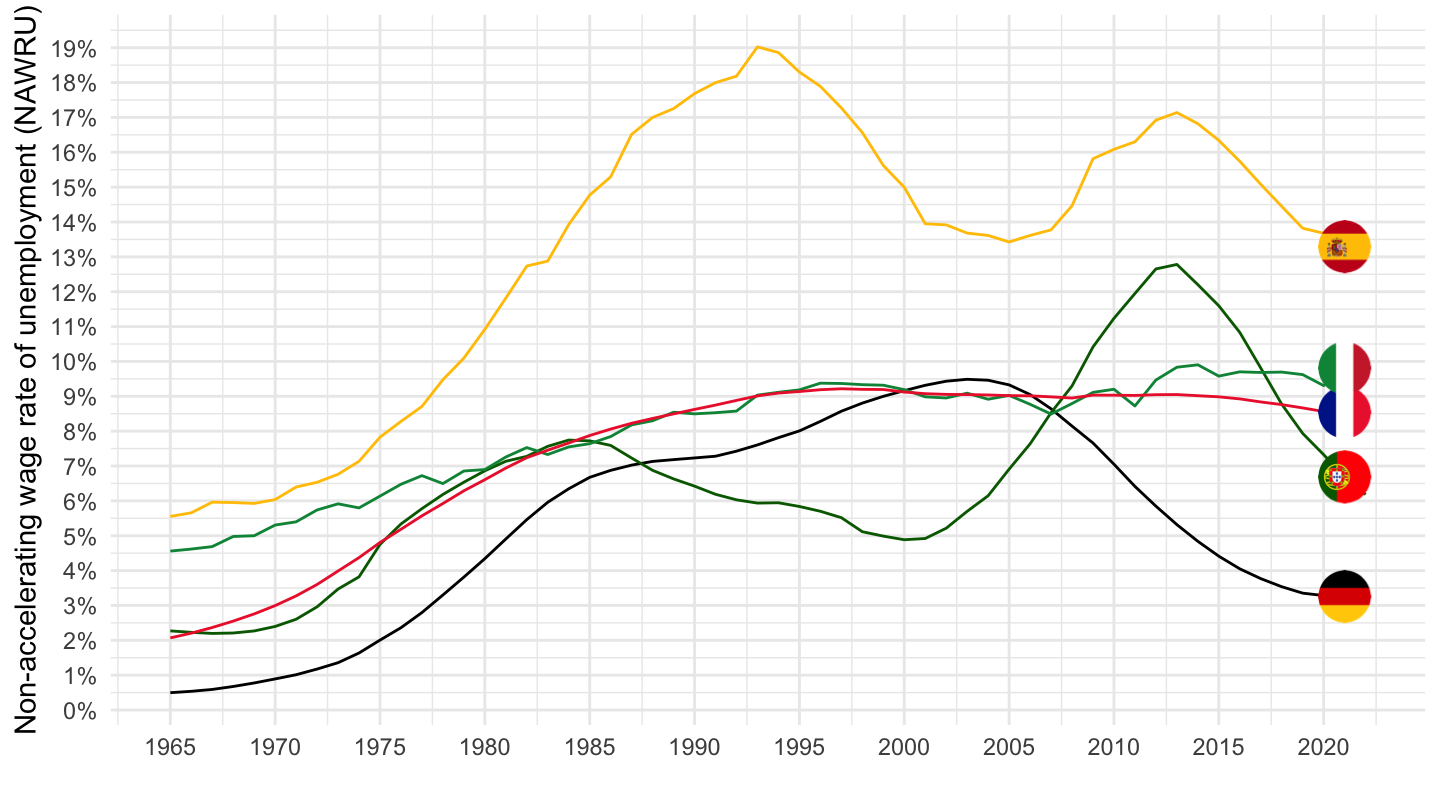
ZNAWRU %>%
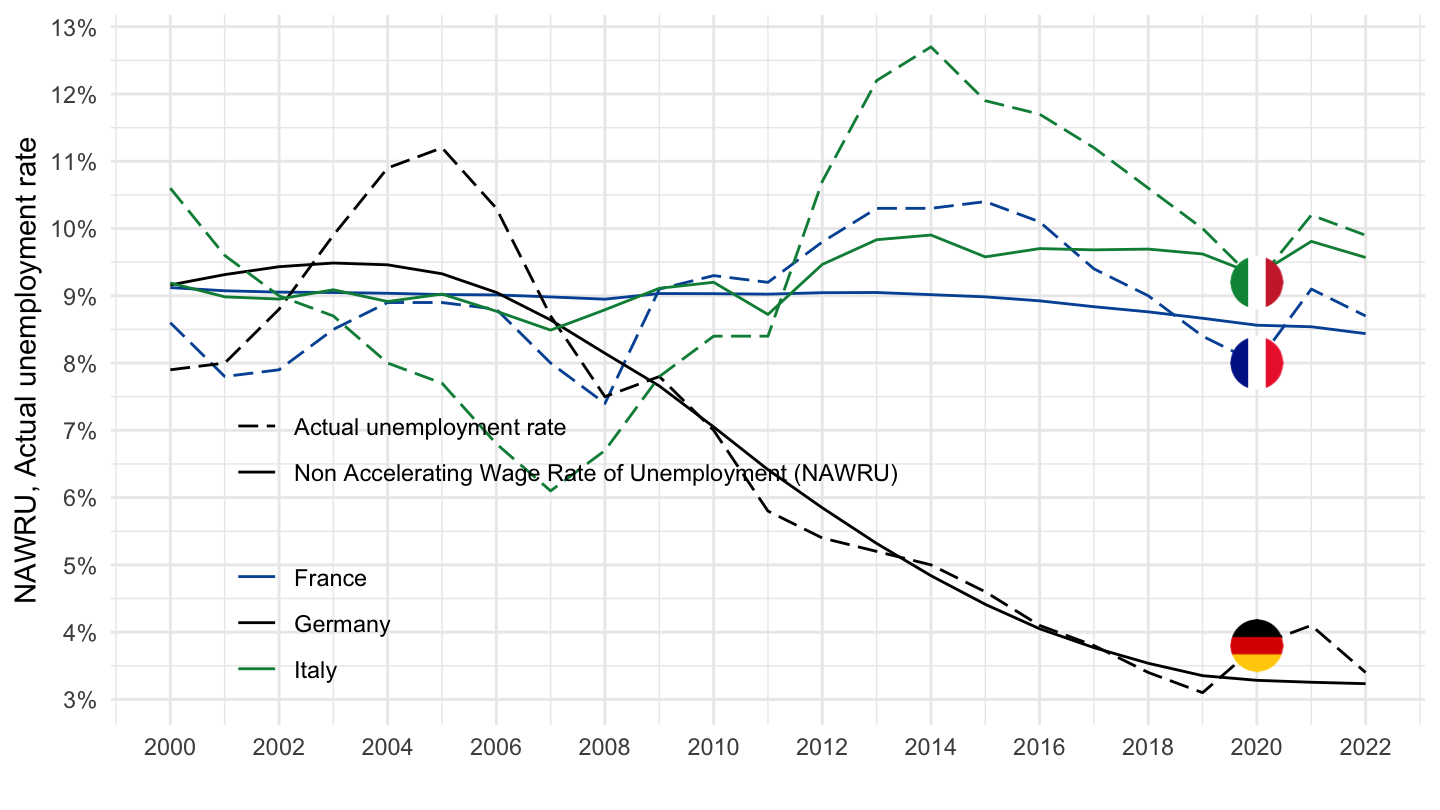
mutate(variable = "Non Accelerating Wage Rate of Unemployment (NAWRU)") %>%
bind_rows(ZUTN %>%
mutate(variable = "Actual unemployment rate")) %>%
filter(COU %in% c("FRA", "DEU", "ITA"),
vintage == 2021,
date >= as.Date("2000-01-01")) %>%
left_join(COU, by = "COU") %>%
left_join(colors, by = c("COUNTRY" = "country")) %>%
na.omit %>%
ggplot() + theme_minimal() + ylab("NAWRU, Actual unemployment rate") + xlab("") +
geom_line(aes(x = date, y = value/100, color = COUNTRY, linetype = variable)) +
scale_color_manual(values = viridis(5)[1:4]) +
scale_x_date(breaks = seq(1920, 2025, 2) %>% paste0("-01-01") %>% as.Date,
labels = date_format("%Y")) +
scale_color_manual(values = c("#0055a4", "#000000", "#008c45")) +
scale_linetype_manual(values = c("longdash", "solid")) +
geom_image(data = . %>%
filter(date == as.Date("2020-01-01"),
variable == "Actual unemployment rate") %>%
mutate(image = paste0("../../icon/flag/round/", str_to_lower(gsub(" ", "-", COUNTRY)), ".png")),
aes(x = date, y = value/100, image = image), asp = 1.5) +
theme(legend.position = c(0.35, 0.25),
legend.title = element_blank()) +
scale_y_continuous(breaks = 0.01*seq(-60, 60, 1),
labels = scales::percent_format(accuracy = 1))