| LAST_DOWNLOAD |
|---|
| 2023-10-05 |
Gap between actual and potential gross domestic product at 2015 reference levels - AVGDGP
Data - AMECO
Info
LAST_DOWNLOAD
LAST_COMPILE
| LAST_COMPILE |
|---|
| 2025-08-24 |
Last
| date | Nobs |
|---|---|
| 2022-01-01 | 33 |
geo, Country
Code
AVGDGP %>%
  left_join(COU, by = "COU") %>%
  group_by(COUNTRY) %>%
  summarise(Nobs = n()) %>%
  mutate(Flag = gsub(" ", "-", str_to_lower(COUNTRY)),
         Flag = paste0('<img src="../../icon/flag/vsmall/', Flag, '.png" alt="Flag">')) %>%
  select(Flag, everything()) %>%
  {if (is_html_output()) datatable(., filter = 'top', rownames = F, escape = F) else .}
vintage
Code
AVGDGP %>%
  group_by(vintage) %>%
  summarise(Nobs = n()) %>%
  arrange(desc(vintage)) %>%
print_table_conditional()| vintage | Nobs |
|---|---|
| 2021 | 1396 |
| 2020 | 1364 |
| 2019 | 1366 |
| 2018 | 1327 |
| 2017 | 1275 |
| 2016 | 1242 |
| 2015 | 1209 |
| 2014 | 1127 |
| 2013 | 1060 |
| 2012 | 1026 |
| 2011 | 996 |
date
Code
AVGDGP %>%
  group_by(date) %>%
  summarise(Nobs = n()) %>%
  arrange(desc(date)) %>%
  print_table_conditional()
France, Spain, Italy, Spain
All
Code
AVGDGP %>%
  filter(COU %in% c("FRA", "DEU", "ITA", "ESP"),
         vintage == 2021) %>%
  left_join(COU, by = "COU") %>%
  na.omit %>%
  mutate(value = value / 100) %>%
  ggplot() + theme_minimal() + ylab("Output Gap (% of GDP)") + xlab("") +
  geom_line(aes(x = date, y = value, color = COUNTRY)) + add_4flags +
  scale_color_manual(values = c("#002395", "#000000", "#009246", "#C60B1E")) +
  scale_x_date(breaks = seq(1920, 2025, 5) %>% paste0("-01-01") %>% as.Date,
               labels = date_format("%y")) +
  theme(legend.position = c(0.2, 0.2),
        legend.title = element_blank()) +
  scale_y_continuous(breaks = 0.01*seq(-60, 60, 1),
                     labels = scales::percent_format(accuracy = 1))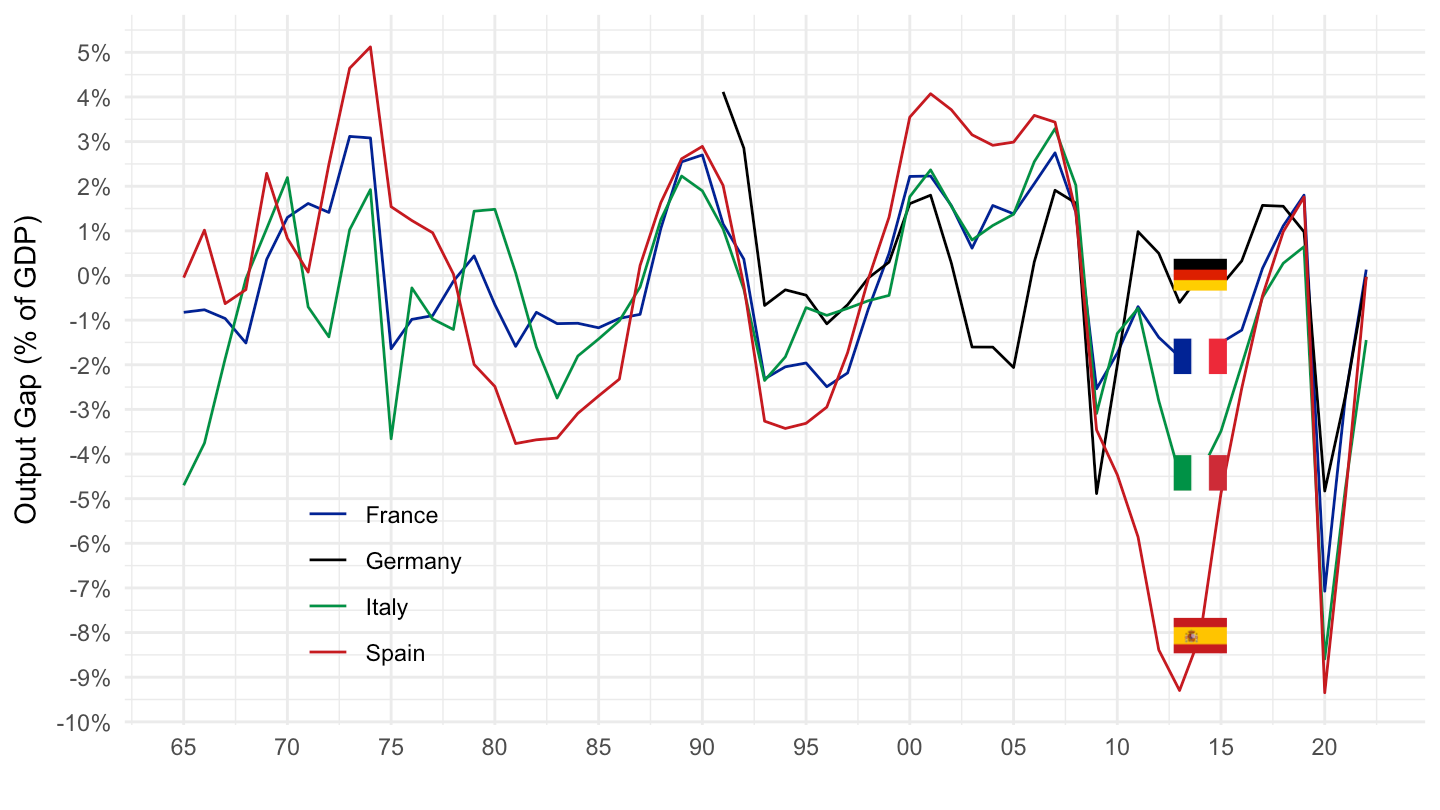
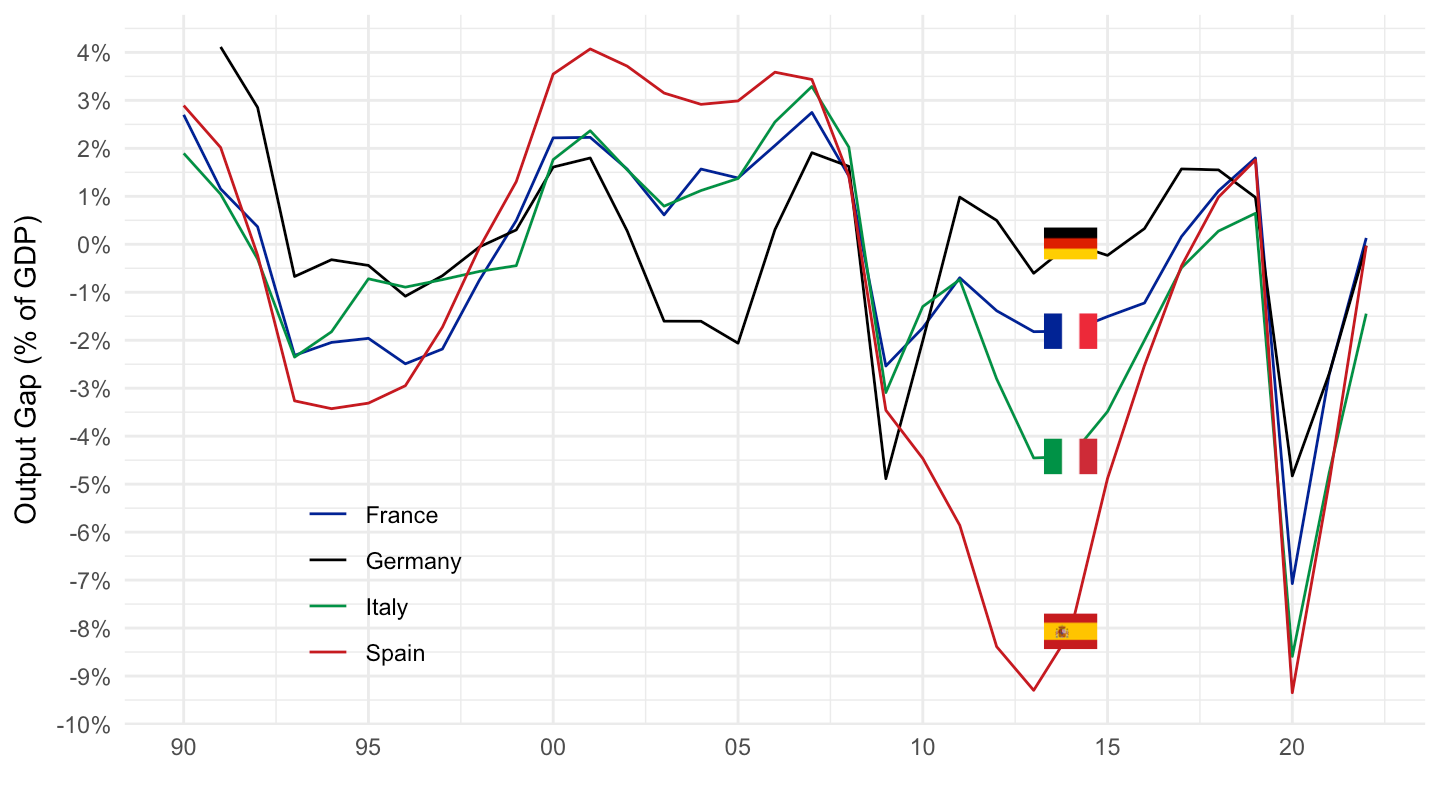
1990-
Code
AVGDGP %>%
  filter(COU %in% c("FRA", "DEU", "ITA", "ESP"),
         vintage == 2021) %>%
  left_join(COU, by = "COU") %>%
  filter(date >= as.Date("1990-01-01")) %>%
  na.omit %>%
  mutate(value = value / 100) %>%
  ggplot() + theme_minimal() + ylab("Output Gap (% of GDP)") + xlab("") +
  geom_line(aes(x = date, y = value, color = COUNTRY)) + add_4flags +
  scale_color_manual(values = c("#002395", "#000000", "#009246", "#C60B1E")) +
  scale_x_date(breaks = seq(1920, 2025, 5) %>% paste0("-01-01") %>% as.Date,
               labels = date_format("%y")) +
  theme(legend.position = c(0.2, 0.2),
        legend.title = element_blank()) +
  scale_y_continuous(breaks = 0.01*seq(-60, 60, 1),
                     labels = scales::percent_format(accuracy = 1))