
Last observation: Q2 2027 (N = 4) · juin 2027 (N = 4) · 2026 (N = 4)
First observation: 2013 (N = 4) · janv. 2013 (N = 4) · Q1 2013 (N = 4)
Last data update: 26 oct. 2026, 00:06
Last compile: 26 oct. 2026, 02:52
freq_dominant <- EWT |>
  filter(!is.na(OBS_VALUE)) |>
  count(FREQ, sort = TRUE) |>
  slice(1) |>
  pull(FREQ)

convert_fn <- switch(freq_dominant,
  "A" = year_to_date, "Q" = quarter_to_date, "M" = month_to_date,
  "H" = semester_to_date, "W" = week_to_date, "D" = day_to_date, "B" = day_to_date,
  year_to_date)

EWT |>
  filter(!is.na(OBS_VALUE), FREQ == freq_dominant) |>
  group_by(TIME_PERIOD) |>
  summarise(OBS_VALUE = mean(OBS_VALUE, na.rm = TRUE), .groups = "drop") |>
  convert_fn() |>
  ggplot() + theme_minimal() + xlab("") + ylab("Average value across all series") +
  geom_line(aes(x = date, y = OBS_VALUE)) +
  scale_x_date(date_labels = "%Y")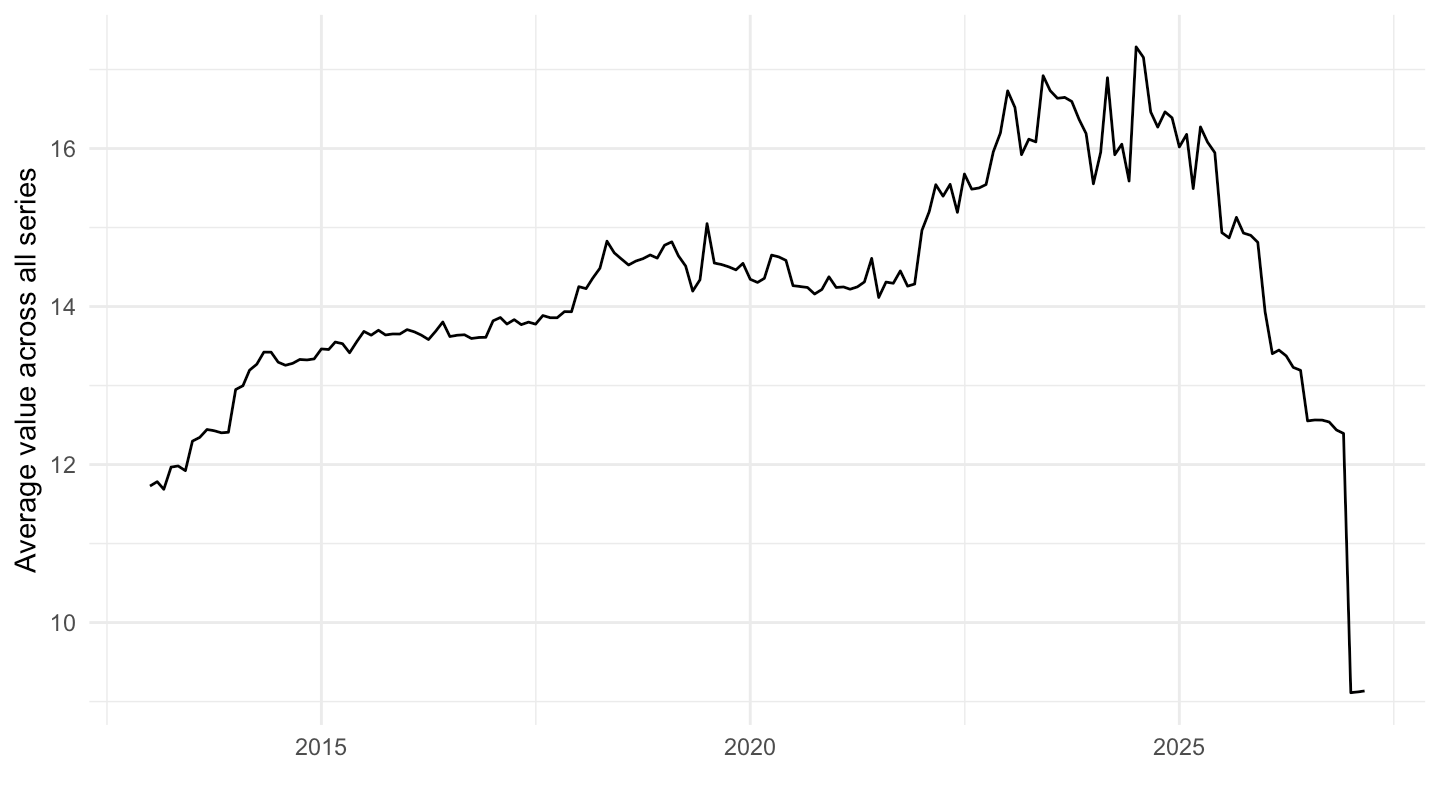
EWT |>
  filter(REF_AREA == "U2", FREQ == "Q", ACTIVITY == "_T",
         TRANSFORMATION == "GY",
         EWT_CONCEPT %in% c("INWR", "INWX"), !is.na(OBS_VALUE)) |>
  quarter_to_date() |>
  mutate(series = recode(EWT_CONCEPT,
                         "INWR" = "Including one-off payments",
                         "INWX" = "Excluding one-off payments")) |>
  ggplot() + theme_minimal() + xlab("") +
  ylab("ECB wage tracker (% year-on-year)") +
  geom_hline(yintercept = 3, linetype = "dashed") +
  geom_line(aes(x = date, y = OBS_VALUE, color = series)) +
  scale_color_manual(values = c("Including one-off payments" = "#003399",
                                "Excluding one-off payments" = "#b22234")) +
  scale_x_date(breaks = as.Date(paste0(seq(2000, 2100, 2), "-01-01")),
               labels = date_format("%Y")) +
  theme(legend.position = c(0.3, 0.9), legend.title = element_blank()) +
  scale_y_continuous(breaks = seq(0, 12, 1), labels = function(x) paste0(x, "%"))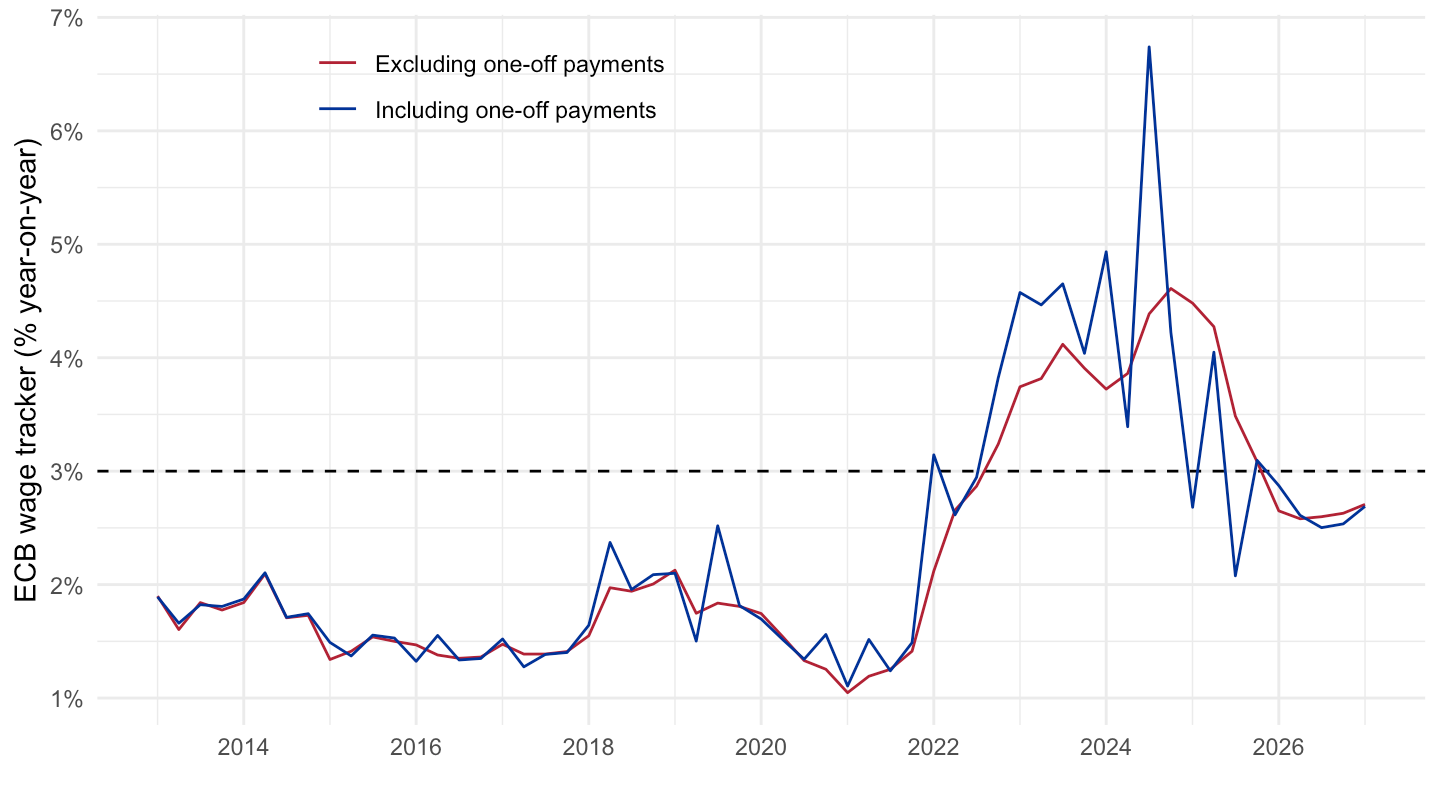
| source | dataset | Title | Updated |
|---|---|---|---|


