[1] "date"
[2] "taux_employeur_explicite.ati"
[3] "taux_employeur_explicite.pensions_civils"
[4] "taux_employeur_explicite.pensions_militaires"
[5] "taux_implicite" Contribution employeur à la charge de l’Etat
Data - IPP
Info
| source | dataset | Title | .html | .rData |
|---|---|---|---|---|
| ipp | revalorisation_pension | Revalorisation du Régime général de la caisse nationale d'assurance vieillesse (CNAV) | 2026-01-30 | 2026-01-30 |
| ipp | ret_etat | Contribution employeur à la charge de l'Etat | 2026-01-30 | 2026-01-30 |
| insee | IPC-2015 | Indice des prix à la consommation - Base 2015 | 2026-01-31 | 2026-01-31 |
Données sur le pouvoir d’achat
| source | dataset | Title | .html | .rData |
|---|---|---|---|---|
| insee | CNA-2014-RDB | Revenu et pouvoir d’achat des ménages | 2026-01-31 | 2026-01-30 |
| insee | CNT-2014-CSI | Comptes de secteurs institutionnels | 2026-01-31 | 2026-01-30 |
| insee | T_2101 | 2.101 – Revenu disponible brut des ménages et évolution du pouvoir d'achat par personne, par ménage et par unité de consommation (En milliards euros et %) | 2026-01-31 | 2025-12-14 |
| insee | T_7401 | 7.401 – Compte des ménages (S14) (En milliards d'euros) | 2026-01-31 | 2025-12-14 |
| insee | conso-eff-fonction | Consommation effective des ménages par fonction | 2026-01-31 | 2022-06-14 |
| insee | econ-gen-revenu-dispo-pouv-achat-2 | Revenu disponible brut et pouvoir d’achat - Données annuelles | 2026-01-31 | 2026-01-11 |
| insee | reve-conso-evo-dep-pa | Évolution de la dépense et du pouvoir d’achat des ménages - Données annuelles de 1960 à 2023 | 2026-01-31 | 2024-12-11 |
| insee | reve-niv-vie-individu-activite | Niveau de vie selon l'activité - Données annuelles | 2026-01-31 | 2025-12-22 |
| insee | reve-niv-vie-pouv-achat-trim | Évolution du revenu disponible brut et du pouvoir d’achat - Données trimestrielles | 2026-01-31 | 2026-01-11 |
| insee | t_men_val | Revenu, pouvoir d'achat et comptes des ménages - Valeurs aux prix courants | 2026-01-31 | 2026-01-10 |
| insee | t_pouvachat_val | Pouvoir d'achat et ratios des comptes des ménages | 2026-01-31 | 2026-01-10 |
| insee | t_recapAgent_val | Récapitulatif des séries des comptes d'agents | 2026-01-31 | 2026-01-10 |
| insee | t_salaire_val | Salaire moyen par tête - SMPT (données CVS) | 2026-01-31 | 2026-01-10 |
| oecd | HH_DASH | Household Dashboard | 2026-01-16 | 2023-09-09 |
Juridique
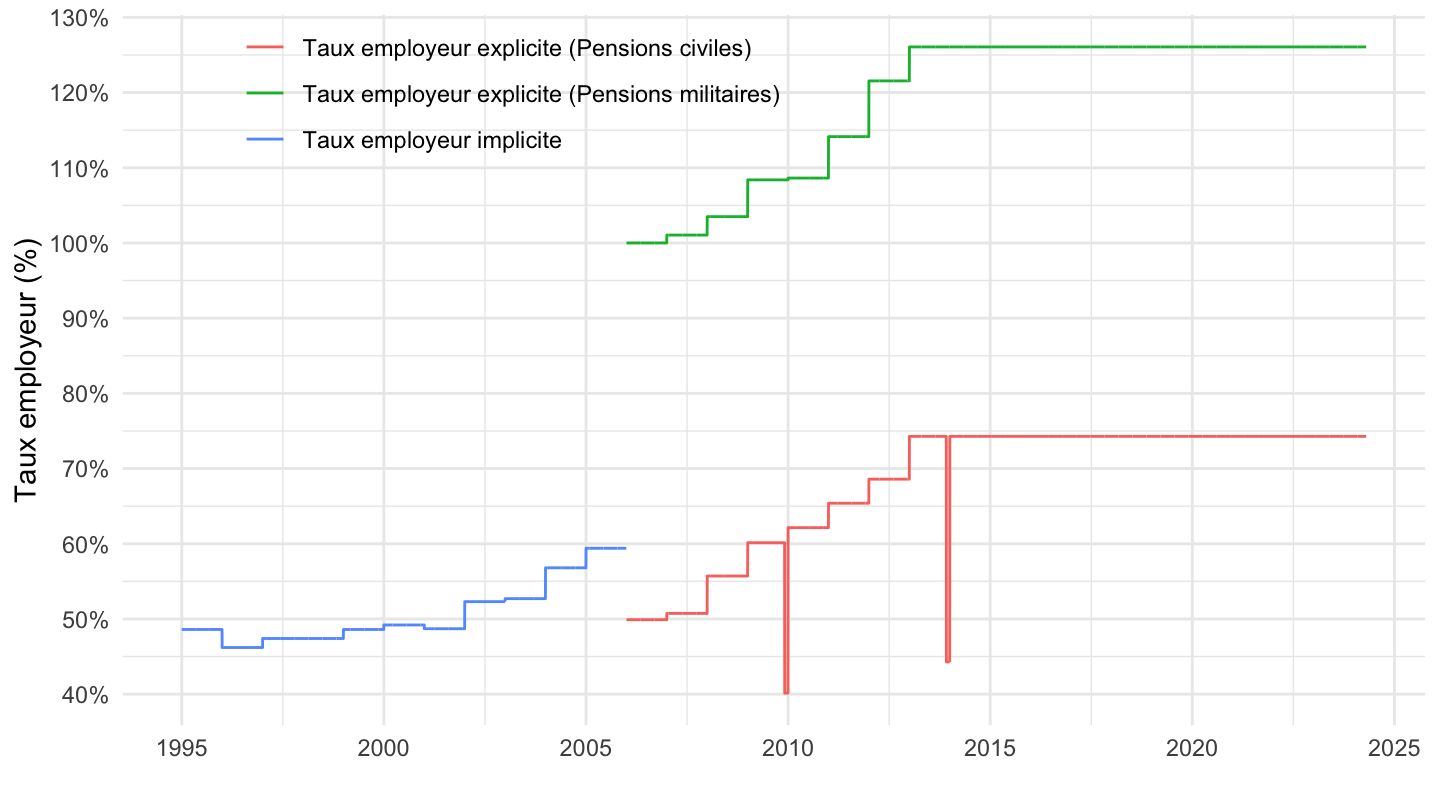
- Le taux de la contribution employeur à la charge de l’Etat prévue au 1° de l’article L. 61 du code des pensions civiles et militaires de retraite est fixé à 74,28 % pour les personnels civils et à 126,07 % pour les personnels militaires.
Retenues Etat
All
Code
ret_etat %>%
  select(-taux_employeur_explicite.ati) %>%
  gather(variable, value, -date) %>%
  group_by(variable) %>%
  complete(date = seq.Date(min(date), max(date), by = "day")) %>%
  fill(value) %>%
  mutate(value = ifelse(date >= as.Date("2006-01-01") & variable == "taux_implicite", NA, value)) %>%
  left_join(variable, by = "variable") %>%
  ggplot() + geom_line(aes(x = date, y = value, color = Variable)) +
  theme_minimal() +
  scale_x_date(breaks = seq(1920, 2100, 2) %>% paste0("-01-01") %>% as.Date,
               labels = date_format("%Y")) +
  theme(legend.position = c(0.3, 0.9),
        legend.title = element_blank()) +
  scale_y_continuous(breaks = 0.01*seq(0, 200, 10),
                     labels = percent_format()) +
  ylab("Taux employeur (%)") + xlab("")