Salaires annuels
Data - INSEE
Info
Données sur les salaires
| source | dataset | Title | .html | .rData |
|---|---|---|---|---|
| insee | SALAIRES-ANNUELS | Salaires annuels | 2026-02-16 | 2026-02-16 |
| dares | les-indices-de-salaire-de-base | Les indices de salaire de base | 2025-12-15 | 2025-12-15 |
| insee | CNA-2014-RDB | Revenu et pouvoir d’achat des ménages | 2026-02-16 | 2026-02-15 |
| insee | CNT-2014-CSI | Comptes de secteurs institutionnels | 2026-02-16 | 2026-02-15 |
| insee | ECRT2023 | Emploi, chômage, revenus du travail - Edition 2023 | 2026-02-16 | 2023-06-30 |
| insee | INDICE-TRAITEMENT-FP | Indice de traitement brut dans la fonction publique de l'État | 2026-02-16 | 2026-02-15 |
| insee | SALAIRES-ACEMO | Indices trimestriels de salaires dans le secteur privé - Résultats par secteur d’activité | 2026-02-16 | 2026-02-16 |
| insee | SALAIRES-ACEMO-2017 | Indices trimestriels de salaires dans le secteur privé | 2026-02-16 | 2026-02-16 |
| insee | T_2101 | 2.101 – Revenu disponible brut des ménages et évolution du pouvoir d'achat par personne, par ménage et par unité de consommation (En milliards euros et %) | 2026-02-16 | 2025-12-14 |
| insee | T_7401 | 7.401 – Compte des ménages (S14) (En milliards d'euros) | 2026-02-16 | 2025-12-14 |
| insee | if230 | Séries longues sur les salaires dans le secteur privé | 2026-02-16 | 2021-12-04 |
| insee | ir_salaires_SL_23_csv | NA | NA | NA |
| insee | ir_salaires_SL_csv | NA | NA | NA |
| insee | t_salaire_val | Salaire moyen par tête - SMPT (données CVS) | 2026-02-16 | 2026-01-10 |
LAST_UPDATE
Code
`SALAIRES-ANNUELS` %>%
  group_by(LAST_UPDATE) %>%
  summarise(Nobs = n()) %>%
  arrange(desc(LAST_UPDATE)) %>%
print_table_conditional()| LAST_UPDATE | Nobs |
|---|---|
| 2026-01-22 | 67 |
| 2025-12-18 | 4863 |
| 2017-11-07 | 3981 |
| 2013-06-24 | 555 |
LAST_COMPILE
| LAST_COMPILE |
|---|
| 2026-02-21 |
Last
Head
Code
`SALAIRES-ANNUELS` %>%
  group_by(TIME_PERIOD) %>%
  summarise(Nobs = n()) %>%
  arrange(desc(TIME_PERIOD)) %>%
  head(3) %>%
print_table_conditional()| TIME_PERIOD | Nobs |
|---|---|
| 2025 | 3 |
| 2024 | 116 |
| 2023 | 116 |
Last
Code
`SALAIRES-ANNUELS` %>%
  filter(TIME_PERIOD == max(TIME_PERIOD)) %>%
  head(200) %>%
  select(TITLE_FR, TIME_PERIOD, OBS_VALUE) %>%
print_table_conditional| TITLE_FR | TIME_PERIOD | OBS_VALUE |
|---|---|---|
| SMIC brut mensuel (pour 151,67 heures par mois) - En moyenne annuelle | 2025 | 1801.80 |
| SMIC net de CSG et CRDS mensuel (pour 151,67 heures par mois) - En moyenne annuelle | 2025 | 1426.30 |
| SMIC brut (en euros par heure) - En moyenne annuelle | 2025 | 11.88 |
First
Code
`SALAIRES-ANNUELS` %>%
  group_by(TIME_PERIOD) %>%
  summarise(Nobs = n()) %>%
  arrange(desc(TIME_PERIOD)) %>%
  tail(1) %>%
print_table_conditional()| TIME_PERIOD | Nobs |
|---|---|
| 1950 | 50 |
TITLE_FR
Tous
Code
`SALAIRES-ANNUELS` %>%
  group_by(IDBANK, TITLE_FR) %>%
  summarise(Nobs = n(),
            date1 = first(TIME_PERIOD),
            date2 = last(TIME_PERIOD)) %>%
  arrange(-Nobs) %>%
  print_table_conditional()
Ensemble
Code
`SALAIRES-ANNUELS` %>%
  filter(SEXE == "0") %>%
  group_by(IDBANK, TITLE_FR) %>%
  summarise(Nobs = n(),
            date1 = first(TIME_PERIOD),
            date2 = last(TIME_PERIOD)) %>%
  arrange(-Nobs) %>%
  print_table_conditional()
SEXE
Code
`SALAIRES-ANNUELS` %>%
  left_join(SEXE, by = "SEXE") %>%
  group_by(SEXE, Sexe) %>%
  summarise(Nobs = n()) %>%
  arrange(-Nobs) %>%
print_table_conditional()| SEXE | Sexe | Nobs |
|---|---|---|
| 0 | Ensemble | 3454 |
| 1 | Hommes | 3021 |
| 2 | Femmes | 2991 |
BASIND
Code
`SALAIRES-ANNUELS` %>%
  left_join(BASIND, by = "BASIND") %>%
  group_by(BASIND, Basind) %>%
  summarise(Nobs = n()) %>%
  arrange(-Nobs) %>%
print_table_conditional()| BASIND | Basind | Nobs |
|---|---|---|
| SO | Sans objet | 8683 |
| 1951 | 1951 | 417 |
| 2000 | 2000 | 366 |
VALORISATION
Code
`SALAIRES-ANNUELS` %>%
  left_join(VALORISATION, by = "VALORISATION") %>%
  group_by(VALORISATION, Valorisation) %>%
  summarise(Nobs = n()) %>%
  arrange(-Nobs) %>%
print_table_conditional()| VALORISATION | Valorisation | Nobs |
|---|---|---|
| SO | Sans objet | 9100 |
| EUROS_CONST | Euros constants | 191 |
| EUROS_COUR | Euros courants | 175 |
SERIES_ARRETEE
Code
`SALAIRES-ANNUELS` %>%
  left_join(SERIE_ARRETEE, by = "SERIE_ARRETEE") %>%
  group_by(SERIE_ARRETEE, Serie_arretee) %>%
  summarise(Nobs = n()) %>%
  arrange(-Nobs) %>%
print_table_conditional()| SERIE_ARRETEE | Serie_arretee | Nobs |
|---|---|---|
| FALSE | non | 4930 |
| TRUE | oui | 4536 |
METIER
Code
`SALAIRES-ANNUELS` %>%
  left_join(METIER, by = "METIER") %>%
  group_by(METIER, Metier) %>%
  summarise(Nobs = n()) %>%
  arrange(-Nobs) %>%
print_table_conditional()| METIER | Metier | Nobs |
|---|---|---|
| SO | Sans objet | 7117 |
| 5 | Employés | 468 |
| 6 | Ouvriers | 468 |
| 4 | Professions intermédiaires | 369 |
| CCE | Cadres, y compris les chefs d'entreprise salariés | 210 |
| 3 | Cadres et professions intellectuelles supérieures | 159 |
| AS | Apprentis et stagiaires | 159 |
| CE | Chefs d'entreprise | 159 |
| MOY | Cadres moyens | 99 |
| SUP | Cadres supérieurs | 99 |
| PSA | Personnel de service | 96 |
| CONT | Contremaîtres | 63 |
INDICATEUR
Code
`SALAIRES-ANNUELS` %>%
  left_join(INDICATEUR, by = "INDICATEUR") %>%
  group_by(INDICATEUR, Indicateur) %>%
  summarise(Nobs = n()) %>%
  arrange(-Nobs) %>%
print_table_conditional()| INDICATEUR | Indicateur | Nobs |
|---|---|---|
| SAL_ANN_MOY | Salaire net annuel moyen | 2922 |
| SAL_ANN_D5 | Médiane (D5) du salaire net annuel | 573 |
| SAL_ANN_D9 | Neuvième décile (D9) du salaire net annuel | 573 |
| SAL_ANN_D9-D5 | Rapport interdécile D9/D5 du salaire net annuel | 573 |
| SAL_ANN_D1 | Premier décile (D1) du salaire net annuel | 563 |
| SAL_ANN_D5-D1 | Rapport interdécile D5/D1 du salaire net annuel | 563 |
| SAL_ANN_D9-D1 | Rapport interdécile D9/D1 du salaire net annuel | 563 |
| SAL_ANN_PVRACH-EVO | Évolution du pouvoir d'achat du salaire net annuel moyen | 417 |
| SAL_ANN_PVRACH-IND | Indice du pouvoir d'achat du salaire net annuel moyen | 417 |
| SAL_ANN_Q1 | Premier quartile (Q1) du salaire net annuel | 417 |
| SAL_ANN_Q3 | Troisième quartile (Q3) du salaire net annuel | 417 |
| SAL_ANN_SNAM-EVO | Évolution du salaire net annuel moyen | 417 |
| SAL_ANN_C95 | Quatre-vingt-quinzième centile (C95) du salaire net annuel | 309 |
| SAL_ANN_C99 | Quatre-vingt-dix-neuvième centile (C99) du salaire net annuel | 309 |
| SAL_ANN_SNMMTC | Indice du salaire net mensuel moyen d'un temps complet | 66 |
| SAL_ANN_PLAFSSB | Indice du plafond de la Sécurité sociale (sur les salaires bruts) | 50 |
| SAL_ANN_PLAFSSN | Indice du plafond de la Sécurité sociale (sur les salaires nets) | 50 |
| SAL_ANN_SHBO | Indice du salaire horaire brut de base des ouvriers (SHBO) | 50 |
| SAL_ANN_SMICBH | Indice du SMIC brut horaire | 50 |
| SAL_ANN_SMICBM | Indice du SMIC brut mensuel | 50 |
| SAL_ANN_SMICNM | Indice du SMIC net mensuel | 50 |
| SAL_ANN_SMICH | Montant horaire brut du SMIC | 25 |
| SAL_ANN_SMICMB-35H | Montant mensuel brut du SMIC | 21 |
| SAL_ANN_SMICMNN-35H | Montant mensuel net du SMIC | 21 |
NATURE
Code
`SALAIRES-ANNUELS` %>%
  left_join(NATURE, by = "NATURE") %>%
  group_by(NATURE, Nature) %>%
  summarise(Nobs = n()) %>%
  arrange(-Nobs) %>%
print_table_conditional()| NATURE | Nature | Nobs |
|---|---|---|
| VALEUR_ABSOLUE | Valeur absolue | 6150 |
| RATIO | Ratio | 1699 |
| TAUX | Taux | 834 |
| INDICE | Indice | 783 |
QUOTITE-TRAV
Code
`SALAIRES-ANNUELS` %>%
  left_join(`QUOTITE-TRAV`, by = "QUOTITE-TRAV") %>%
  group_by(`QUOTITE-TRAV`, `Quotite-Trav`) %>%
  summarise(Nobs = n()) %>%
  arrange(-Nobs) %>%
print_table_conditional()| QUOTITE-TRAV | Quotite-Trav | Nobs |
|---|---|---|
| TC | Temps complet | 3490 |
| TCP | Temps complet dans le secteur privé | 3233 |
| ETPP | Équivalent temps plein dans le secteur privé | 1305 |
| ETP | Équivalent temps plein | 1071 |
| SO | Sans objet | 367 |
TIME_PERIOD
Code
`SALAIRES-ANNUELS` %>%
  group_by(TIME_PERIOD) %>%
  summarise(Nobs = n()) %>%
  arrange(desc(TIME_PERIOD)) %>%
  print_table_conditional()
EQTP vs Temps complet
Séries
Code
`SALAIRES-ANNUELS` %>%
  filter(IDBANK %in% c("010752366", "010752333")) %>%
  left_join(`QUOTITE-TRAV`, by = "QUOTITE-TRAV") %>%
  year_to_date %>%
  arrange(date) %>%
  filter(date >= as.Date("1996-01-01")) %>%
  group_by(`Quotite-Trav`) %>%
  mutate(OBS_VALUE = 100*OBS_VALUE/OBS_VALUE[date == as.Date("1996-01-01")]) %>%
  ggplot(.) + theme_minimal() + ylab("") + xlab("") +
  geom_line(aes(x = date, y = OBS_VALUE, color = `Quotite-Trav`)) +
  theme(legend.title = element_blank(),
        legend.position = c(0.3, 0.8)) +
  scale_x_date(breaks = seq(1950, 2100, 2) %>% paste0("-01-01") %>% as.Date,
               labels = date_format("%Y")) +
  scale_y_log10(breaks = seq(0, 200, 5))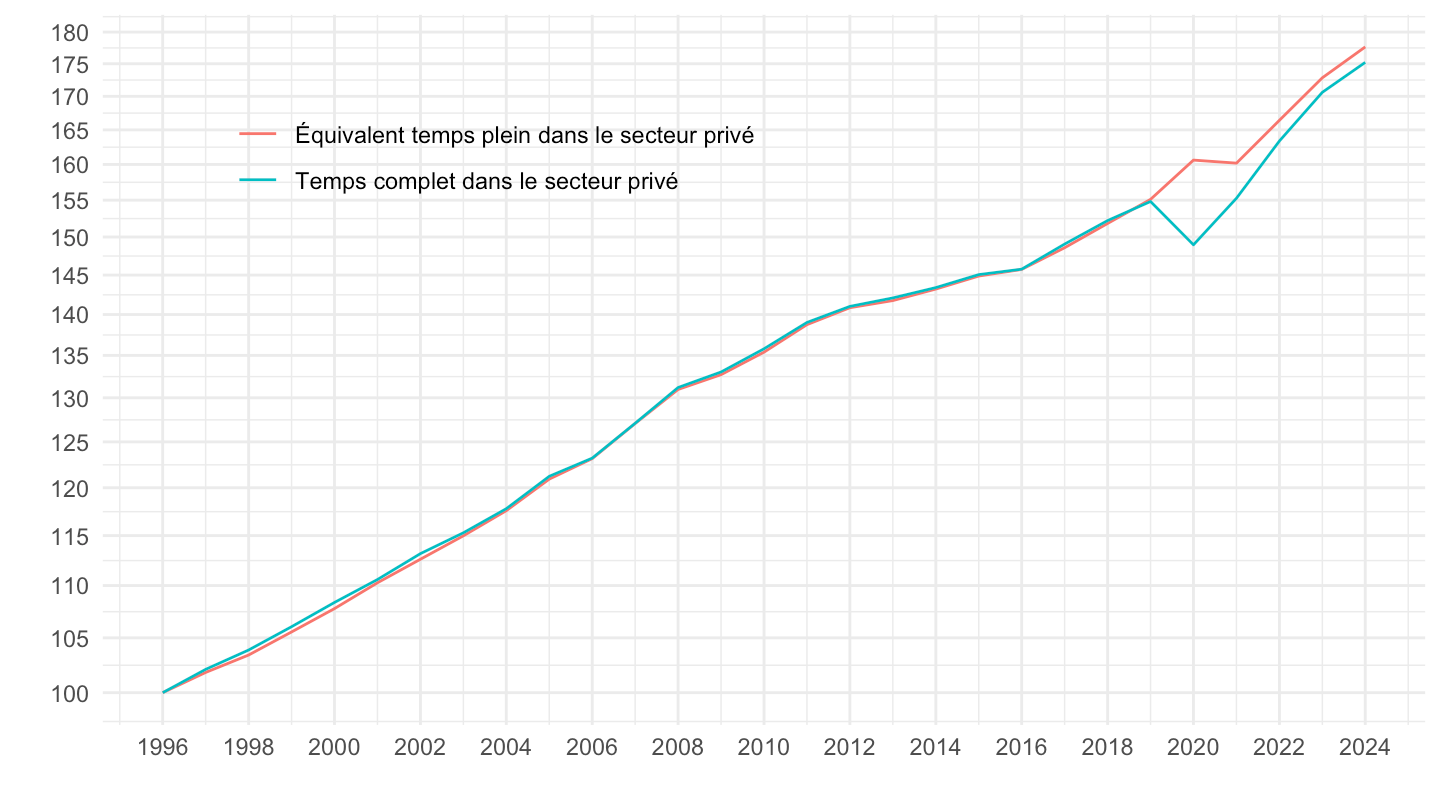
Catégories socioprofessionnelles, séries longues
Salaire net annuel moyen des postes à temps complet
1950-1982
Tous
Code
`SALAIRES-ANNUELS` %>%
  group_by(IDBANK, TITLE_FR) %>%
  filter(first(TIME_PERIOD) == "1982",
         SEXE == "0") %>%
  year_to_date %>%
  arrange(date) %>%
  left_join(METIER, by = "METIER") %>%
  ggplot + geom_line(aes(x = date, y = OBS_VALUE/1000, color = Metier))  +
  theme_minimal() + ylab("") + xlab("")+
  theme(legend.title = element_blank(),
        legend.position = c(0.2, 0.8)) +
  scale_x_date(breaks = seq(1950, 2100, 5) %>% paste0("-01-01") %>% as.Date,
               labels = date_format("%Y")) +
  scale_y_log10(breaks = seq(0, 200, 1),
                     labels = scales::dollar_format(accuracy = 1, suffix = " k€", prefix = ""))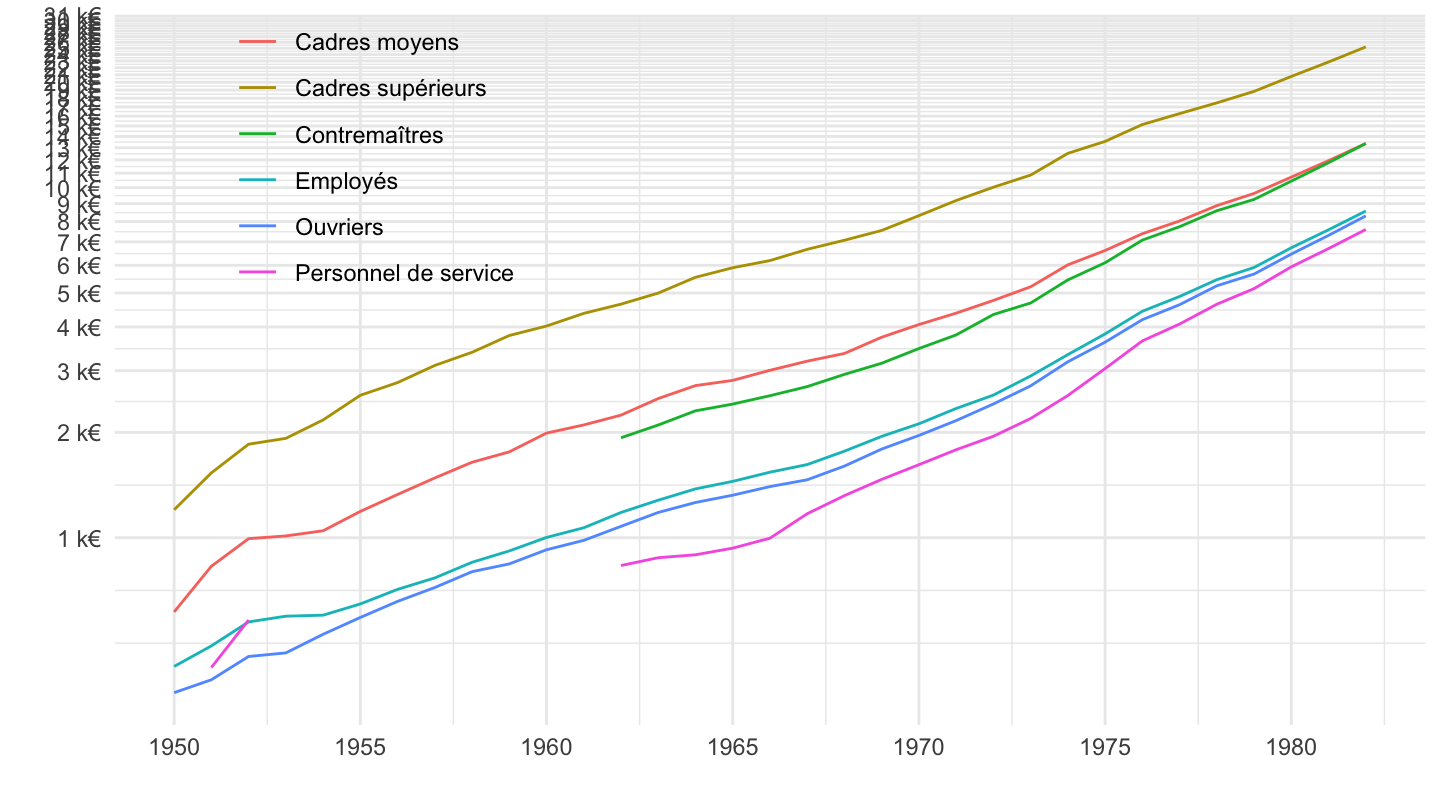
Quelques
Code
`SALAIRES-ANNUELS` %>%
  filter(IDBANK %in% c("001665183", "001665186", "001665189", "001665192")) %>%
  year_to_date %>%
  arrange(date) %>%
  left_join(METIER, by = "METIER") %>%
  ggplot + geom_line(aes(x = date, y = OBS_VALUE/1000, color = Metier))  +
  theme_minimal() + ylab("") + xlab("")+
  theme(legend.title = element_blank(),
        legend.position = c(0.2, 0.8)) +
  scale_x_date(breaks = seq(1950, 2100, 5) %>% paste0("-01-01") %>% as.Date,
               labels = date_format("%Y")) +
  scale_y_log10(breaks = seq(0, 200, 1),
                     labels = scales::dollar_format(accuracy = 1, suffix = " k€", prefix = ""))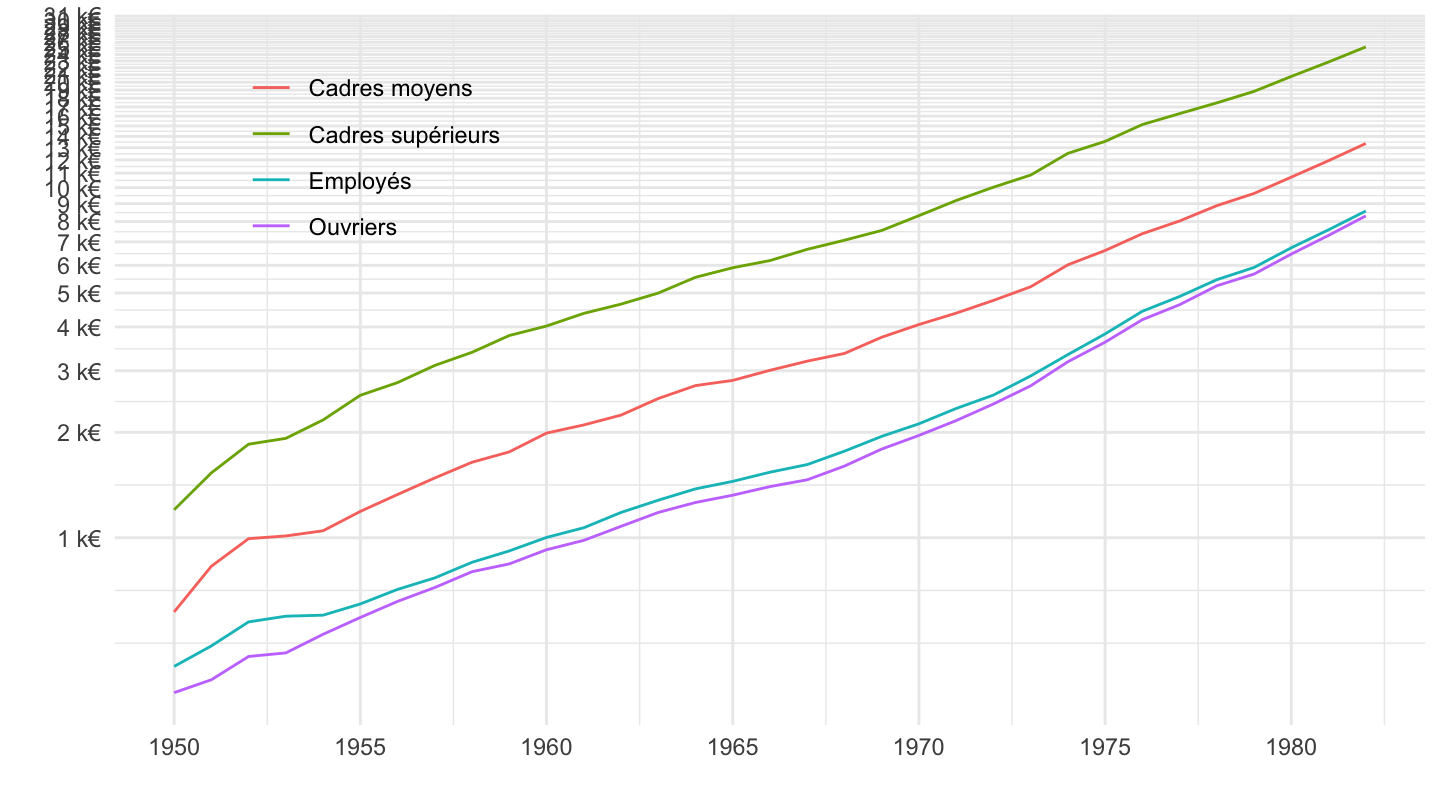
1983-
TC
Code
`SALAIRES-ANNUELS` %>%
  group_by(IDBANK, TITLE_FR) %>%
  filter(SEXE == "0",
         `QUOTITE-TRAV` == "TC",
         INDICATEUR == "SAL_ANN_MOY") %>%
  year_to_date %>%
  arrange(date) %>%
  left_join(METIER, by = "METIER") %>%
  ggplot + geom_line(aes(x = date, y = OBS_VALUE/1000, color = Metier))  +
  theme_minimal() + ylab("") + xlab("")+
  theme(legend.title = element_blank(),
        legend.position = c(0.3, 0.6)) +
  scale_x_date(breaks = seq(1950, 2100, 5) %>% paste0("-01-01") %>% as.Date,
               labels = date_format("%Y")) +
  scale_y_log10(breaks = seq(0, 200, 1),
                     labels = scales::dollar_format(accuracy = 1, suffix = " k€", prefix = ""))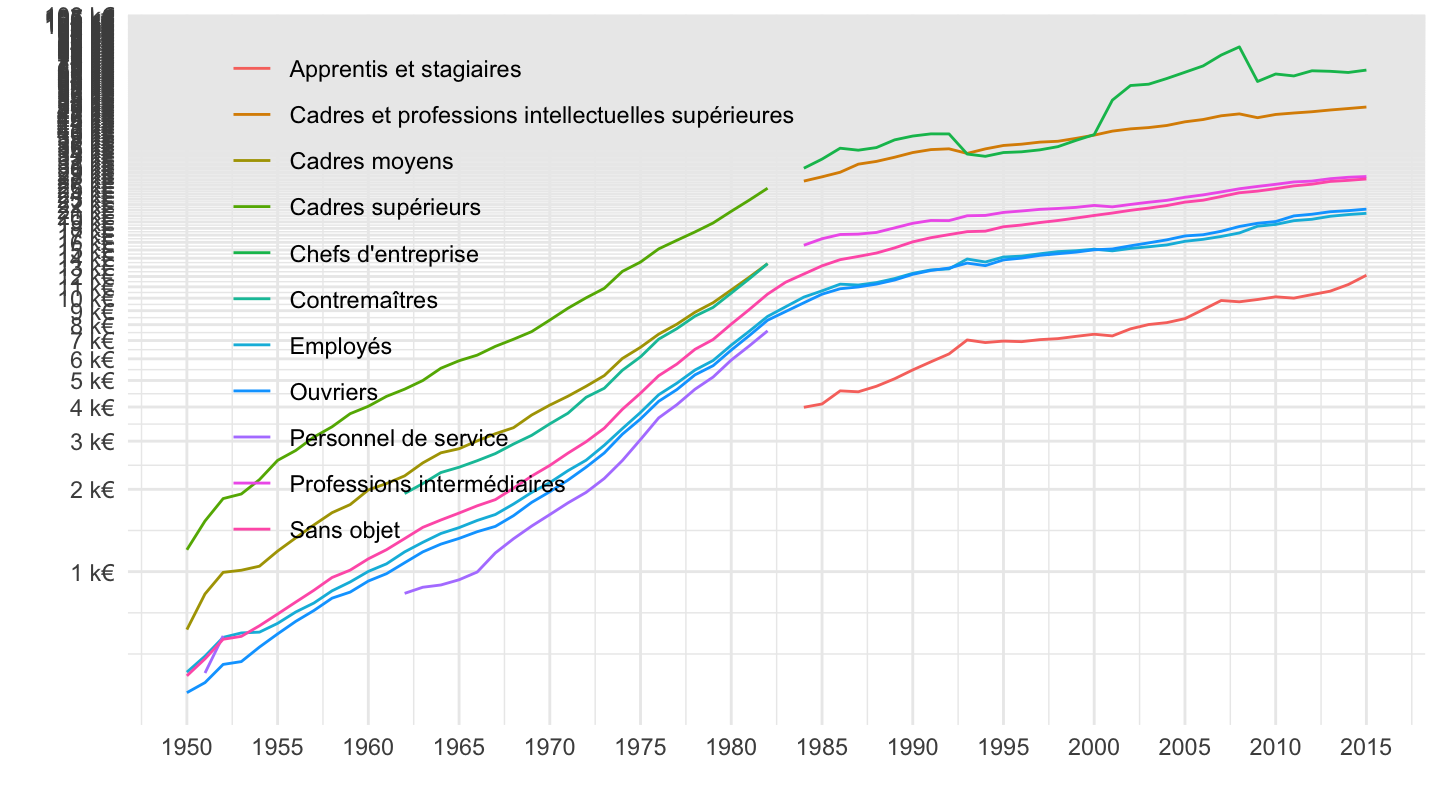
TCP
Code
`SALAIRES-ANNUELS` %>%
  group_by(IDBANK, TITLE_FR) %>%
  filter(SEXE == "0",
         `QUOTITE-TRAV` == "TCP",
         INDICATEUR == "SAL_ANN_MOY") %>%
  year_to_date %>%
  arrange(date) %>%
  left_join(METIER, by = "METIER") %>%
  arrange(desc(date)) %>%
  ggplot + geom_line(aes(x = date, y = OBS_VALUE/1000, color = Metier))  +
  theme_minimal() + ylab("") + xlab("")+
  theme(legend.title = element_blank(),
        legend.position = c(0.3, 0.6)) +
  scale_x_date(breaks = seq(1950, 2100, 5) %>% paste0("-01-01") %>% as.Date,
               labels = date_format("%Y")) +
  scale_y_log10(breaks = seq(0, 200, 1),
                     labels = scales::dollar_format(accuracy = 1, suffix = " k€", prefix = ""))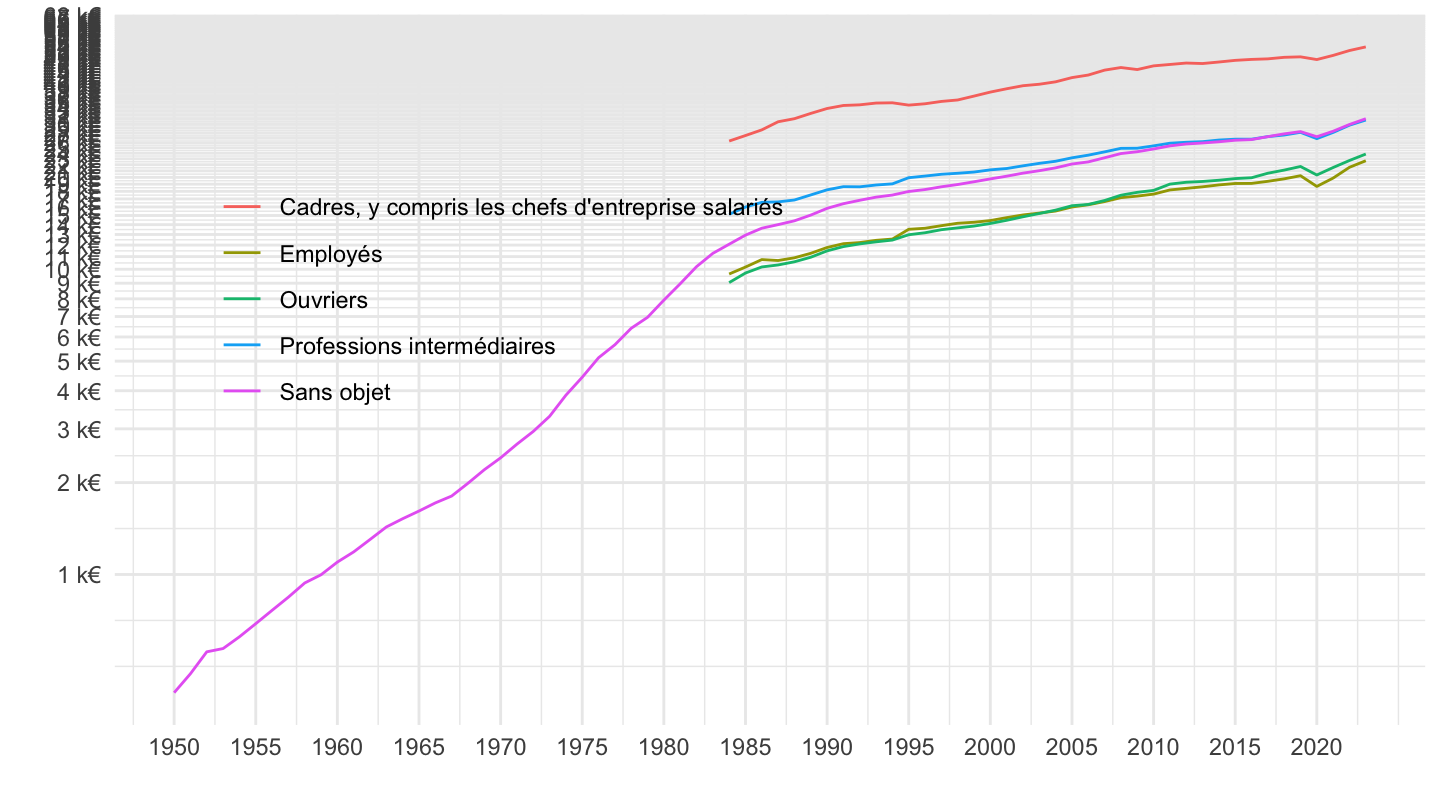
1996-
Value
Code
`SALAIRES-ANNUELS` %>%
  group_by(IDBANK, TITLE_FR) %>%
  filter(SEXE == "0",
         `QUOTITE-TRAV` == "TC",
         INDICATEUR == "SAL_ANN_MOY",
         METIER %in% c("CE", "3")) %>%
  year_to_date %>%
  arrange(desc(date)) %>%
  filter(date >= as.Date("1996-01-01")) %>%
  left_join(METIER, by = "METIER") %>%
  left_join(`QUOTITE-TRAV`, by = "QUOTITE-TRAV") %>%
  ggplot + geom_line(aes(x = date, y = OBS_VALUE/1000, color = paste(Metier, "-", `Quotite-Trav`)))  +
  theme_minimal() + ylab("") + xlab("")+
  theme(legend.title = element_blank(),
        legend.position = c(0.5, 0.9)) +
  scale_x_date(breaks = seq(1950, 2100, 2) %>% paste0("-01-01") %>% as.Date,
               labels = date_format("%Y")) +
  scale_y_log10(breaks = seq(0, 200, 5),
                     labels = scales::dollar_format(accuracy = 1, suffix = " k€", prefix = ""))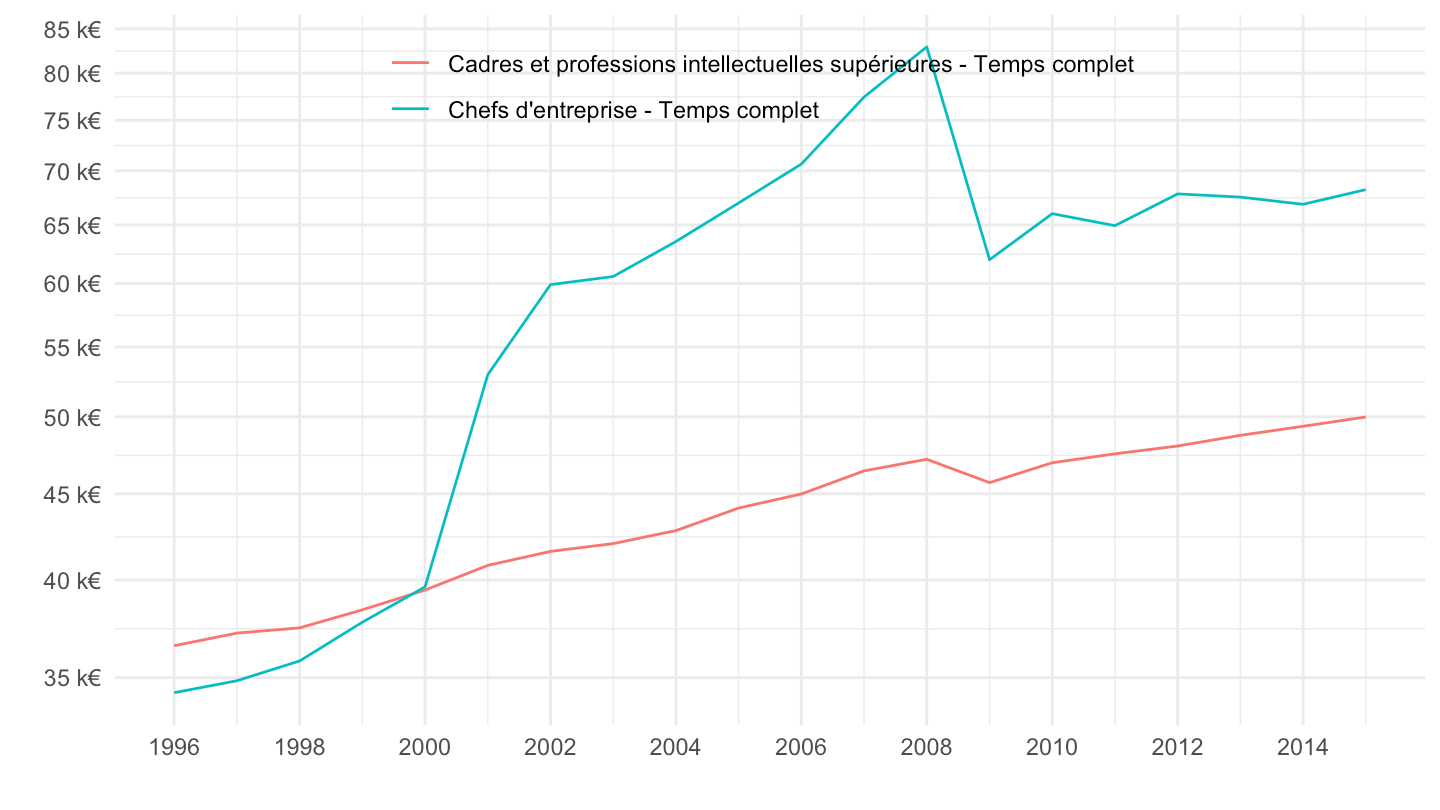
Index 100
Code
`SALAIRES-ANNUELS` %>%
  group_by(IDBANK, TITLE_FR) %>%
  filter(SEXE == "0",
         grepl(" temps complet", TITLE_FR),
         INDICATEUR == "SAL_ANN_MOY",
         METIER %in% c("CE", "3", "CCE")) %>%
  year_to_date %>%
  arrange(desc(date)) %>%
  filter(date >= as.Date("1996-01-01")) %>%
  left_join(METIER, by = "METIER") %>%
  left_join(`QUOTITE-TRAV`, by = "QUOTITE-TRAV") %>%
  group_by(METIER) %>%
  arrange(date) %>%
  mutate(OBS_VALUE = 100*OBS_VALUE/OBS_VALUE[1]) %>%
  ggplot + geom_line(aes(x = date, y = OBS_VALUE, color = paste(Metier, "-", `Quotite-Trav`)))  +
  theme_minimal() + ylab("") + xlab("")+
  theme(legend.title = element_blank(),
        legend.position = c(0.5, 0.9)) +
  scale_x_date(breaks = seq(1950, 2100, 2) %>% paste0("-01-01") %>% as.Date,
               labels = date_format("%Y")) +
  scale_y_log10(breaks = seq(0, 500, 10))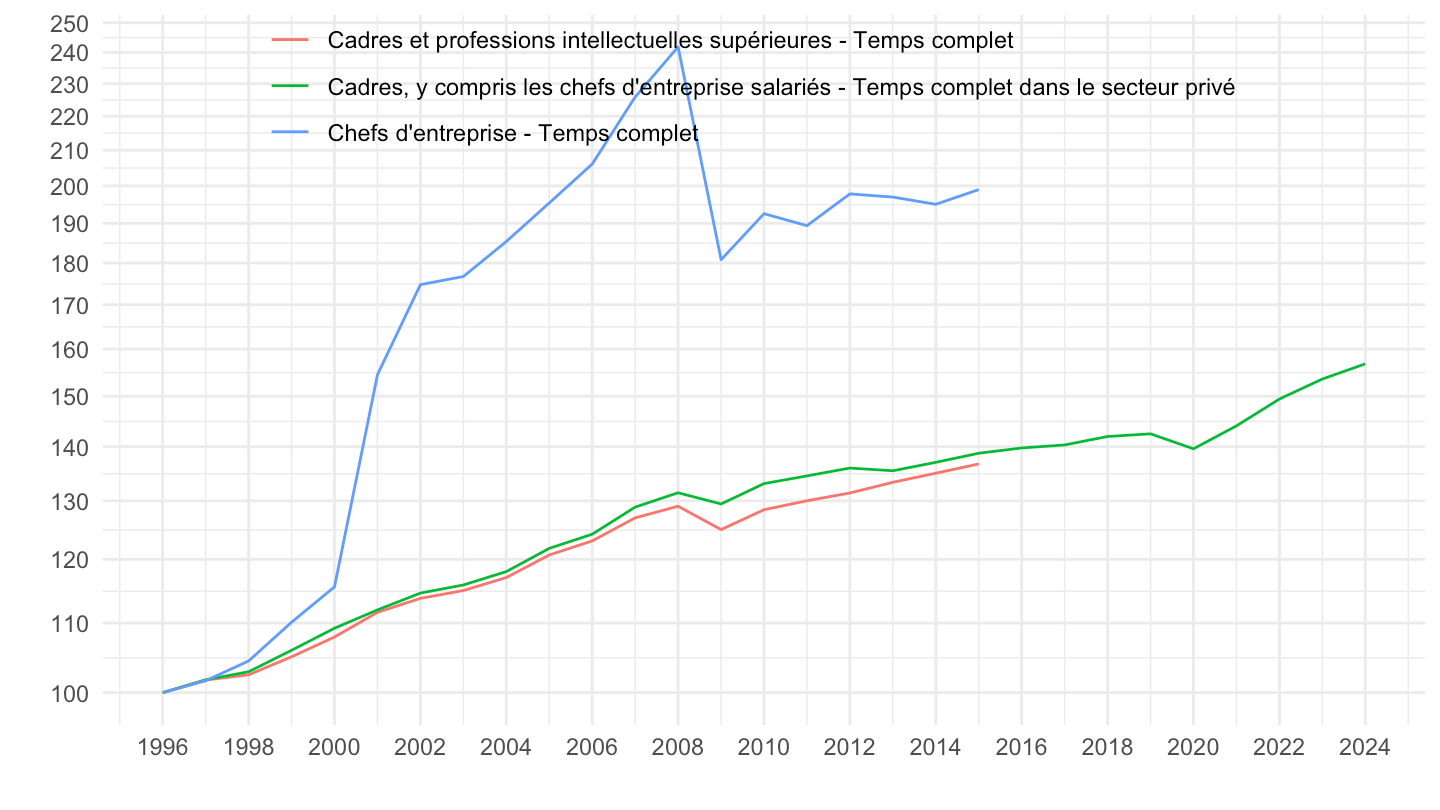
2017-
Value
Code
`SALAIRES-ANNUELS` %>%
  group_by(IDBANK, TITLE_FR) %>%
  filter(SEXE == "0",
         `QUOTITE-TRAV` == "TC",
         INDICATEUR == "SAL_ANN_MOY",
         METIER %in% c("CE", "3")) %>%
  year_to_date %>%
  arrange(desc(date)) %>%
  filter(date >= as.Date("2017-01-01")) %>%
  left_join(METIER, by = "METIER") %>%
  left_join(`QUOTITE-TRAV`, by = "QUOTITE-TRAV") %>%
  ggplot + geom_line(aes(x = date, y = OBS_VALUE/1000, color = paste(Metier, "-", `Quotite-Trav`)))  +
  theme_minimal() + ylab("") + xlab("")+
  theme(legend.title = element_blank(),
        legend.position = c(0.5, 0.9)) +
  scale_x_date(breaks = seq(1950, 2100, 1) %>% paste0("-01-01") %>% as.Date,
               labels = date_format("%Y")) +
  scale_y_log10(breaks = seq(0, 200, 5),
                     labels = scales::dollar_format(accuracy = 1, suffix = " k€", prefix = ""))
Index 100
Code
`SALAIRES-ANNUELS` %>%
  group_by(IDBANK, TITLE_FR) %>%
  filter(SEXE == "0",
         grepl(" temps complet", TITLE_FR),
         INDICATEUR == "SAL_ANN_MOY",
         METIER %in% c("CE", "3", "CCE")) %>%
  year_to_date %>%
  arrange(desc(date)) %>%
  filter(date >= as.Date("2017-01-01")) %>%
  left_join(METIER, by = "METIER") %>%
  left_join(`QUOTITE-TRAV`, by = "QUOTITE-TRAV") %>%
  group_by(METIER) %>%
  arrange(date) %>%
  mutate(OBS_VALUE = 100*OBS_VALUE/OBS_VALUE[1]) %>%
  ggplot + geom_line(aes(x = date, y = OBS_VALUE, color = paste(Metier, "-", `Quotite-Trav`)))  +
  theme_minimal() + ylab("") + xlab("")+
  theme(legend.title = element_blank(),
        legend.position = c(0.5, 0.9)) +
  scale_x_date(breaks = seq(1950, 2100, 1) %>% paste0("-01-01") %>% as.Date,
               labels = date_format("%Y")) +
  scale_y_log10(breaks = seq(0, 500, 10))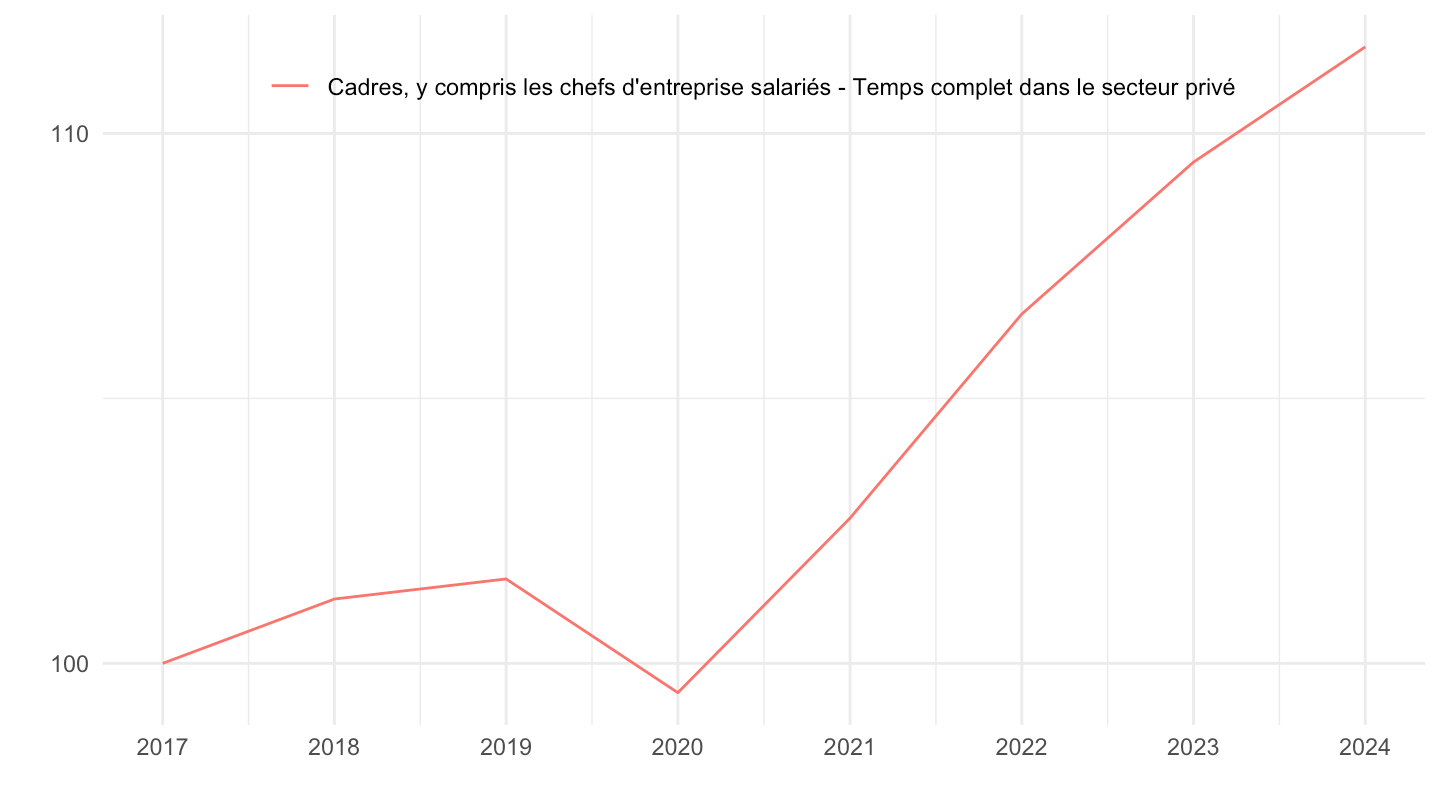
SAL_ANN_MOY - moyenne
Cadres
1984-
Value
Code
`SALAIRES-ANNUELS` %>%
  filter(INDICATEUR == "SAL_ANN_MOY",
         SEXE == "0",
         METIER %in% c("3", "CCE")) %>%
  left_join(METIER, by = "METIER") %>%
  left_join(`QUOTITE-TRAV`, by = "QUOTITE-TRAV") %>%
  year_to_date %>%
  arrange(date) %>%
  ggplot(.) + theme_minimal() + ylab("") + xlab("") +
  geom_line(aes(x = date, y = OBS_VALUE/1000, color = paste(Metier, "-", `Quotite-Trav`))) +
  theme(legend.title = element_blank(),
        legend.position = c(0.5, 0.8)) +
  scale_x_date(breaks = seq(1950, 2100, 5) %>% paste0("-01-01") %>% as.Date,
               labels = date_format("%Y")) +
  scale_y_log10(breaks = seq(0, 200, 1),
                     labels = scales::dollar_format(accuracy = 1, suffix = " k€", prefix = ""))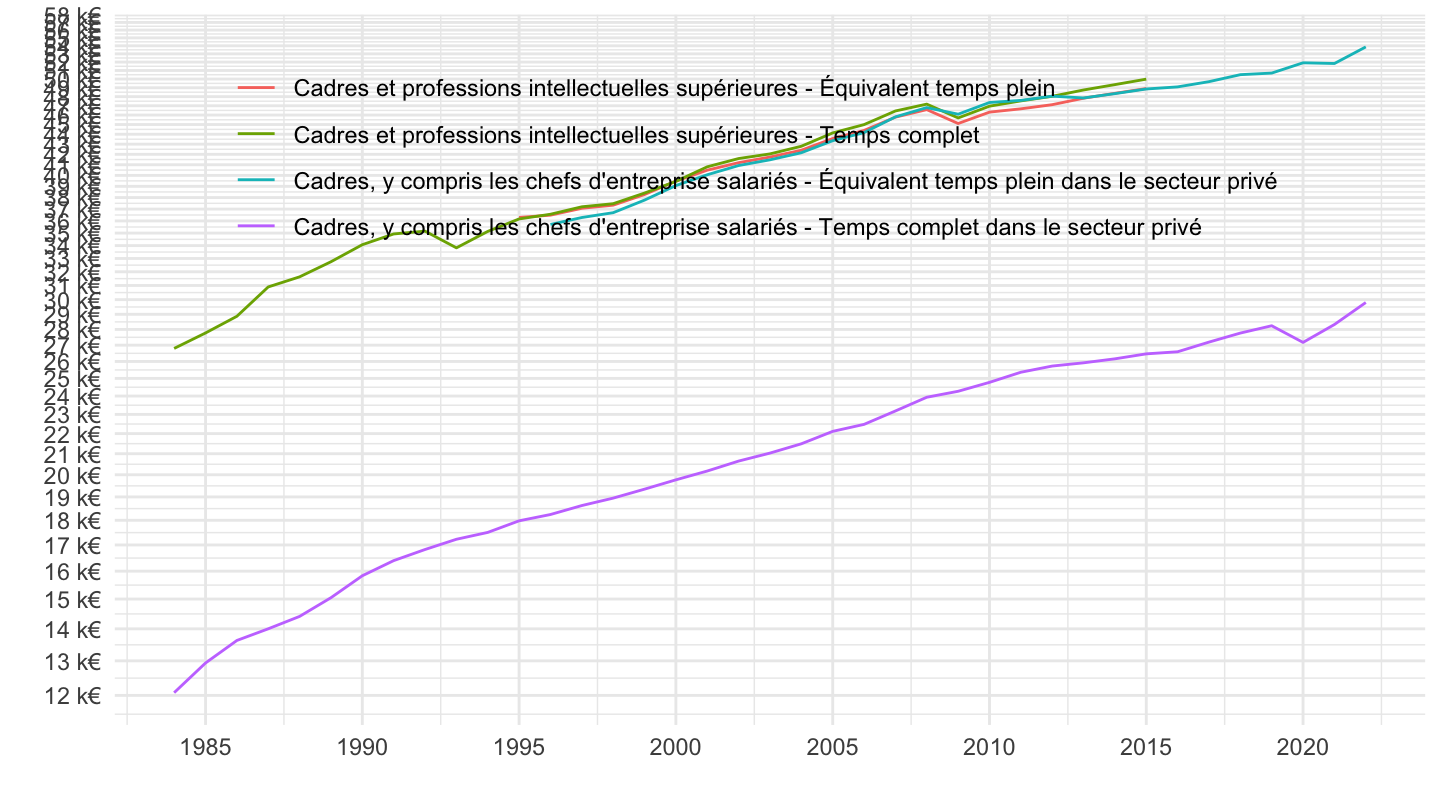
Indice
Code
`SALAIRES-ANNUELS` %>%
  filter(INDICATEUR == "SAL_ANN_MOY",
         SEXE == "0",
         METIER %in% c("3", "CCE")) %>%
  left_join(METIER, by = "METIER") %>%
  left_join(`QUOTITE-TRAV`, by = "QUOTITE-TRAV") %>%
  year_to_date %>%
  arrange(date) %>%
  group_by(Metier, `Quotite-Trav`) %>%
  mutate(OBS_VALUE = 100*OBS_VALUE/OBS_VALUE[date == as.Date("2000-01-01")]) %>%
  ggplot(.) + theme_minimal() + ylab("") + xlab("") +
  geom_line(aes(x = date, y = OBS_VALUE, color = paste(Metier, "-", `Quotite-Trav`))) +
  theme(legend.title = element_blank(),
        legend.position = c(0.5, 0.8)) +
  scale_x_date(breaks = seq(1950, 2100, 5) %>% paste0("-01-01") %>% as.Date,
               labels = date_format("%Y")) +
  scale_y_log10(breaks = seq(0, 200, 1),
                     labels = scales::dollar_format(accuracy = 1, suffix = " k€", prefix = ""))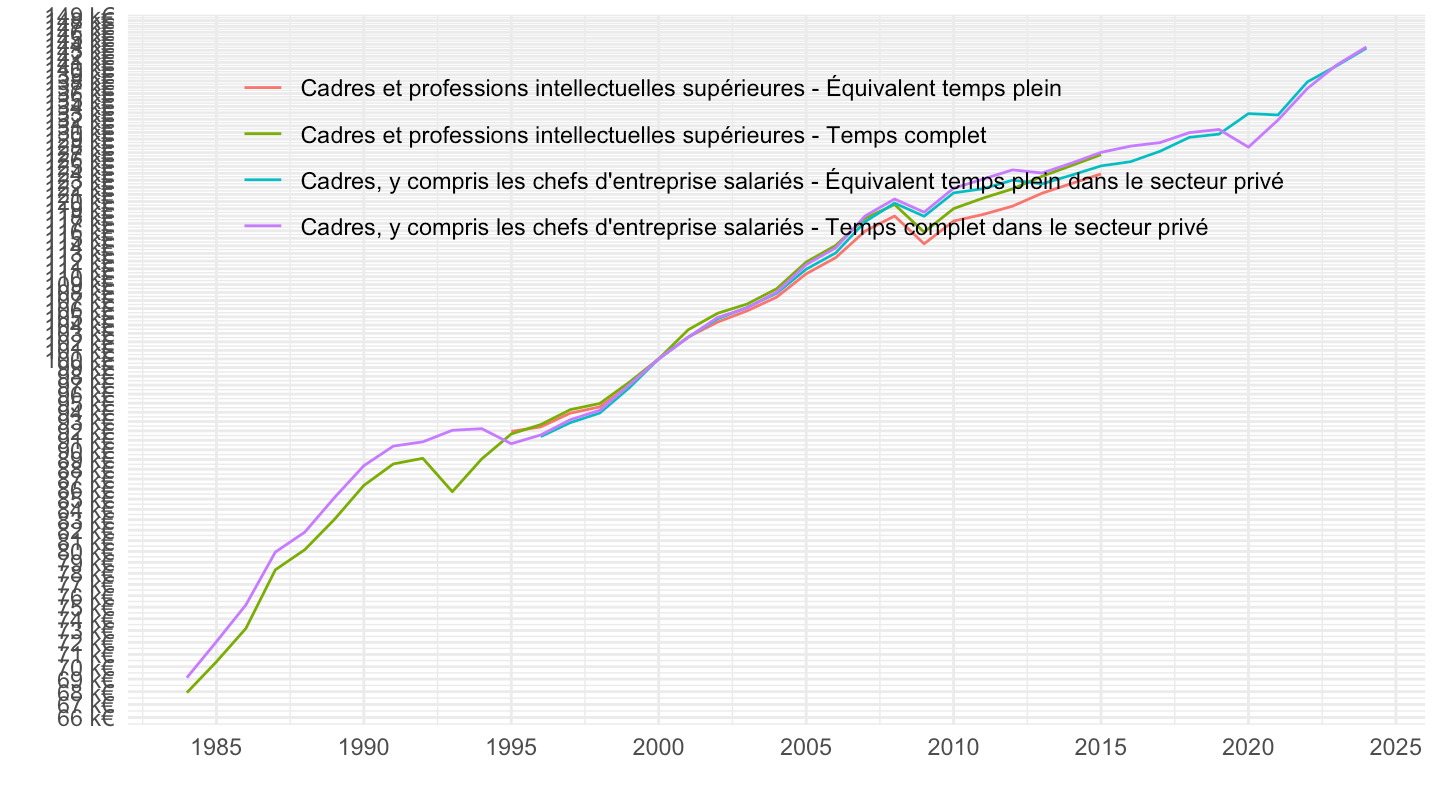
Temps complet
Code
`SALAIRES-ANNUELS` %>%
  filter(INDICATEUR == "SAL_ANN_MOY",
         SEXE == "0",
         METIER %in% c("3", "CCE"),
         grepl(" temps complet", TITLE_FR)) %>%
  left_join(METIER, by = "METIER") %>%
  left_join(`QUOTITE-TRAV`, by = "QUOTITE-TRAV") %>%
  year_to_date %>%
  arrange(date) %>%
  ggplot(.) + theme_minimal() + ylab("") + xlab("") +
  geom_line(aes(x = date, y = OBS_VALUE/1000, color = paste(Metier, "-", `Quotite-Trav`))) +
  theme(legend.title = element_blank(),
        legend.position = c(0.5, 0.8)) +
  scale_x_date(breaks = seq(1950, 2100, 5) %>% paste0("-01-01") %>% as.Date,
               labels = date_format("%Y")) +
  scale_y_log10(breaks = seq(0, 200, 1),
                     labels = scales::dollar_format(accuracy = 1, suffix = " k€", prefix = ""))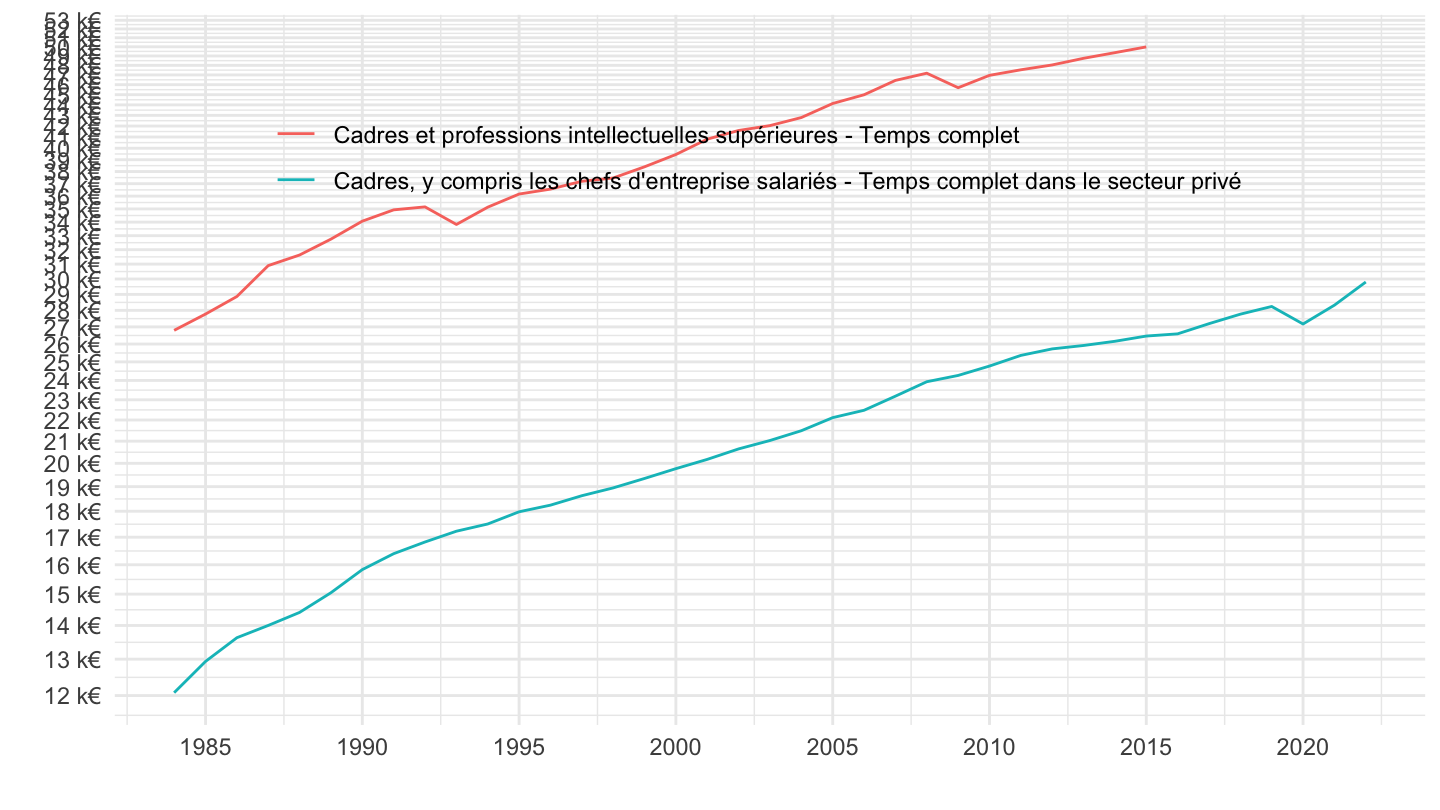
Base 100
Code
`SALAIRES-ANNUELS` %>%
  filter(INDICATEUR == "SAL_ANN_MOY",
         SEXE == "0",
         METIER %in% c("3", "CCE"),
         grepl(" temps complet", TITLE_FR)) %>%
  left_join(METIER, by = "METIER") %>%
  left_join(`QUOTITE-TRAV`, by = "QUOTITE-TRAV") %>%
  year_to_date %>%
  arrange(date) %>%
  group_by(Metier) %>%
  mutate(OBS_VALUE = 100*OBS_VALUE/OBS_VALUE[1]) %>%
  ggplot(.) + theme_minimal() + ylab("") + xlab("") +
  geom_line(aes(x = date, y = OBS_VALUE, color = paste(Metier, "-", `Quotite-Trav`))) +
  theme(legend.title = element_blank(),
        legend.position = c(0.4, 0.95)) +
  scale_x_date(breaks = seq(1950, 2100, 2) %>% paste0("-01-01") %>% as.Date,
               labels = date_format("%Y")) +
  scale_y_log10(breaks = seq(100, 200, 5))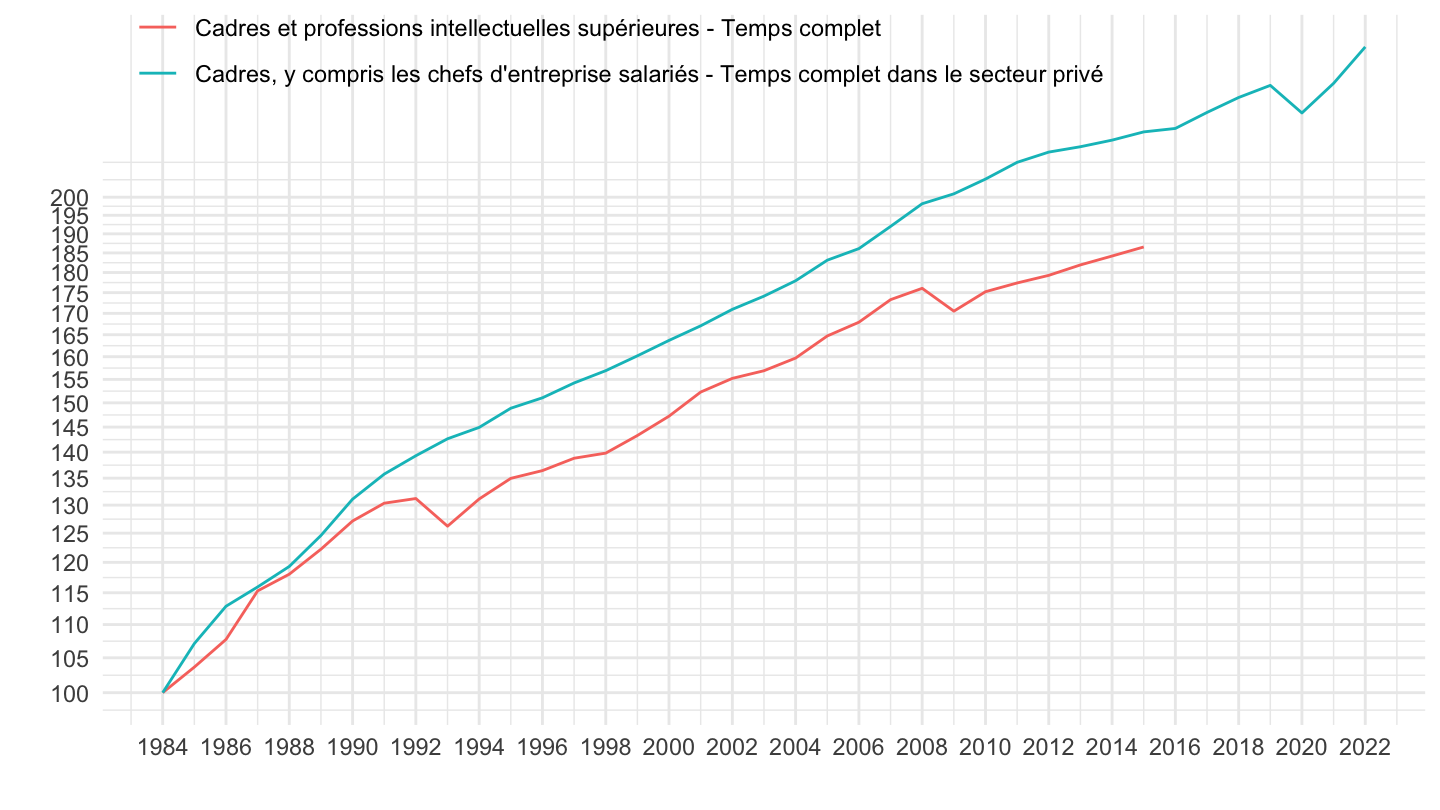
1990-
Value
Code
`SALAIRES-ANNUELS` %>%
  filter(INDICATEUR == "SAL_ANN_MOY",
         SEXE == "0",
         METIER %in% c("3", "CCE")) %>%
  left_join(METIER, by = "METIER") %>%
  left_join(`QUOTITE-TRAV`, by = "QUOTITE-TRAV") %>%
  year_to_date %>%
  filter(date >= as.Date("1990-01-01")) %>%
  ggplot(.) + theme_minimal() + ylab("") + xlab("") +
  geom_line(aes(x = date, y = OBS_VALUE/1000, color = paste(Metier, "-", `Quotite-Trav`))) +
  theme(legend.title = element_blank(),
        legend.position = c(0.5, 0.8)) +
  scale_x_date(breaks = seq(1950, 2100, 2) %>% paste0("-01-01") %>% as.Date,
               labels = date_format("%Y")) +
  scale_y_log10(breaks = seq(0, 200, 1),
                     labels = scales::dollar_format(accuracy = 1, suffix = " k€", prefix = ""))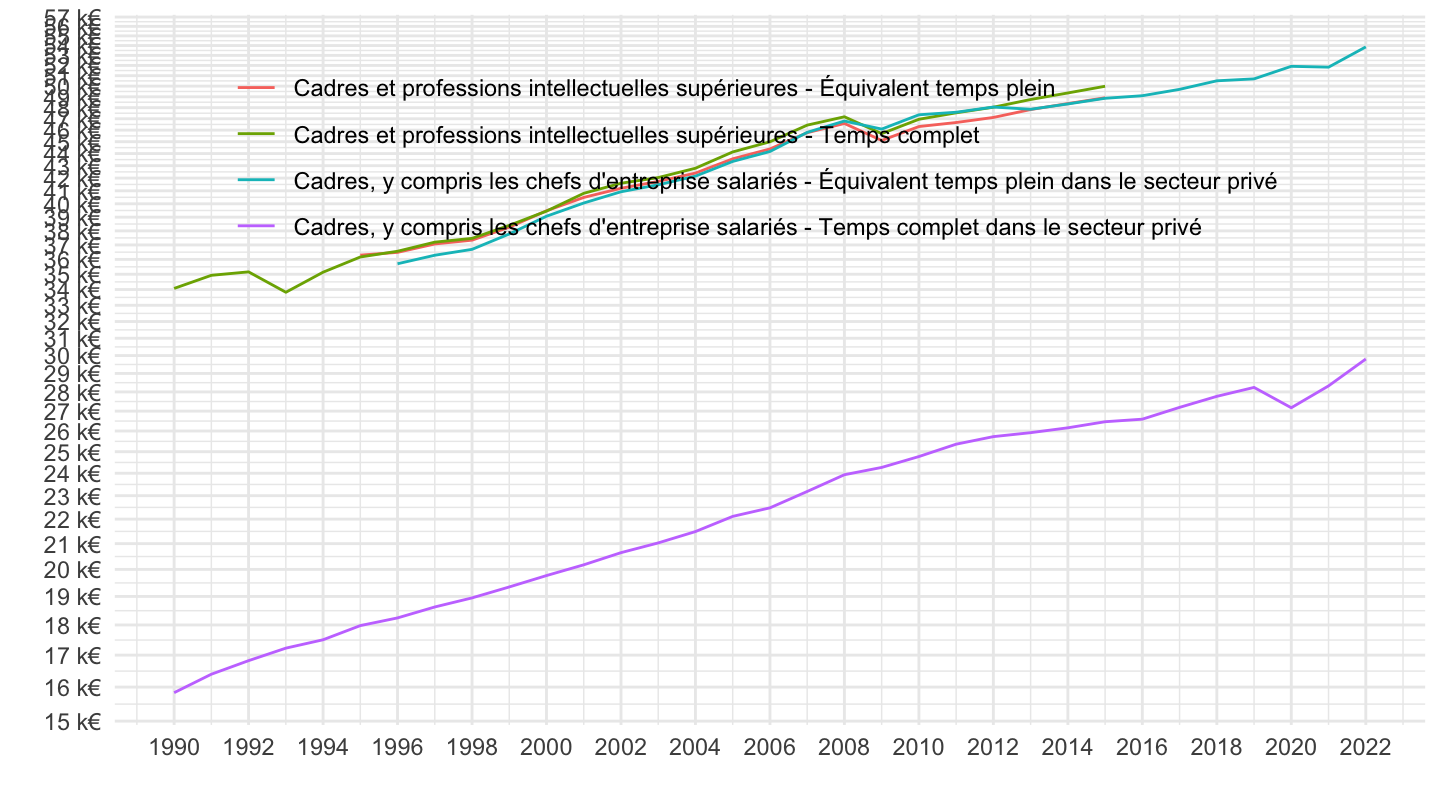
Temps complet
Code
`SALAIRES-ANNUELS` %>%
  filter(INDICATEUR == "SAL_ANN_MOY",
         SEXE == "0",
         METIER %in% c("3", "CCE"),
         grepl(" temps complet", TITLE_FR)) %>%
  left_join(METIER, by = "METIER") %>%
  left_join(`QUOTITE-TRAV`, by = "QUOTITE-TRAV") %>%
  year_to_date %>%
  filter(date >= as.Date("1990-01-01")) %>%
  ggplot(.) + theme_minimal() + ylab("") + xlab("") +
  geom_line(aes(x = date, y = OBS_VALUE/1000, color = paste(Metier, "-", `Quotite-Trav`))) +
  theme(legend.title = element_blank(),
        legend.position = c(0.5, 0.8)) +
  scale_x_date(breaks = seq(1950, 2100, 2) %>% paste0("-01-01") %>% as.Date,
               labels = date_format("%Y")) +
  scale_y_log10(breaks = seq(0, 200, 1),
                     labels = scales::dollar_format(accuracy = 1, suffix = " k€", prefix = ""))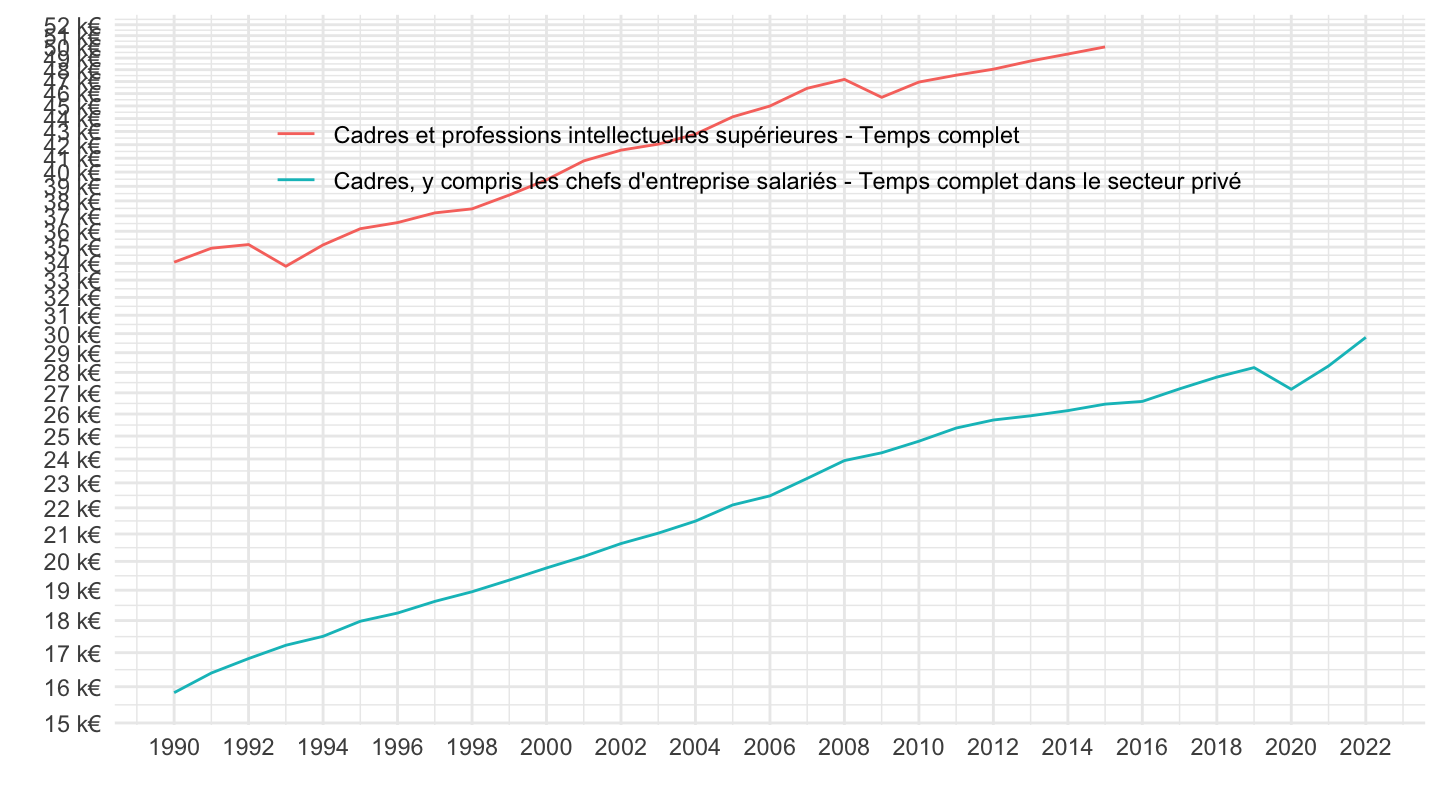
Base 100
Code
`SALAIRES-ANNUELS` %>%
  filter(INDICATEUR == "SAL_ANN_MOY",
         SEXE == "0",
         METIER %in% c("3", "CCE"),
         grepl(" temps complet", TITLE_FR)) %>%
  left_join(METIER, by = "METIER") %>%
  left_join(`QUOTITE-TRAV`, by = "QUOTITE-TRAV") %>%
  year_to_date %>%
  filter(date >= as.Date("1990-01-01")) %>%
  arrange(date) %>%
  group_by(Metier) %>%
  mutate(OBS_VALUE = 100*OBS_VALUE/OBS_VALUE[1]) %>%
  ggplot(.) + theme_minimal() + ylab("") + xlab("") +
  geom_line(aes(x = date, y = OBS_VALUE, color = paste(Metier, "-", `Quotite-Trav`))) +
  theme(legend.title = element_blank(),
        legend.position = c(0.4, 0.95)) +
  scale_x_date(breaks = seq(1950, 2100, 2) %>% paste0("-01-01") %>% as.Date,
               labels = date_format("%Y")) +
  scale_y_log10(breaks = seq(100, 200, 5))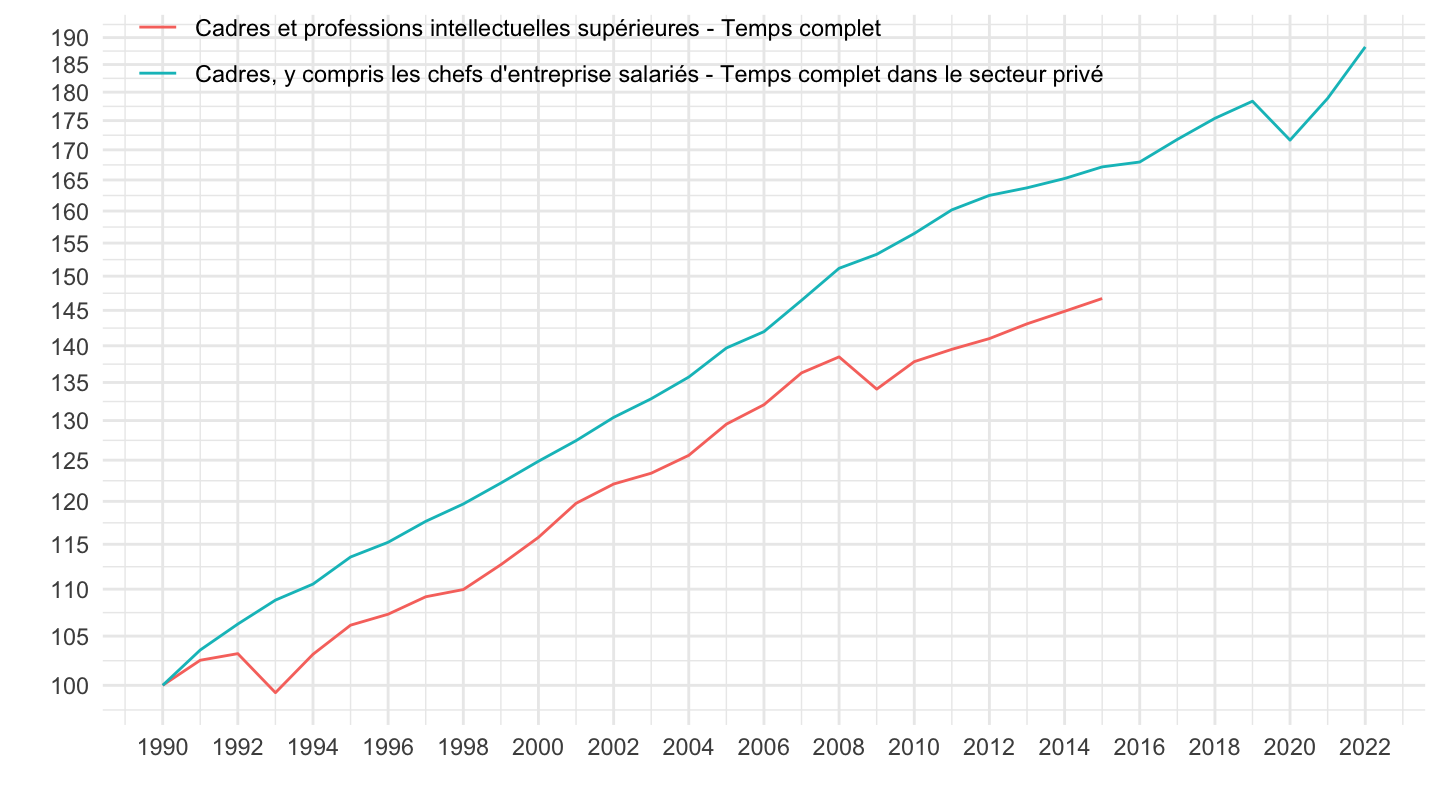
1995-
Code
`SALAIRES-ANNUELS` %>%
  filter(INDICATEUR == "SAL_ANN_MOY",
         SEXE == "0",
         METIER %in% c("3", "CCE")) %>%
  left_join(METIER, by = "METIER") %>%
  left_join(`QUOTITE-TRAV`, by = "QUOTITE-TRAV") %>%
  year_to_date %>%
  filter(date >= as.Date("1995-01-01")) %>%
  ggplot(.) + theme_minimal() + ylab("") + xlab("") +
  geom_line(aes(x = date, y = OBS_VALUE/1000, color = paste(Metier, "-", `Quotite-Trav`))) +
  theme(legend.title = element_blank(),
        legend.position = c(0.5, 0.8)) +
  scale_x_date(breaks = seq(1950, 2100, 2) %>% paste0("-01-01") %>% as.Date,
               labels = date_format("%Y")) +
  scale_y_log10(breaks = seq(0, 200, 1),
                     labels = scales::dollar_format(accuracy = 1, suffix = " k€", prefix = ""))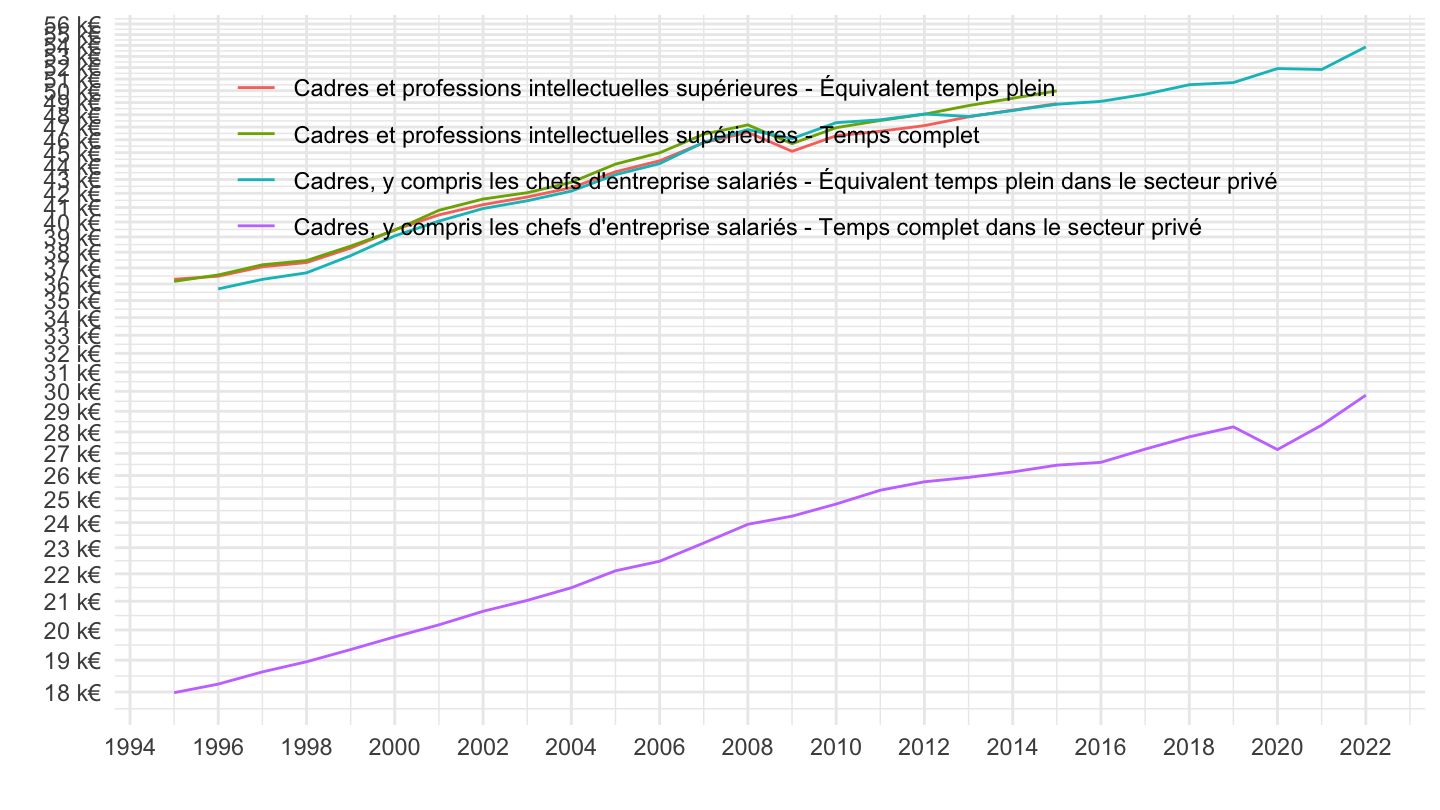
1996-
Code
`SALAIRES-ANNUELS` %>%
  filter(INDICATEUR == "SAL_ANN_MOY",
         SEXE == "0",
         METIER %in% c("3", "CCE")) %>%
  left_join(METIER, by = "METIER") %>%
  left_join(`QUOTITE-TRAV`, by = "QUOTITE-TRAV") %>%
  year_to_date %>%
  filter(date >= as.Date("1996-01-01")) %>%
  ggplot(.) + theme_minimal() + ylab("") + xlab("") +
  geom_line(aes(x = date, y = OBS_VALUE/1000, color = paste(Metier, "-", `Quotite-Trav`))) +
  theme(legend.title = element_blank(),
        legend.position = c(0.5, 0.8)) +
  scale_x_date(breaks = seq(1950, 2100, 2) %>% paste0("-01-01") %>% as.Date,
               labels = date_format("%Y")) +
  scale_y_log10(breaks = seq(0, 200, 1),
                     labels = scales::dollar_format(accuracy = 1, suffix = " k€", prefix = ""))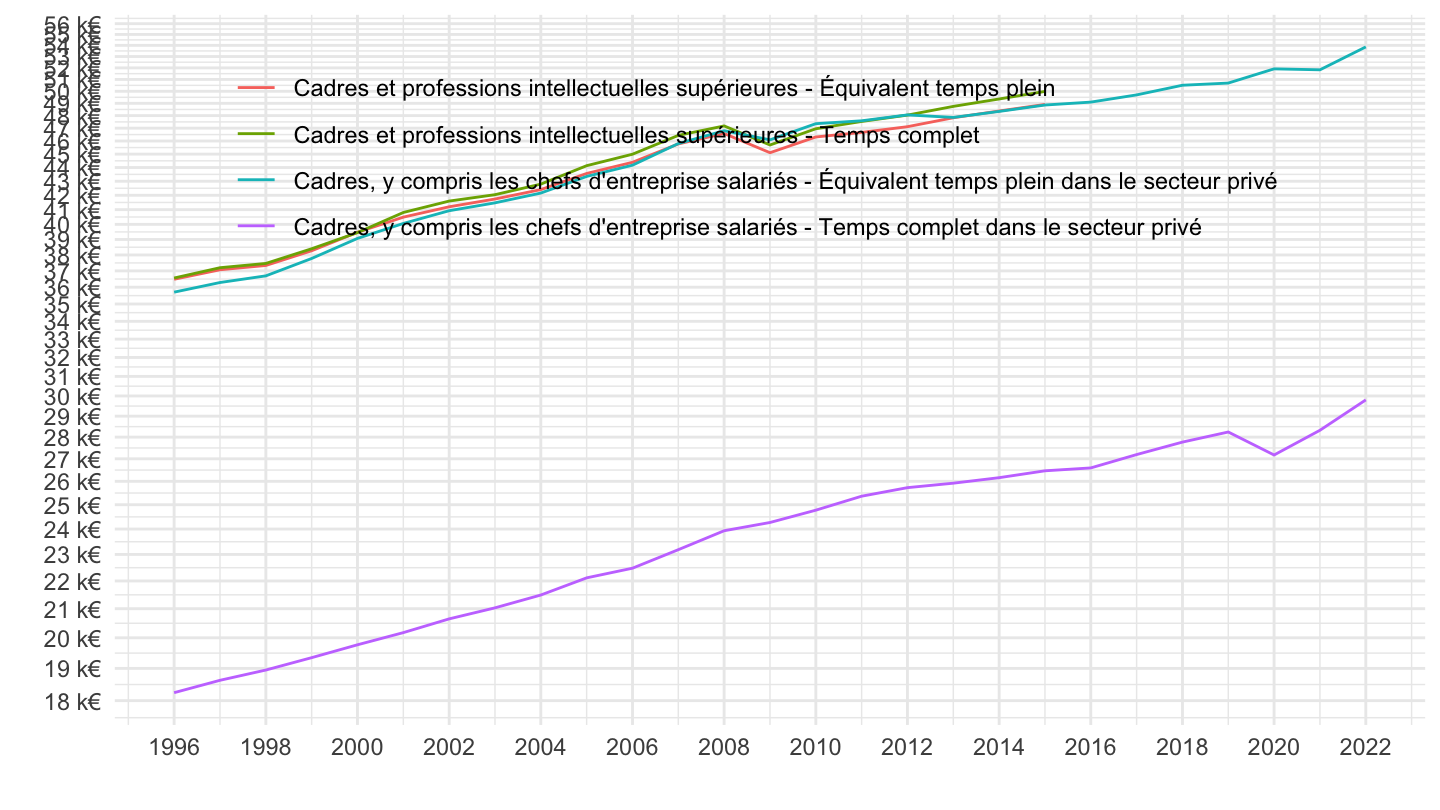
2000-
Value
Code
`SALAIRES-ANNUELS` %>%
  filter(INDICATEUR == "SAL_ANN_MOY",
         SEXE == "0",
         METIER %in% c("3", "CCE")) %>%
  left_join(METIER, by = "METIER") %>%
  left_join(`QUOTITE-TRAV`, by = "QUOTITE-TRAV") %>%
  year_to_date %>%
  filter(date >= as.Date("2000-01-01")) %>%
  ggplot(.) + theme_minimal() + ylab("") + xlab("") +
  geom_line(aes(x = date, y = OBS_VALUE/1000, color = paste(Metier, "-", `Quotite-Trav`))) +
  theme(legend.title = element_blank(),
        legend.position = c(0.5, 0.8)) +
  scale_x_date(breaks = seq(1950, 2100, 2) %>% paste0("-01-01") %>% as.Date,
               labels = date_format("%Y")) +
  scale_y_log10(breaks = seq(0, 200, 1),
                     labels = scales::dollar_format(accuracy = 1, suffix = " k€", prefix = ""))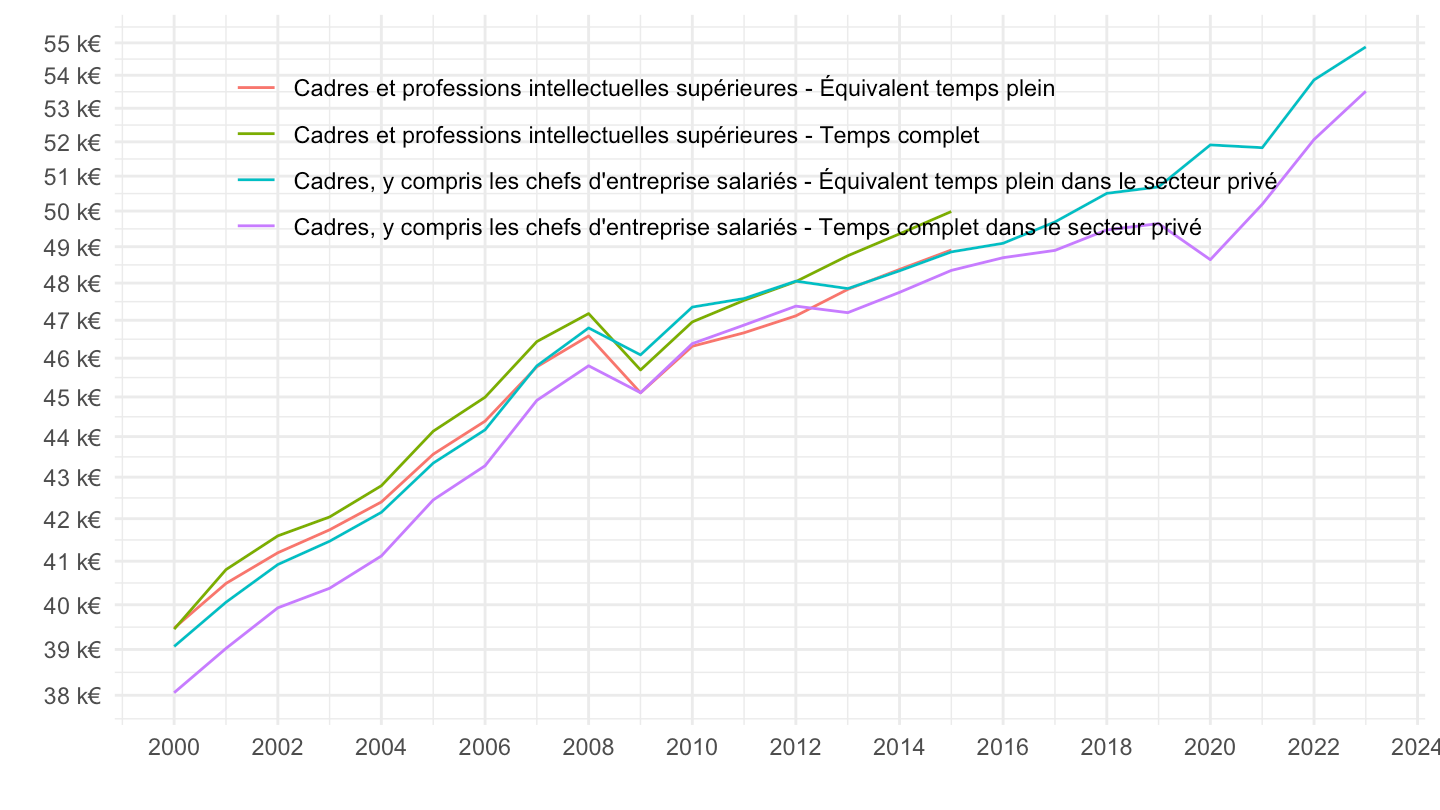
Base 100
Code
`SALAIRES-ANNUELS` %>%
  filter(INDICATEUR == "SAL_ANN_MOY",
         SEXE == "0",
         METIER %in% c("3", "CCE"),
         grepl(" temps complet", TITLE_FR)) %>%
  left_join(METIER, by = "METIER") %>%
  left_join(`QUOTITE-TRAV`, by = "QUOTITE-TRAV") %>%
  year_to_date %>%
  filter(date >= as.Date("2000-01-01")) %>%
  arrange(date) %>%
  group_by(Metier) %>%
  mutate(OBS_VALUE = 100*OBS_VALUE/OBS_VALUE[1]) %>%
  ggplot(.) + theme_minimal() + ylab("") + xlab("") +
  geom_line(aes(x = date, y = OBS_VALUE, color = paste(Metier, "-", `Quotite-Trav`))) +
  theme(legend.title = element_blank(),
        legend.position = c(0.4, 0.95)) +
  scale_x_date(breaks = seq(1950, 2100, 2) %>% paste0("-01-01") %>% as.Date,
               labels = date_format("%Y")) +
  scale_y_log10(breaks = seq(100, 200, 5))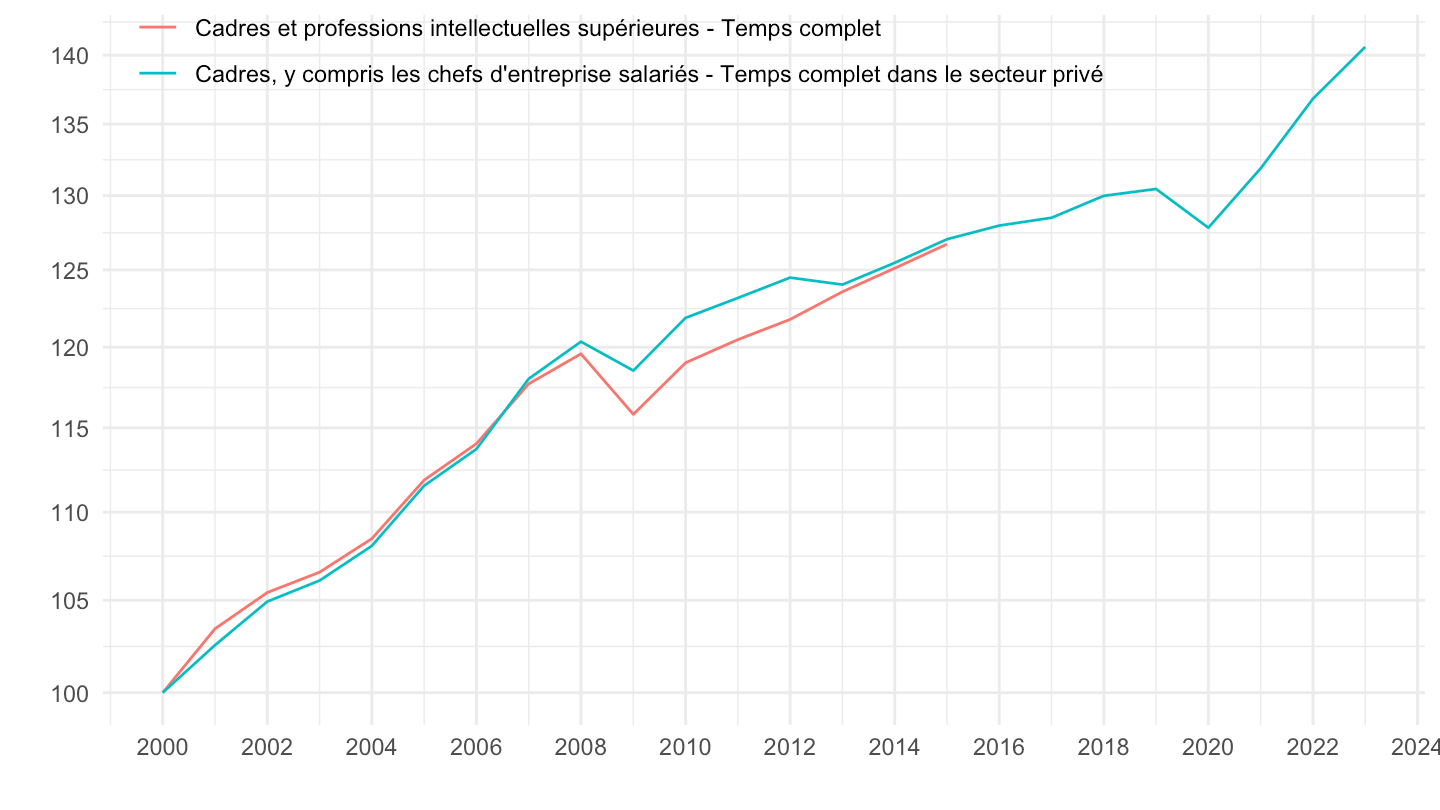
2017-
Value
Code
`SALAIRES-ANNUELS` %>%
  filter(INDICATEUR == "SAL_ANN_MOY",
         SEXE == "0",
         METIER %in% c("3", "CCE")) %>%
  left_join(METIER, by = "METIER") %>%
  left_join(`QUOTITE-TRAV`, by = "QUOTITE-TRAV") %>%
  year_to_date %>%
  filter(date >= as.Date("2017-01-01")) %>%
  ggplot(.) + theme_minimal() + ylab("") + xlab("") +
  geom_line(aes(x = date, y = OBS_VALUE/1000, color = paste(Metier, "-", `Quotite-Trav`))) +
  theme(legend.title = element_blank(),
        legend.position = c(0.5, 0.8)) +
  scale_x_date(breaks = seq(1950, 2100, 1) %>% paste0("-01-01") %>% as.Date,
               labels = date_format("%Y")) +
  scale_y_log10(breaks = seq(0, 200, 1),
                     labels = scales::dollar_format(accuracy = 1, suffix = " k€", prefix = ""))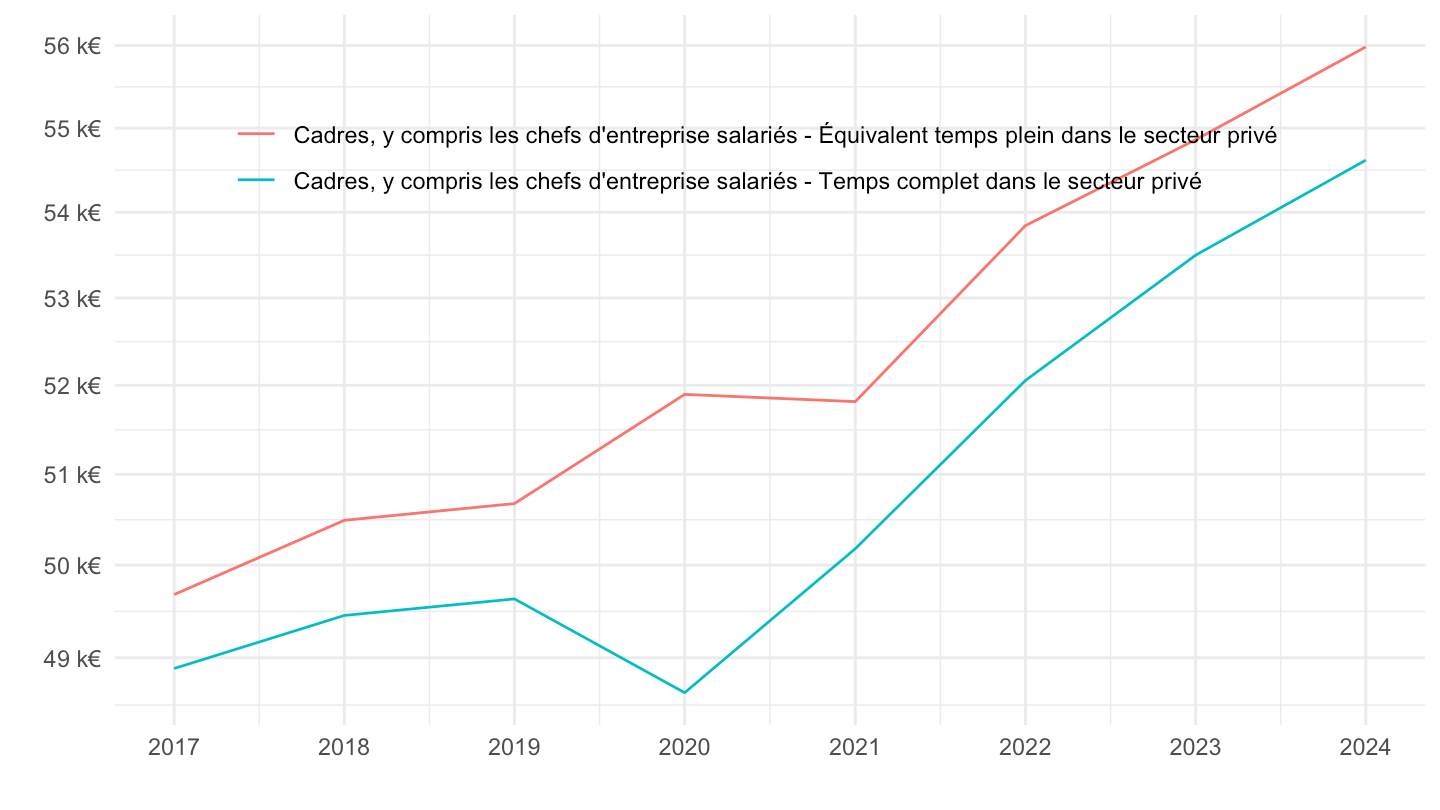
Base 100
Code
`SALAIRES-ANNUELS` %>%
  filter(INDICATEUR == "SAL_ANN_MOY",
         SEXE == "0",
         METIER %in% c("3", "CCE"),
         grepl(" temps complet", TITLE_FR)) %>%
  left_join(METIER, by = "METIER") %>%
  left_join(`QUOTITE-TRAV`, by = "QUOTITE-TRAV") %>%
  year_to_date %>%
  filter(date >= as.Date("2017-01-01")) %>%
  arrange(date) %>%
  group_by(Metier) %>%
  mutate(OBS_VALUE = 100*OBS_VALUE/OBS_VALUE[1]) %>%
  ggplot(.) + theme_minimal() + ylab("") + xlab("") +
  geom_line(aes(x = date, y = OBS_VALUE, color = paste(Metier, "-", `Quotite-Trav`))) +
  theme(legend.title = element_blank(),
        legend.position = c(0.4, 0.95)) +
  scale_x_date(breaks = seq(1950, 2100, 1) %>% paste0("-01-01") %>% as.Date,
               labels = date_format("%Y")) +
  scale_y_log10(breaks = seq(100, 200, 5))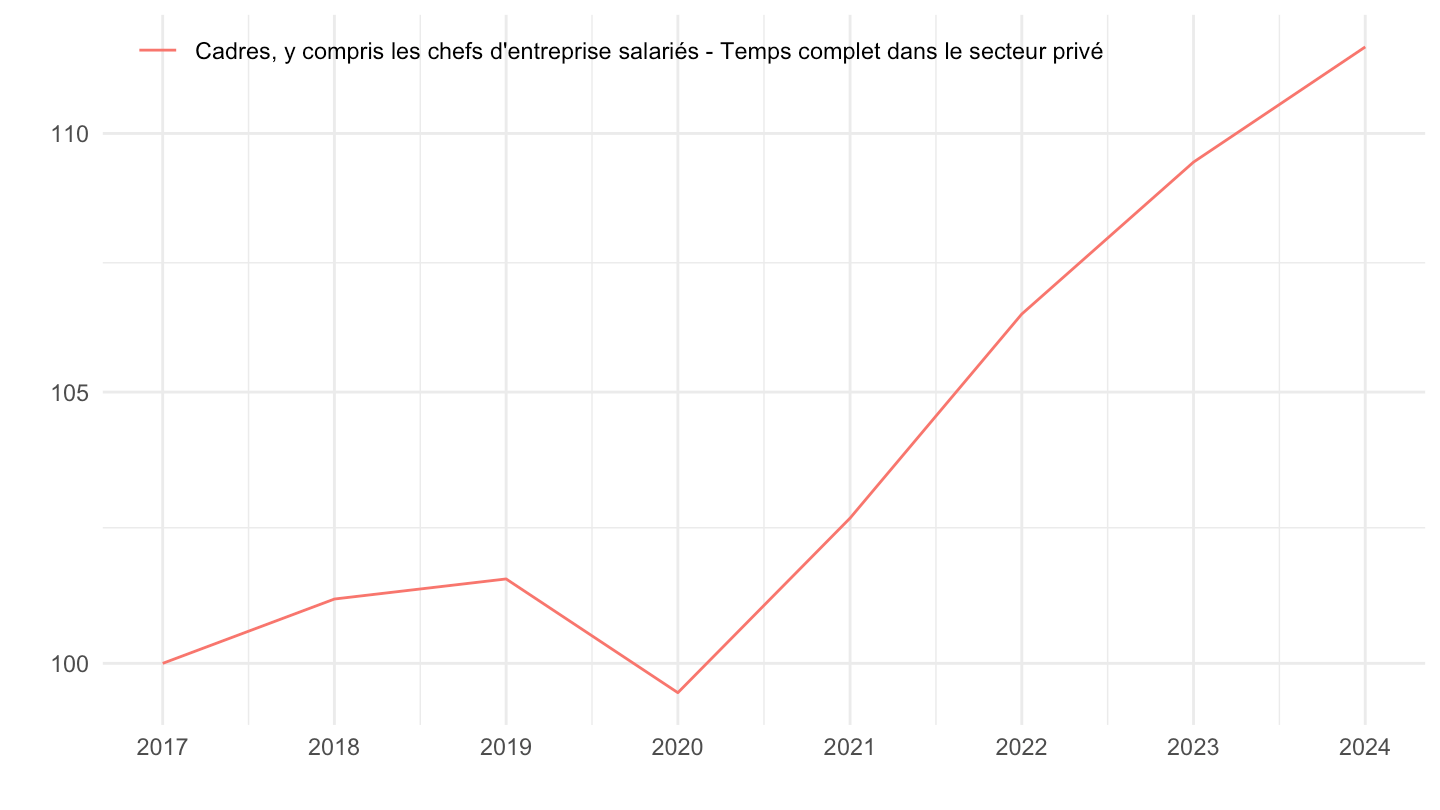
Salaires annuels moyens, ETPP
Cadres, Employés, Ouvriers, Prof. intermédiaires, SO
Values
Code
`SALAIRES-ANNUELS` %>%
  filter(INDICATEUR == "SAL_ANN_MOY",
         SEXE == "0",
         `QUOTITE-TRAV` == "ETPP") %>%
  left_join(METIER, by = "METIER") %>%
  year_to_date %>%
  ggplot(.) + theme_minimal() + ylab("") + xlab("") +
  geom_line(aes(x = date, y = OBS_VALUE/1000, color = Metier)) +
  theme(legend.title = element_blank(),
        legend.position = c(0.7, 0.7)) +
  scale_x_date(breaks = seq(1950, 2100, 2) %>% paste0("-01-01") %>% as.Date,
               labels = date_format("%Y")) +
  scale_y_log10(breaks = seq(0, 200, 5),
                     labels = scales::dollar_format(accuracy = 1, suffix = " k€", prefix = ""))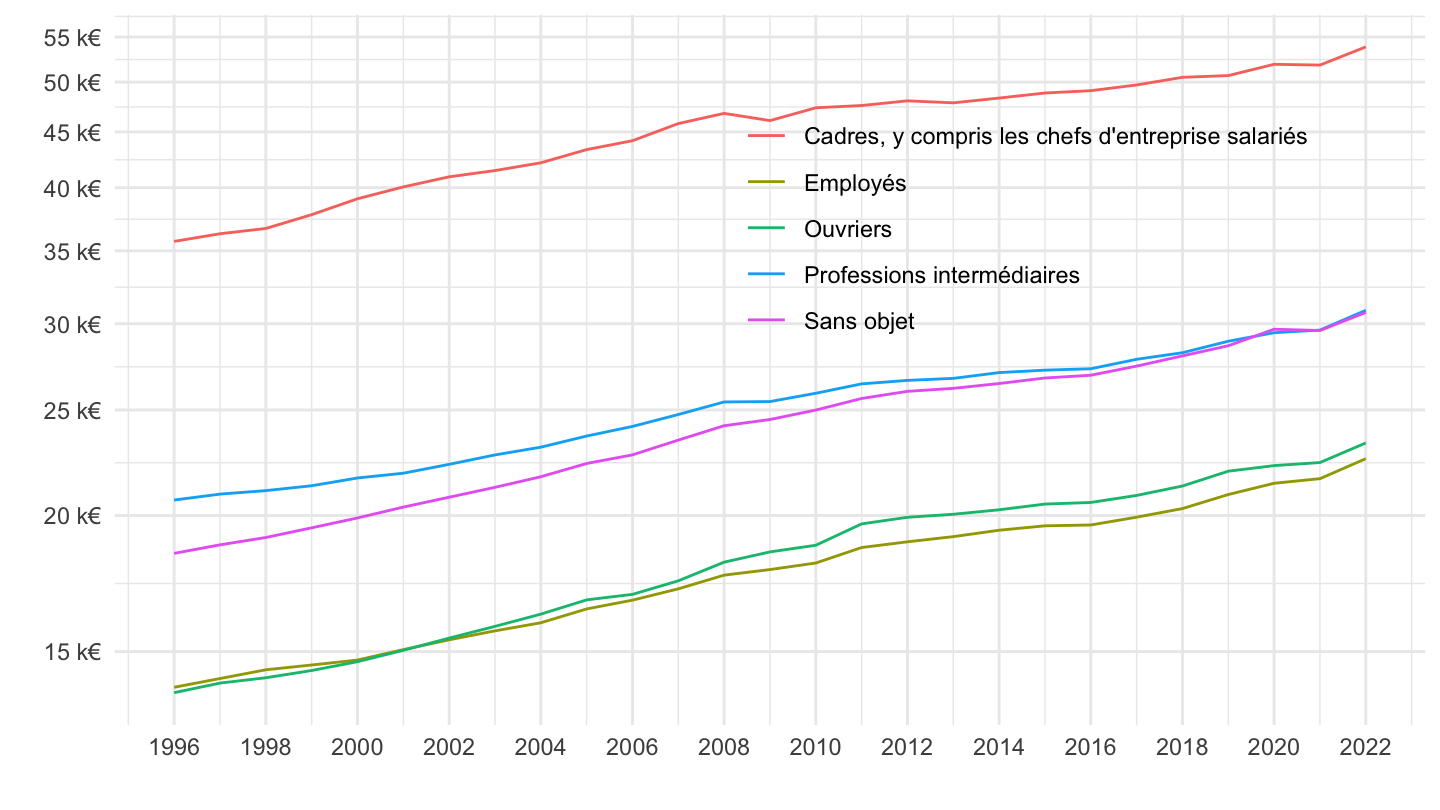
Indice
Tous
Code
`SALAIRES-ANNUELS` %>%
  filter(INDICATEUR == "SAL_ANN_MOY",
         SEXE == "0",
         `QUOTITE-TRAV` == "ETPP") %>%
  left_join(METIER, by = "METIER") %>%
  year_to_date %>%
  group_by(Metier) %>%
  mutate(OBS_VALUE = 100*OBS_VALUE/OBS_VALUE[date == as.Date("1996-01-01")]) %>%
  ggplot(.) + theme_minimal() + ylab("") + xlab("") +
  geom_line(aes(x = date, y = OBS_VALUE, color = Metier)) +
  theme(legend.title = element_blank(),
        legend.position = c(0.3, 0.8)) +
  scale_x_date(breaks = seq(1950, 2100, 2) %>% paste0("-01-01") %>% as.Date,
               labels = date_format("%Y")) +
  scale_y_log10(breaks = seq(100, 200, 5))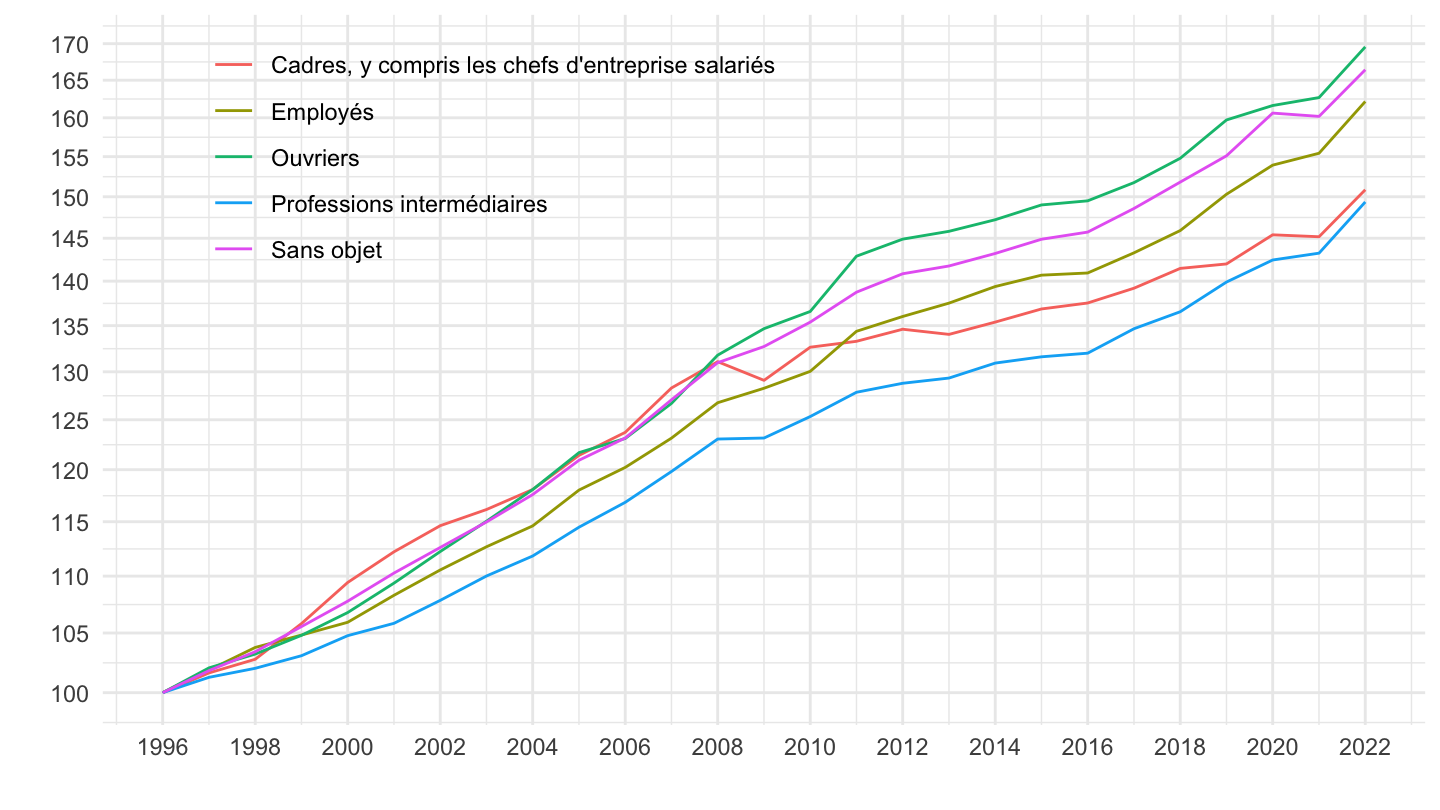
2008-
Code
`SALAIRES-ANNUELS` %>%
  filter(INDICATEUR == "SAL_ANN_MOY",
         SEXE == "0",
         `QUOTITE-TRAV` == "ETPP") %>%
  left_join(METIER, by = "METIER") %>%
  year_to_date %>%
  group_by(Metier) %>%
  filter(date >= as.Date("2008-01-01")) %>%
  mutate(OBS_VALUE = 100*OBS_VALUE/OBS_VALUE[date == as.Date("2008-01-01")]) %>%
  ggplot(.) + theme_minimal() + ylab("") + xlab("") +
  geom_line(aes(x = date, y = OBS_VALUE, color = Metier)) +
  theme(legend.title = element_blank(),
        legend.position = c(0.3, 0.8)) +
  scale_x_date(breaks = seq(1950, 2100, 2) %>% paste0("-01-01") %>% as.Date,
               labels = date_format("%Y")) +
  scale_y_log10(breaks = seq(100, 200, 5))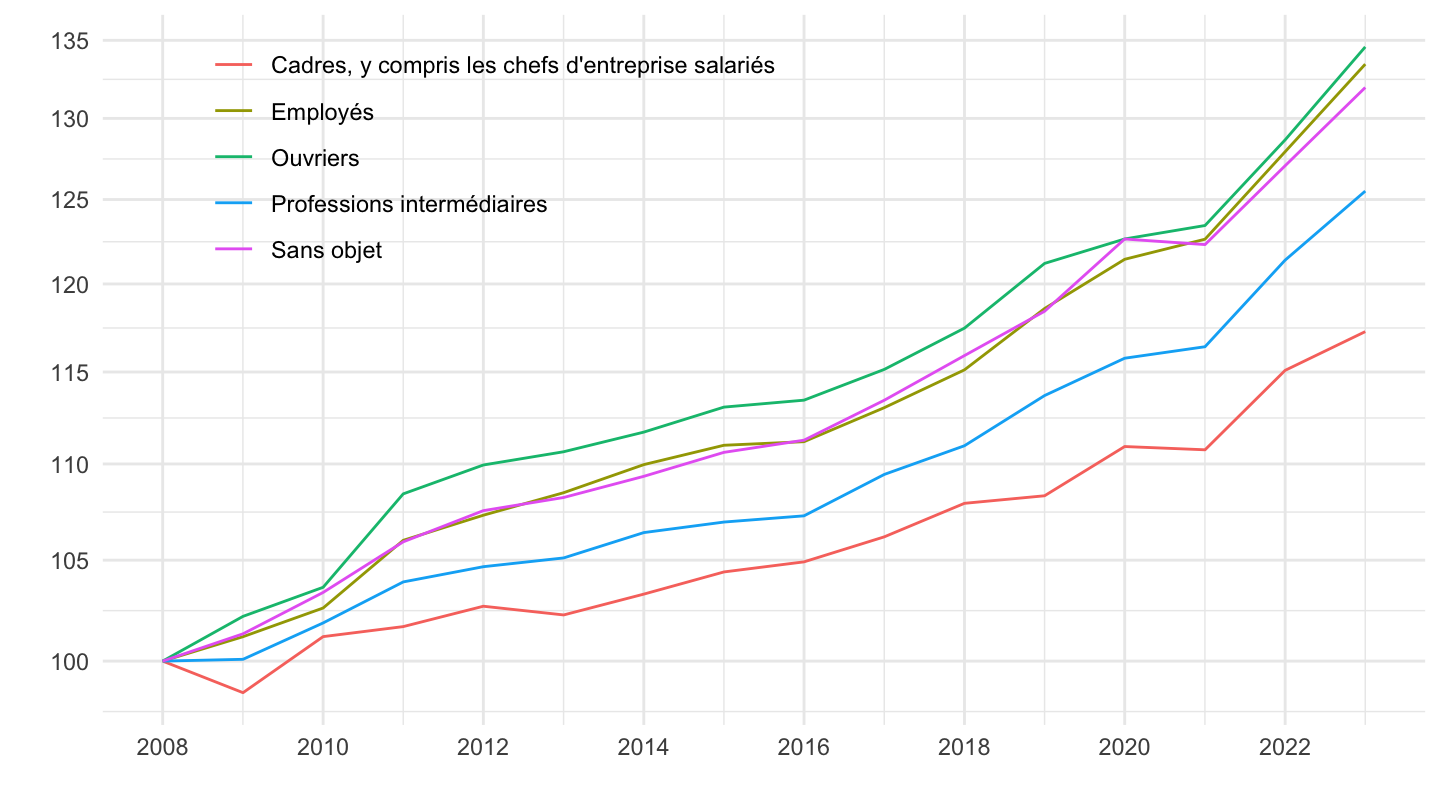
2017-
Code
`SALAIRES-ANNUELS` %>%
  filter(INDICATEUR == "SAL_ANN_MOY",
         SEXE == "0",
         `QUOTITE-TRAV` == "ETPP") %>%
  left_join(METIER, by = "METIER") %>%
  year_to_date %>%
  group_by(Metier) %>%
  filter(date >= as.Date("2017-01-01")) %>%
  mutate(OBS_VALUE = 100*OBS_VALUE/OBS_VALUE[date == as.Date("2017-01-01")]) %>%
  ggplot(.) + theme_minimal() + ylab("") + xlab("") +
  geom_line(aes(x = date, y = OBS_VALUE, color = Metier)) +
  theme(legend.title = element_blank(),
        legend.position = c(0.3, 0.8)) +
  scale_x_date(breaks = seq(1950, 2100, 1) %>% paste0("-01-01") %>% as.Date,
               labels = date_format("%Y")) +
  scale_y_log10(breaks = seq(100, 200, 5))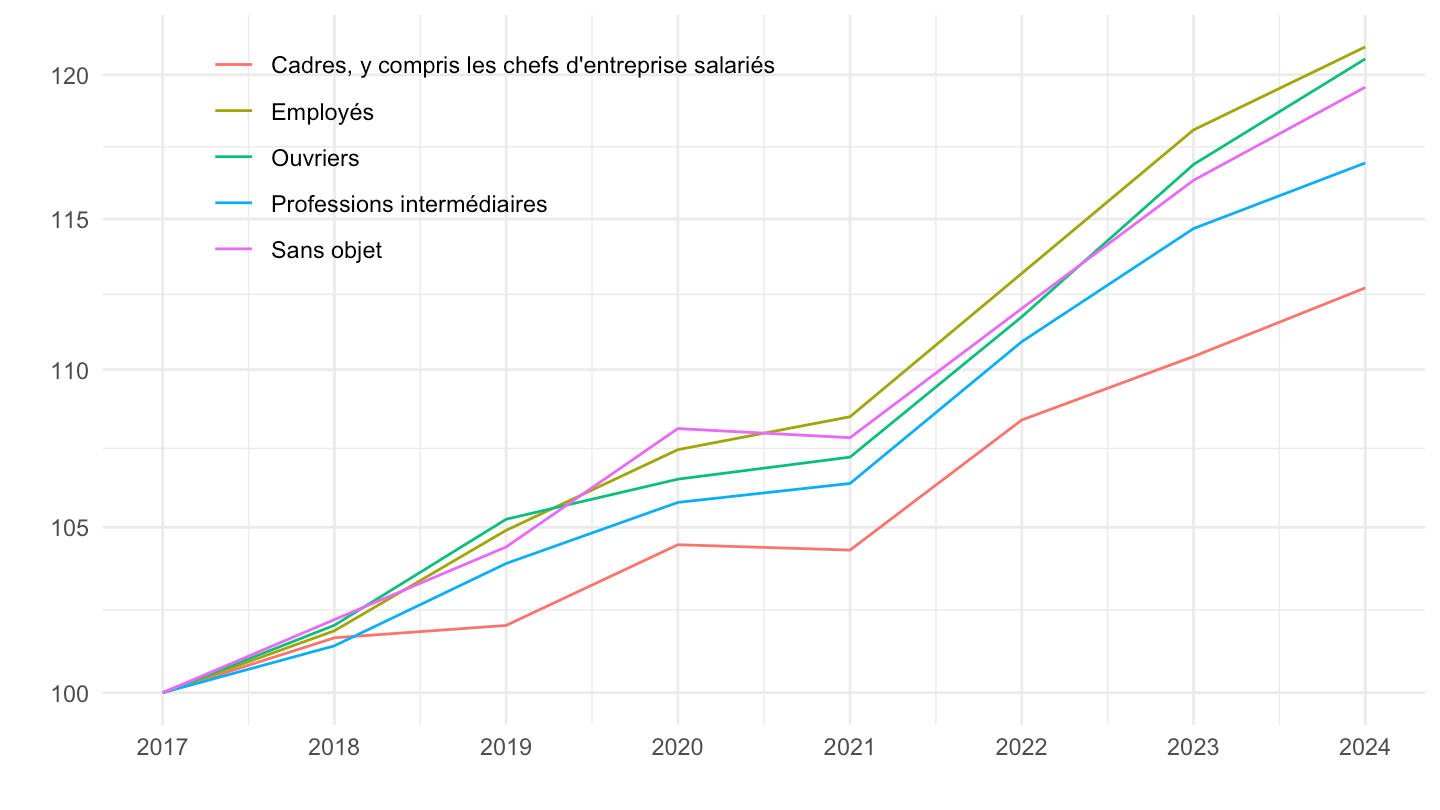
Cadres , Professions intermédiaires
Indice - Nominal, Réel
Code
`SALAIRES-ANNUELS` %>%
  filter(INDICATEUR == "SAL_ANN_MOY",
         SEXE == "0",
         `QUOTITE-TRAV` == "ETPP",
         METIER %in% c("CCE", "4")) %>%
  left_join(METIER, by = "METIER") %>%
  year_to_date %>%
  group_by(Metier) %>%
  mutate(OBS_VALUE = 100*OBS_VALUE/OBS_VALUE[date == as.Date("1996-01-01")]) %>%
  ungroup %>%
  left_join(`inflation-A`, by = "date") %>%
  arrange(date) %>%
  transmute(date, Metier,
            `Nominal` = OBS_VALUE,
            `Réel (inflation IPCH)` = IPCH[1]*OBS_VALUE/IPCH,
            `Réel (inflation IPC)` = IPC[1]*OBS_VALUE/IPC) %>%
  gather(variable, value, -date, -Metier) %>%
  ggplot() + geom_line(aes(x = date, y = value,  color = variable, linetype = Metier)) +
  theme_minimal() + ylab("") + xlab("") +
  scale_color_manual(values = c("darkgrey", "#F8766D", "#619CFF")) +
  scale_x_date(breaks = seq(1920, 2100, 2) %>% paste0("-01-01") %>% as.Date,
               labels = date_format("%Y")) +
  theme(legend.position = c(0.3, 0.8),
        legend.title = element_blank()) +
  scale_y_log10(breaks = seq(0, 200, 5))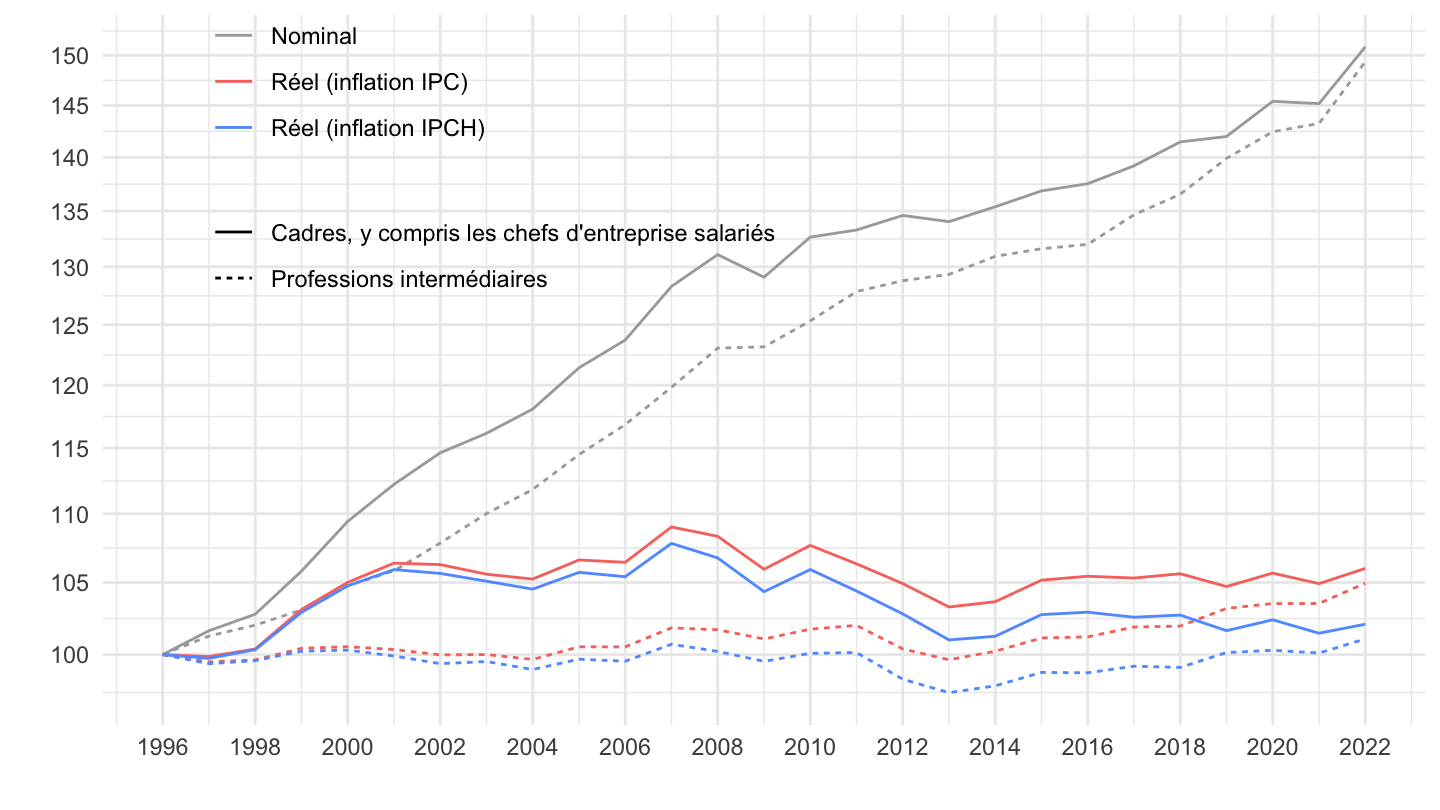
Indice - Réel
1996-
Code
`SALAIRES-ANNUELS` %>%
  filter(INDICATEUR == "SAL_ANN_MOY",
         SEXE == "0",
         `QUOTITE-TRAV` == "ETPP",
         METIER %in% c("CCE", "4")) %>%
  left_join(METIER, by = "METIER") %>%
  year_to_date %>%
  group_by(Metier) %>%
  mutate(OBS_VALUE = 100*OBS_VALUE/OBS_VALUE[date == as.Date("1996-01-01")]) %>%
  ungroup %>%
  left_join(`inflation-A`, by = "date") %>%
  arrange(date) %>%
  transmute(date, Metier,
            `Réel (inflation IPCH)` = IPCH[1]*OBS_VALUE/IPCH,
            `Réel (inflation IPC)` = IPC[1]*OBS_VALUE/IPC) %>%
  gather(variable, value, -date, -Metier) %>%
  ggplot() + geom_line(aes(x = date, y = value,  color = variable, linetype = Metier)) +
  theme_minimal() + ylab("Salaire (100 = 1996)") + xlab("") +
  #scale_color_manual(values = c("darkgrey", "#F8766D", "#619CFF")) +
  scale_x_date(breaks = seq(1920, 2100, 2) %>% paste0("-01-01") %>% as.Date,
               labels = date_format("%Y")) +
  theme(legend.position = c(0.4, 0.15),
        legend.title = element_blank(),
        legend.direction = "horizontal") +
  scale_y_log10(breaks = seq(0, 200, 1))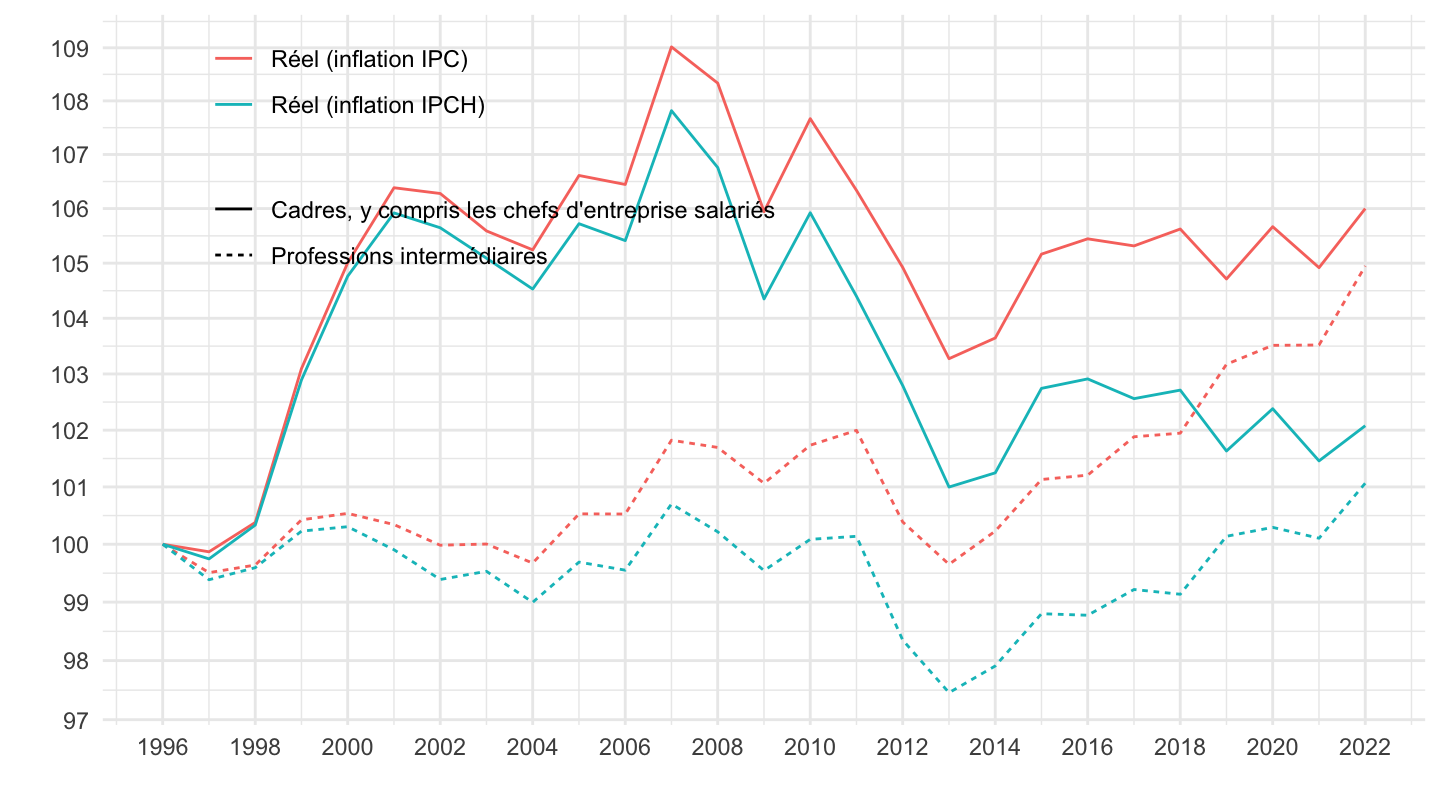
2000-
Code
`SALAIRES-ANNUELS` %>%
  filter(INDICATEUR == "SAL_ANN_MOY",
         SEXE == "0",
         `QUOTITE-TRAV` == "ETPP",
         METIER %in% c("CCE", "4")) %>%
  left_join(METIER, by = "METIER") %>%
  year_to_date %>%
  filter(date >= as.Date("2000-01-01")) %>%
  group_by(Metier) %>%
  mutate(OBS_VALUE = 100*OBS_VALUE/OBS_VALUE[date == as.Date("2000-01-01")]) %>%
  ungroup %>%
  left_join(`inflation-A`, by = "date") %>%
  arrange(date) %>%
  transmute(date, Metier,
            `Réel (inflation IPCH)` = IPCH[1]*OBS_VALUE/IPCH,
            `Réel (inflation IPC)` = IPC[1]*OBS_VALUE/IPC) %>%
  gather(variable, value, -date, -Metier) %>%
  ggplot() + geom_line(aes(x = date, y = value,  color = variable, linetype = Metier)) +
  theme_minimal() + ylab("") + xlab("") +
  #scale_color_manual(values = c("darkgrey", "#F8766D", "#619CFF")) +
  scale_x_date(breaks = seq(1920, 2100, 2) %>% paste0("-01-01") %>% as.Date,
               labels = date_format("%Y")) +
  theme(legend.position = c(0.3, 0.3),
        legend.title = element_blank()) +
  scale_y_log10(breaks = seq(0, 200, 1))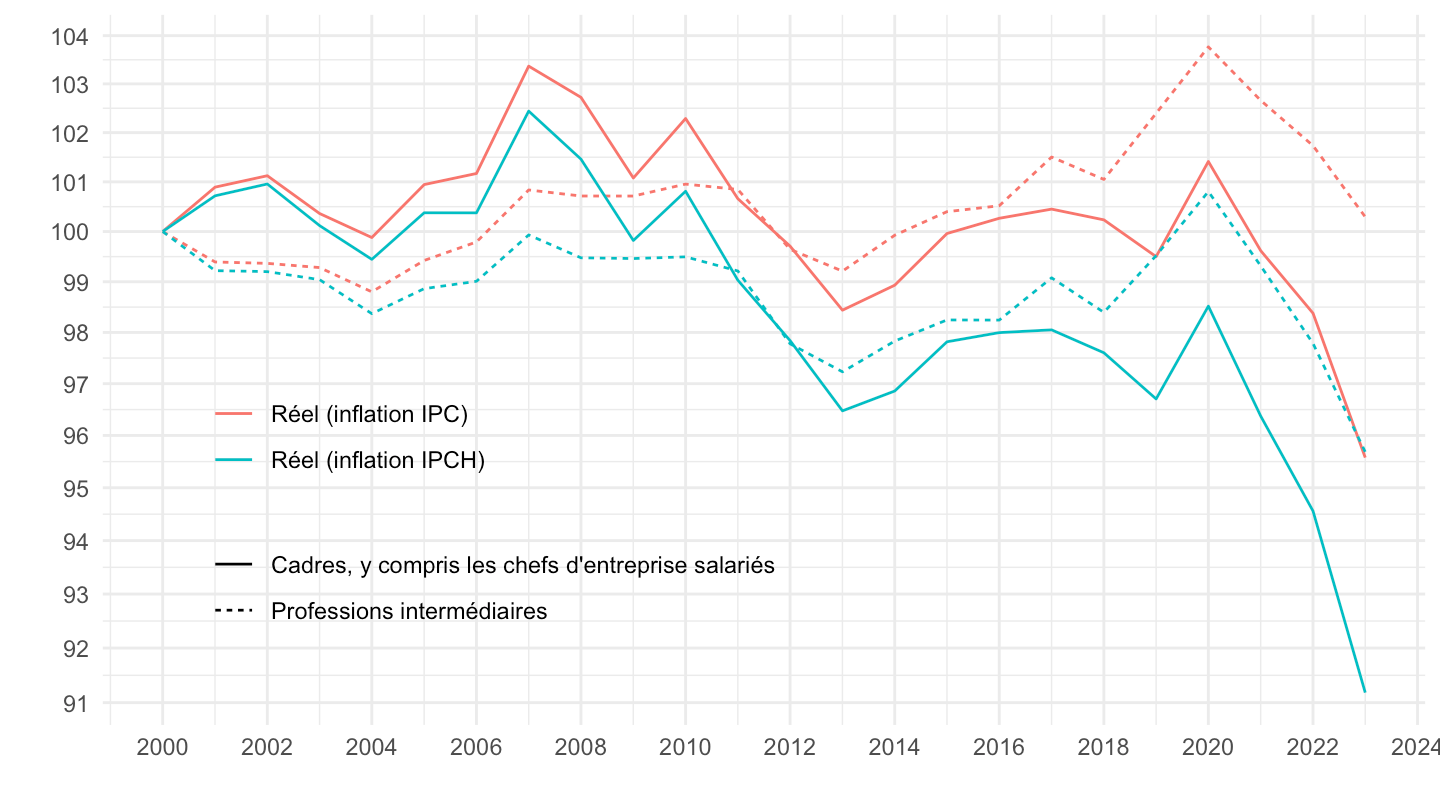
2000-
Code
`SALAIRES-ANNUELS` %>%
  filter(INDICATEUR == "SAL_ANN_MOY",
         SEXE == "0",
         `QUOTITE-TRAV` == "ETPP",
         METIER %in% c("CCE")) %>%
  left_join(METIER, by = "METIER") %>%
  year_to_date %>%
  filter(date >= as.Date("2000-01-01")) %>%
  group_by(Metier) %>%
  mutate(OBS_VALUE = 100*OBS_VALUE/OBS_VALUE[date == as.Date("2000-01-01")]) %>%
  ungroup %>%
  left_join(`inflation-A`, by = "date") %>%
  arrange(date) %>%
  transmute(date, Metier,
            `Réel (inflation IPCH)` = IPCH[1]*OBS_VALUE/IPCH,
            `Réel (inflation IPC)` = IPC[1]*OBS_VALUE/IPC) %>%
  gather(variable, value, -date, -Metier) %>%
  ggplot() + geom_line(aes(x = date, y = value,  color = variable, linetype = Metier)) +
  theme_minimal() + ylab("Base 100 = 2000") + xlab("") +
  #scale_color_manual(values = c("darkgrey", "#F8766D", "#619CFF")) +
  scale_x_date(breaks = seq(1920, 2100, 2) %>% paste0("-01-01") %>% as.Date,
               labels = date_format("%Y")) +
  theme(legend.position = c(0.3, 0.3),
        legend.title = element_blank()) +
  scale_y_log10(breaks = seq(0, 200, 1)) +
  geom_hline(yintercept = 100, linetype = "dashed")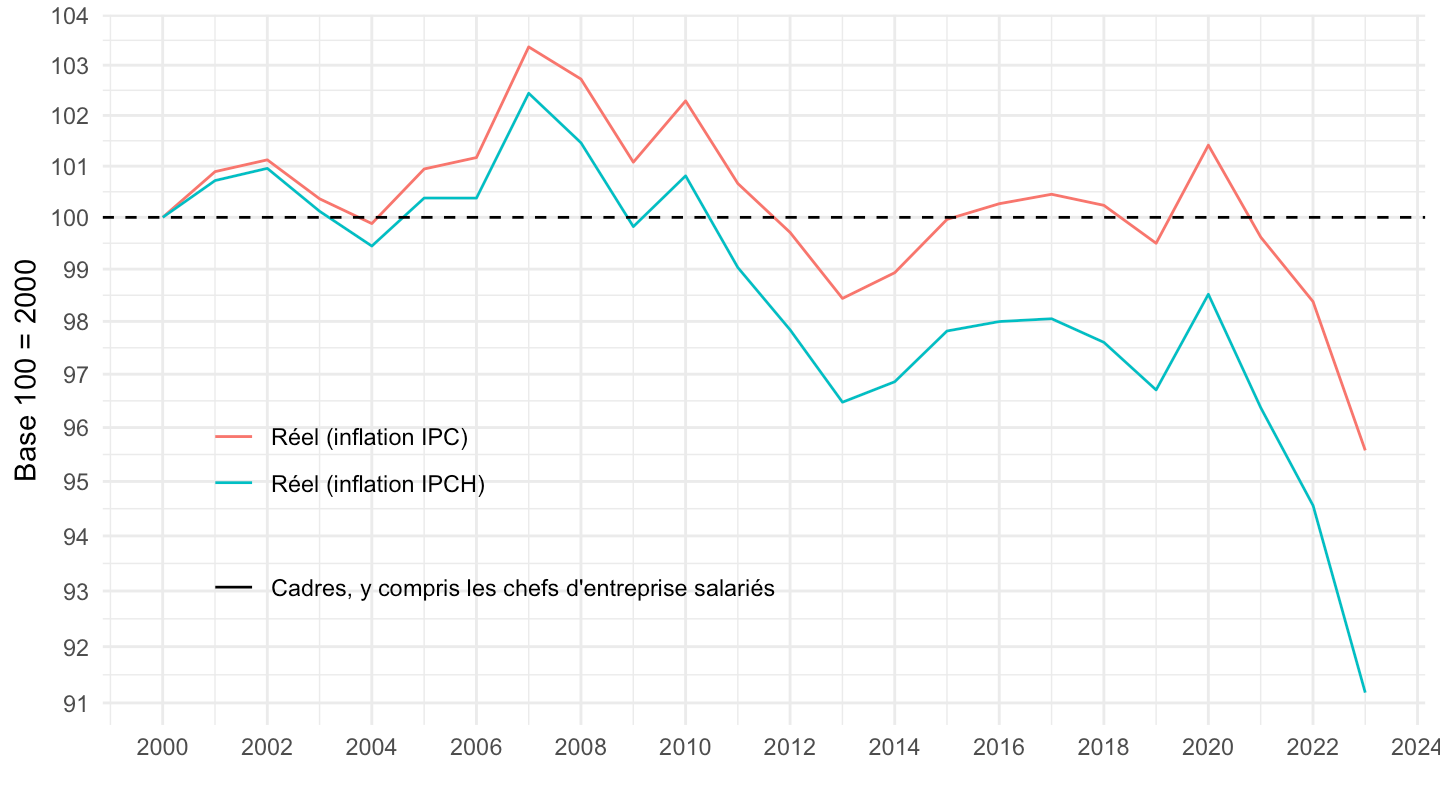
2017-
Code
`SALAIRES-ANNUELS` %>%
  filter(INDICATEUR == "SAL_ANN_MOY",
         SEXE == "0",
         `QUOTITE-TRAV` == "ETPP",
         METIER %in% c("CCE")) %>%
  left_join(METIER, by = "METIER") %>%
  year_to_date %>%
  filter(date >= as.Date("2017-01-01")) %>%
  group_by(Metier) %>%
  mutate(OBS_VALUE = 100*OBS_VALUE/OBS_VALUE[date == as.Date("2017-01-01")]) %>%
  ungroup %>%
  left_join(`inflation-A`, by = "date") %>%
  arrange(date) %>%
  transmute(date, Metier,
            `Réel (inflation IPCH)` = IPCH[1]*OBS_VALUE/IPCH,
            `Réel (inflation IPC)` = IPC[1]*OBS_VALUE/IPC) %>%
  gather(variable, value, -date, -Metier) %>%
  ggplot() + geom_line(aes(x = date, y = value,  color = variable, linetype = Metier)) +
  theme_minimal() + ylab("Base 100 = 2017") + xlab("") +
  #scale_color_manual(values = c("darkgrey", "#F8766D", "#619CFF")) +
  scale_x_date(breaks = seq(1920, 2100, 1) %>% paste0("-01-01") %>% as.Date,
               labels = date_format("%Y")) +
  theme(legend.position = c(0.3, 0.3),
        legend.title = element_blank()) +
  scale_y_log10(breaks = seq(0, 200, 1)) +
  geom_hline(yintercept = 100, linetype = "dashed")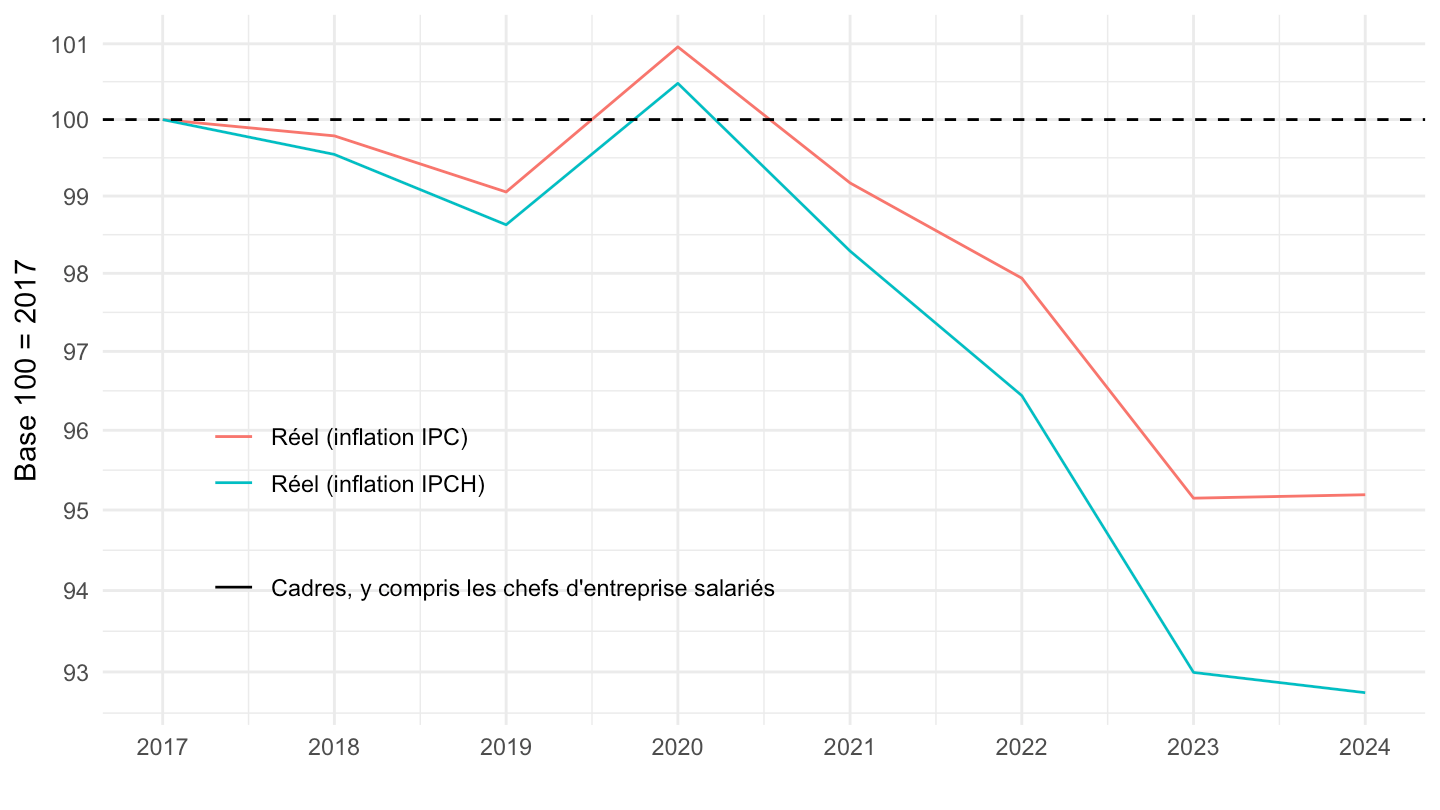
Cadres, Ouvriers, Prof. Intermédiaires, Tous
Indice - Réel
All
Code
`SALAIRES-ANNUELS` %>%
  filter(INDICATEUR == "SAL_ANN_MOY",
         SEXE == "0",
         `QUOTITE-TRAV` == "ETPP",
         METIER %in% c("CCE", "4", "6", "SO")) %>%
  left_join(METIER, by = "METIER") %>%
  year_to_date %>%
  group_by(Metier) %>%
  mutate(OBS_VALUE = 100*OBS_VALUE/OBS_VALUE[date == as.Date("1996-01-01")]) %>%
  ungroup %>%
  left_join(`inflation-A`, by = "date") %>%
  arrange(date) %>%
  transmute(date, Metier,
            `Réel (inflation IPCH)` = IPCH[1]*OBS_VALUE/IPCH,
            `Réel (inflation IPC)` = IPC[1]*OBS_VALUE/IPC) %>%
  gather(variable, value, -date, -Metier) %>%
  ggplot() + geom_line(aes(x = date, y = value,  color = variable, linetype = Metier)) +
  theme_minimal() + ylab("") + xlab("") +
  #scale_color_manual(values = c("darkgrey", "#F8766D", "#619CFF")) +
  scale_x_date(breaks = seq(1920, 2100, 2) %>% paste0("-01-01") %>% as.Date,
               labels = date_format("%Y")) +
  theme(legend.position = c(0.3, 0.8),
        legend.title = element_blank()) +
  scale_y_log10(breaks = seq(0, 200, 1)) +
  geom_hline(yintercept = 100, linetype = "dashed")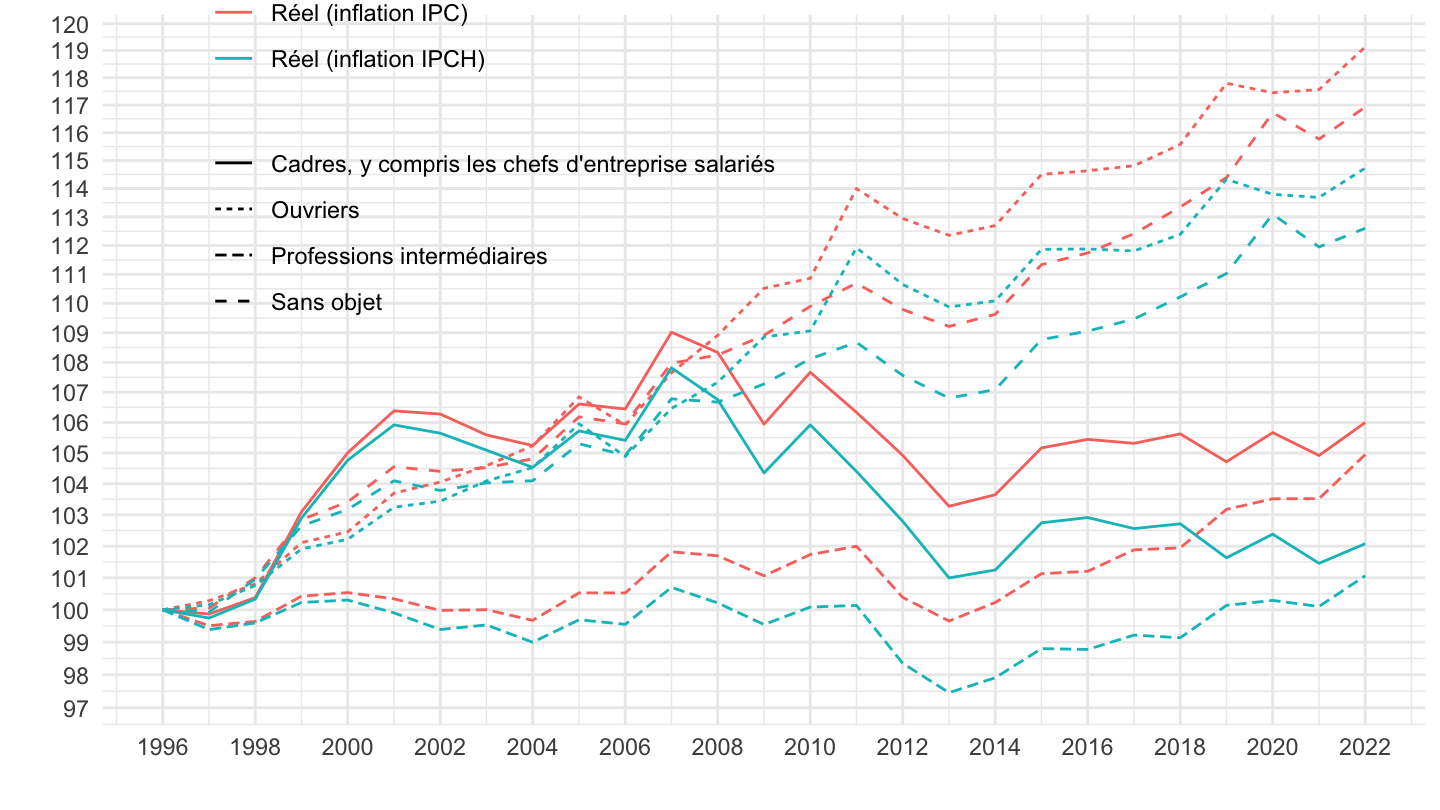
Indice - Réel
All
Code
`SALAIRES-ANNUELS` %>%
  filter(INDICATEUR == "SAL_ANN_MOY",
         SEXE == "0",
         `QUOTITE-TRAV` == "ETPP",
         METIER %in% c("CCE", "4", "6")) %>%
  left_join(METIER, by = "METIER") %>%
  year_to_date %>%
  group_by(Metier) %>%
  mutate(OBS_VALUE = 100*OBS_VALUE/OBS_VALUE[date == as.Date("1996-01-01")]) %>%
  ungroup %>%
  left_join(`inflation-A`, by = "date") %>%
  arrange(date) %>%
  transmute(date, Metier,
            `Réel (inflation IPCH)` = IPCH[1]*OBS_VALUE/IPCH,
            `Réel (inflation IPC)` = IPC[1]*OBS_VALUE/IPC) %>%
  gather(variable, value, -date, -Metier) %>%
  ggplot() + geom_line(aes(x = date, y = value,  color = variable, linetype = Metier)) +
  theme_minimal() + ylab("") + xlab("") +
  #scale_color_manual(values = c("darkgrey", "#F8766D", "#619CFF")) +
  scale_x_date(breaks = seq(1920, 2100, 2) %>% paste0("-01-01") %>% as.Date,
               labels = date_format("%Y")) +
  theme(legend.position = c(0.3, 0.8),
        legend.title = element_blank()) +
  scale_y_log10(breaks = seq(0, 200, 1)) +
  geom_hline(yintercept = 100, linetype = "dashed")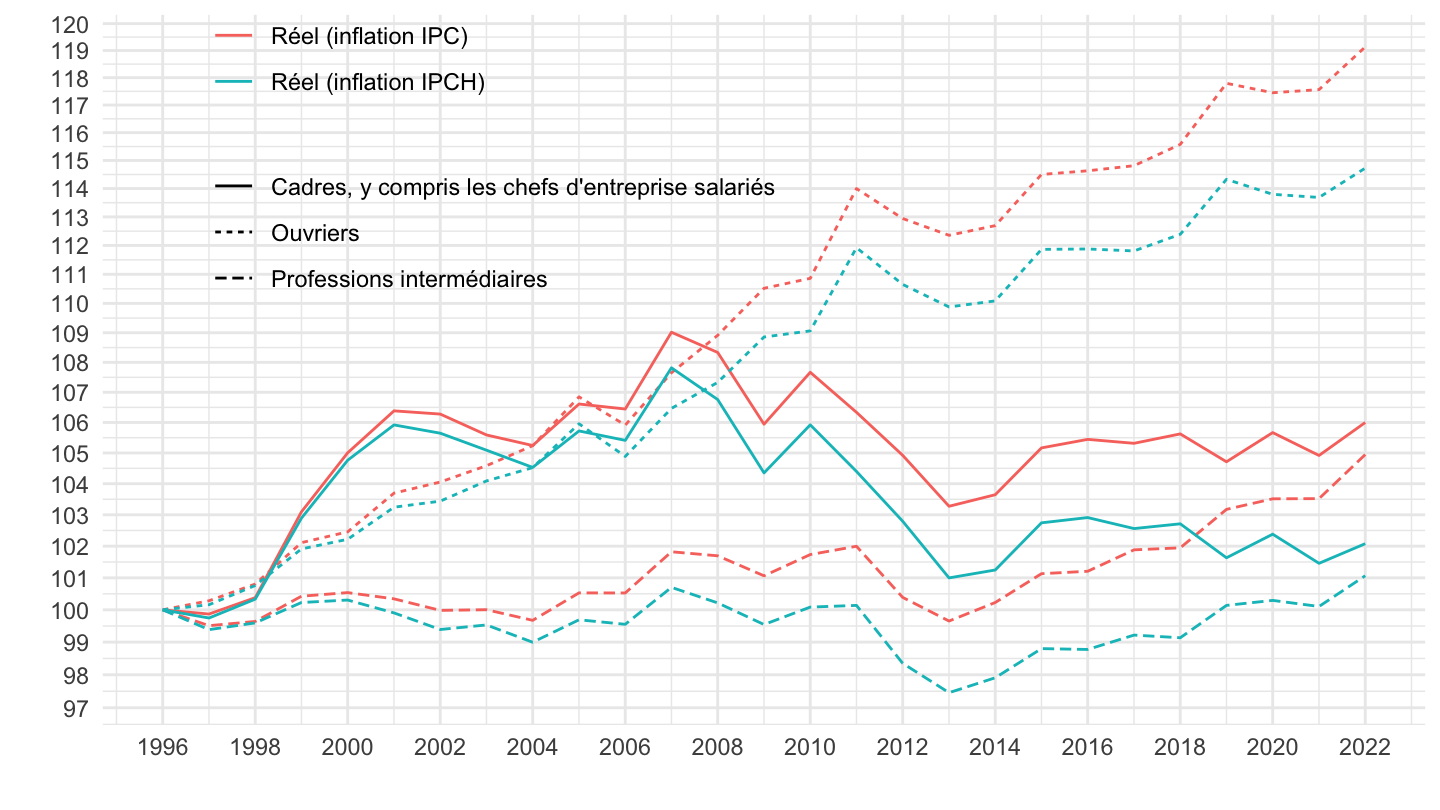
1999-
Code
`SALAIRES-ANNUELS` %>%
  filter(INDICATEUR == "SAL_ANN_MOY",
         SEXE == "0",
         `QUOTITE-TRAV` == "ETPP",
         METIER %in% c("CCE", "4", "6")) %>%
  left_join(METIER, by = "METIER") %>%
  year_to_date %>%
  filter(date >= as.Date("1999-01-01")) %>%
  group_by(Metier) %>%
  mutate(OBS_VALUE = 100*OBS_VALUE/OBS_VALUE[date == as.Date("1999-01-01")]) %>%
  ungroup %>%
  left_join(`inflation-A`, by = "date") %>%
  arrange(date) %>%
  transmute(date, Metier,
            `Réel (inflation IPCH)` = IPCH[1]*OBS_VALUE/IPCH,
            `Réel (inflation IPC)` = IPC[1]*OBS_VALUE/IPC) %>%
  gather(variable, value, -date, -Metier) %>%
  ggplot() + geom_line(aes(x = date, y = value,  color = variable, linetype = Metier)) +
  theme_minimal() + ylab("") + xlab("") +
  #scale_color_manual(values = c("darkgrey", "#F8766D", "#619CFF")) +
  scale_x_date(breaks = seq(1999, 2100, 2) %>% paste0("-01-01") %>% as.Date,
               labels = date_format("%Y")) +
  theme(legend.position = c(0.3, 0.8),
        legend.title = element_blank()) +
  scale_y_log10(breaks = seq(0, 200, 1)) +
  geom_hline(yintercept = 100, linetype = "dashed")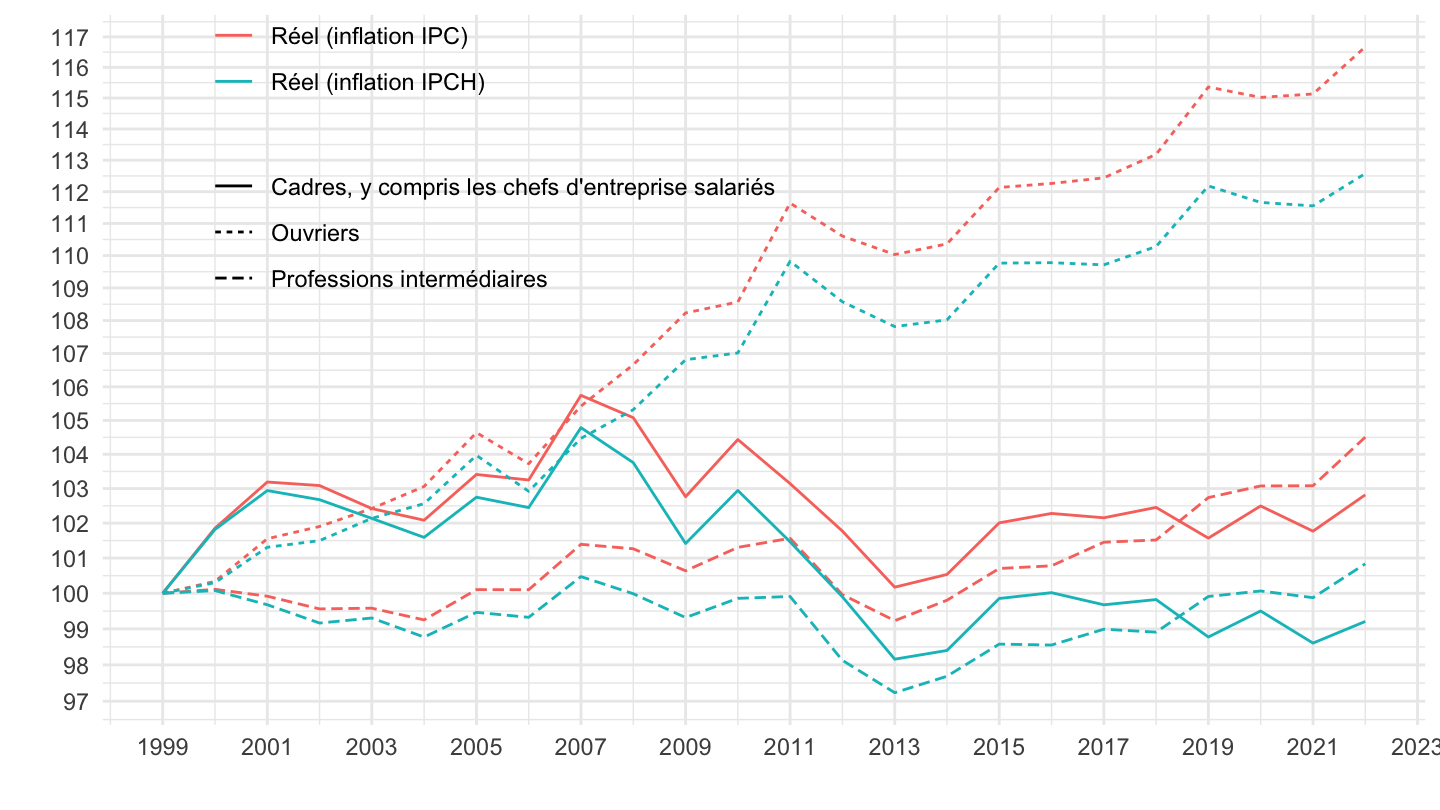
1996-
Code
`SALAIRES-ANNUELS` %>%
  filter(INDICATEUR == "SAL_ANN_MOY",
         SEXE == "0",
         `QUOTITE-TRAV` == "ETPP",
         METIER %in% c("CCE", "4", "6")) %>%
  left_join(METIER, by = "METIER") %>%
  year_to_date %>%
  filter(date >= as.Date("1996-01-01")) %>%
  group_by(Metier) %>%
  mutate(OBS_VALUE = 100*OBS_VALUE/OBS_VALUE[date == as.Date("1996-01-01")]) %>%
  ungroup %>%
  left_join(`inflation-A`, by = "date") %>%
  arrange(date) %>%
  transmute(date, Metier,
            `Salaire déflaté par l'indice IPCH harmonisé par Eurostat` = IPCH[1]*OBS_VALUE/IPCH,
            `Salaire déflaté par l'indice IPC` = IPC[1]*OBS_VALUE/IPC) %>%
  gather(variable, value, -date, -Metier) %>%
  ggplot() + geom_line(aes(x = date, y = value,  linetype = variable, color = Metier)) +
  theme_minimal() + ylab("Pouvoir d'achat du salaire (Indice 100 = 1996)") + xlab("") +
  scale_linetype_manual(values = c("dashed", "solid")) +
  scale_x_date(breaks = seq(1996, 2100, 2) %>% paste0("-01-01") %>% as.Date,
               labels = date_format("%Y")) +
  theme(legend.position = c(0.28, 0.8),
        legend.title = element_blank()) +
  scale_y_log10(breaks = seq(0, 200, 1)) +
  geom_hline(yintercept = 100, linetype = "dashed") +
  geom_label_repel(data = . %>% filter(date == max(date)), aes(x = date, y = value, color = Metier, label = percent(value/100-1, acc = 0.1, style_positive = "plus")))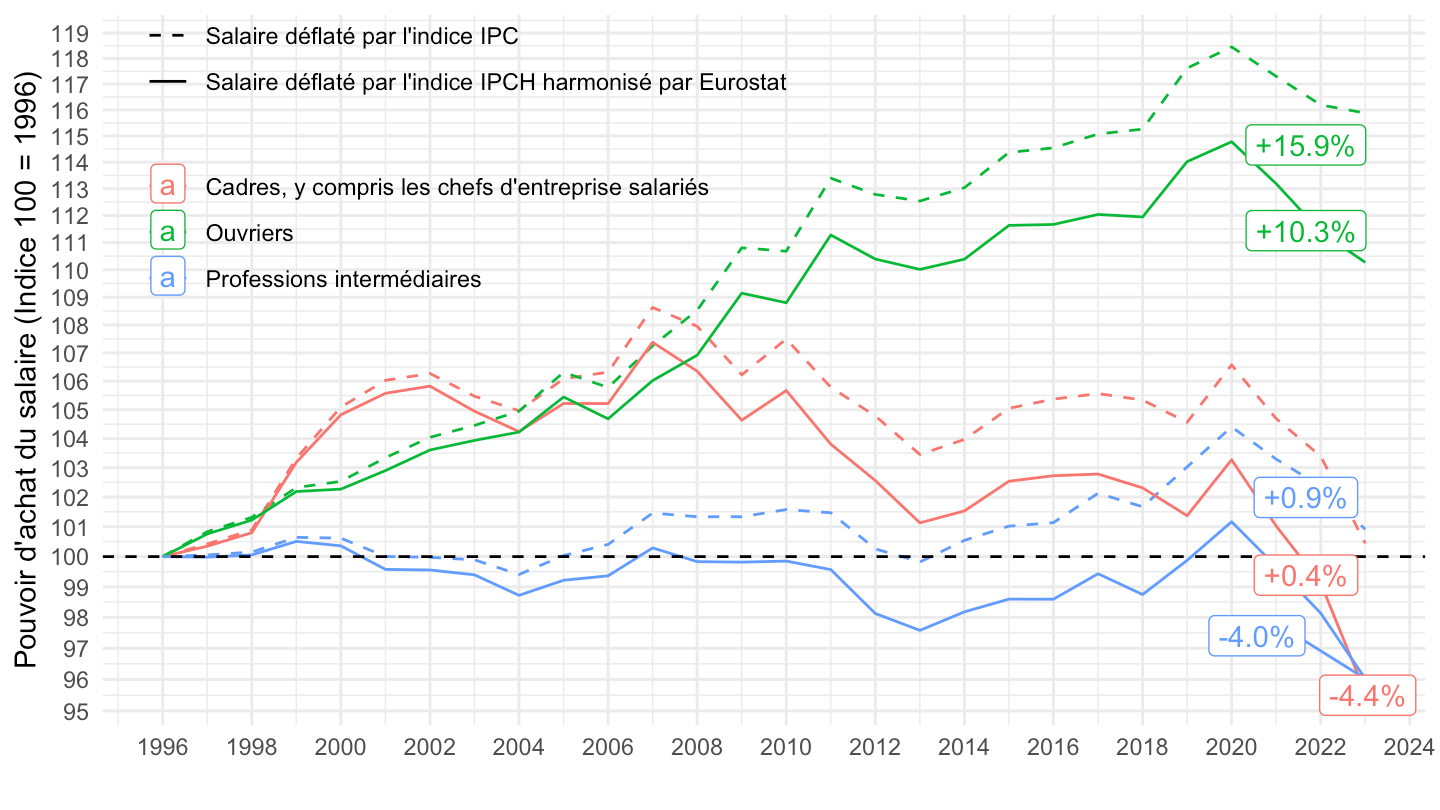
1996-
Code
`SALAIRES-ANNUELS` %>%
  filter(INDICATEUR == "SAL_ANN_MOY",
         SEXE == "0",
         `QUOTITE-TRAV` == "ETPP",
         METIER %in% c("CCE", "4")) %>%
  left_join(METIER, by = "METIER") %>%
  year_to_date %>%
  filter(date >= as.Date("1996-01-01")) %>%
  group_by(Metier) %>%
  mutate(OBS_VALUE = 100*OBS_VALUE/OBS_VALUE[date == as.Date("1996-01-01")]) %>%
  ungroup %>%
  left_join(`inflation-A`, by = "date") %>%
  arrange(date) %>%
  transmute(date, Metier,
            `Salaire déflaté par l'indice IPCH harmonisé par Eurostat` = IPCH[1]*OBS_VALUE/IPCH,
            `Salaire déflaté par l'indice IPC` = IPC[1]*OBS_VALUE/IPC) %>%
  gather(variable, value, -date, -Metier) %>%
  ggplot() + geom_line(aes(x = date, y = value,  linetype = variable, color = Metier)) +
  theme_minimal() + ylab("Pouvoir d'achat du salaire (Indice 100 = 1996)") + xlab("") +
  scale_linetype_manual(values = c("dashed", "solid")) +
  scale_x_date(breaks = seq(1996, 2100, 2) %>% paste0("-01-01") %>% as.Date,
               labels = date_format("%Y")) +
  theme(legend.position = c(0.28, 0.8),
        legend.title = element_blank()) +
  scale_y_log10(breaks = seq(0, 200, 1)) +
  geom_hline(yintercept = 100, linetype = "dashed") +
  geom_label_repel(data = . %>% filter(date == max(date)), aes(x = date, y = value, color = Metier, label = percent(value/100-1, acc = 0.1, style_positive = "plus")))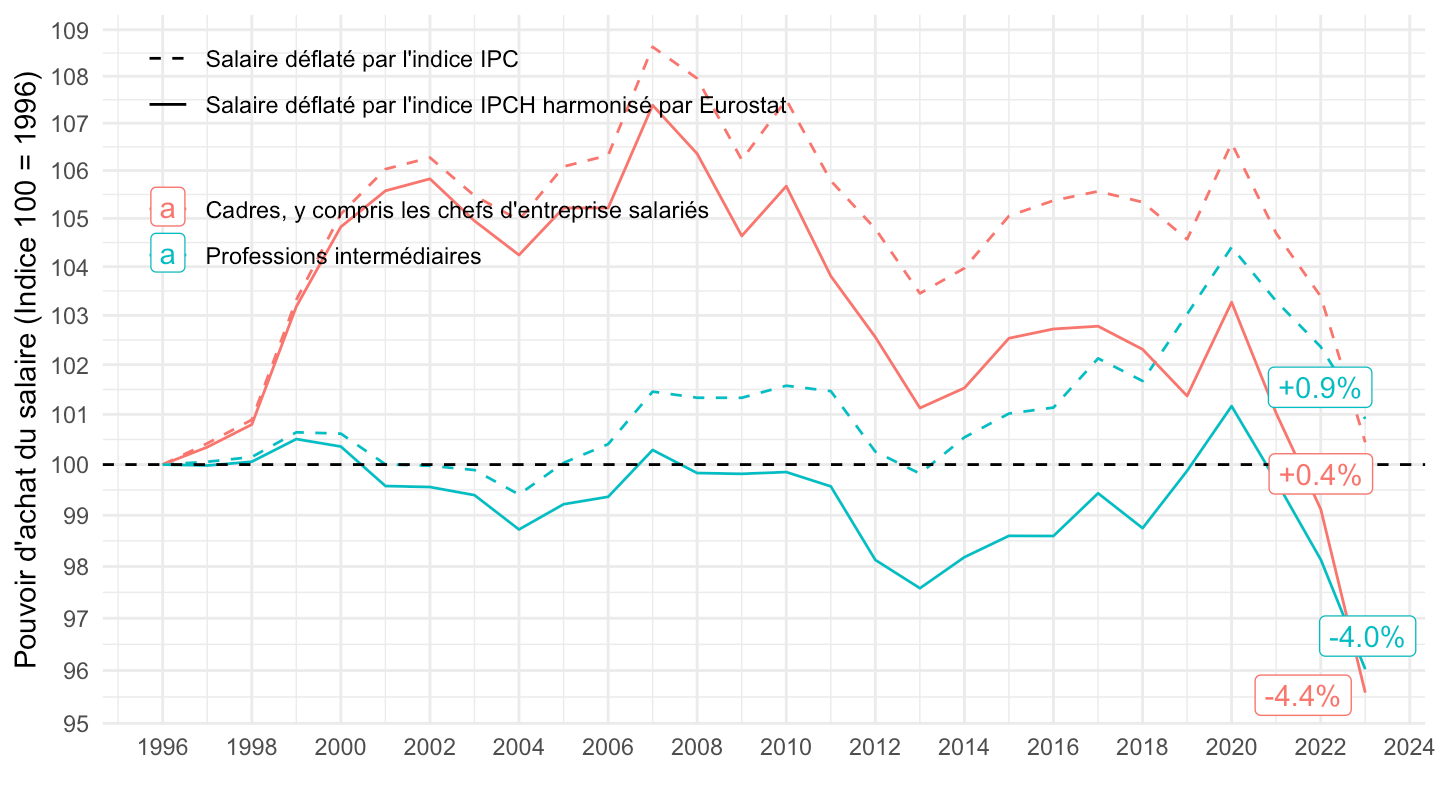
1998-
Code
`SALAIRES-ANNUELS` %>%
  filter(INDICATEUR == "SAL_ANN_MOY",
         SEXE == "0",
         `QUOTITE-TRAV` == "ETPP",
         METIER %in% c("CCE", "4", "6")) %>%
  left_join(METIER, by = "METIER") %>%
  year_to_date %>%
  filter(date >= as.Date("1998-01-01")) %>%
  group_by(Metier) %>%
  mutate(OBS_VALUE = 100*OBS_VALUE/OBS_VALUE[date == as.Date("1998-01-01")]) %>%
  ungroup %>%
  left_join(`inflation-A`, by = "date") %>%
  arrange(date) %>%
  transmute(date, Metier,
            `Salaire déflaté par l'indice IPCH harmonisé par Eurostat` = IPCH[1]*OBS_VALUE/IPCH,
            `Salaire déflaté par l'indice IPC` = IPC[1]*OBS_VALUE/IPC) %>%
  gather(variable, value, -date, -Metier) %>%
  ggplot() + geom_line(aes(x = date, y = value,  linetype = variable, color = Metier)) +
  theme_minimal() + ylab("Pouvoir d'achat du salaire (Indice 100 = 1998)") + xlab("") +
  scale_linetype_manual(values = c("dashed", "solid")) +
  scale_x_date(breaks = seq(1998, 2100, 5) %>% paste0("-01-01") %>% as.Date,
               labels = date_format("%Y")) +
  theme(legend.position = c(0.28, 0.8),
        legend.title = element_blank()) +
  scale_y_log10(breaks = seq(0, 200, 1)) +
  geom_hline(yintercept = 100, linetype = "dashed") +
  geom_label(data = . %>% filter(date == max(date)), aes(x = date, y = value, color = Metier, label = percent(value/100-1, style_positive = "plus")))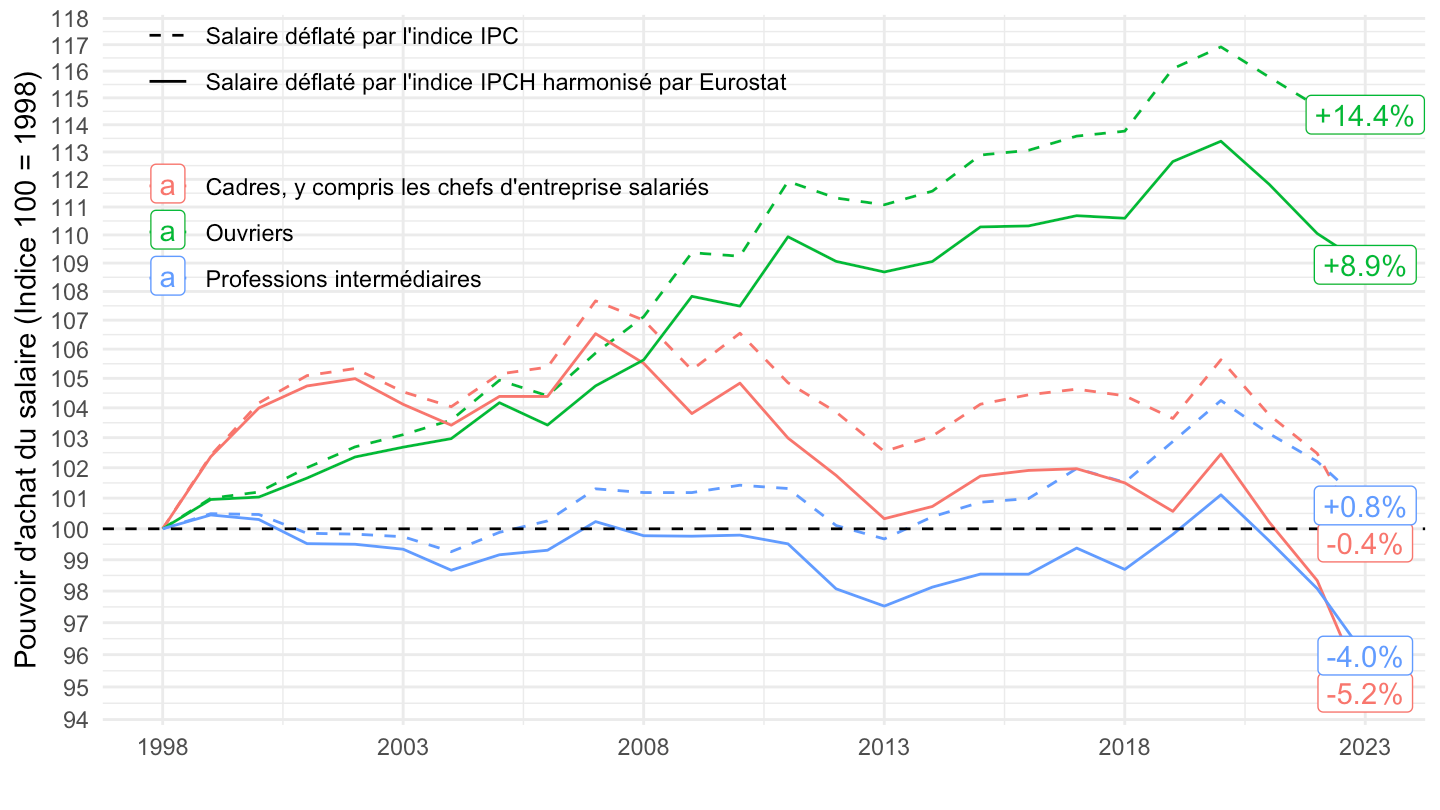
2000-
Code
`SALAIRES-ANNUELS` %>%
  filter(INDICATEUR == "SAL_ANN_MOY",
         SEXE == "0",
         `QUOTITE-TRAV` == "ETPP",
         METIER %in% c("CCE", "4", "6")) %>%
  left_join(METIER, by = "METIER") %>%
  year_to_date %>%
  filter(date >= as.Date("1999-01-01")) %>%
  group_by(Metier) %>%
  mutate(OBS_VALUE = 100*OBS_VALUE/OBS_VALUE[date == as.Date("1999-01-01")]) %>%
  ungroup %>%
  left_join(`inflation-A`, by = "date") %>%
  arrange(date) %>%
  transmute(date, Metier,
            `Réel (inflation IPCH)` = IPCH[1]*OBS_VALUE/IPCH,
            `Réel (inflation IPC)` = IPC[1]*OBS_VALUE/IPC) %>%
  gather(variable, value, -date, -Metier) %>%
  ggplot() + geom_line(aes(x = date, y = value,  linetype = variable, color = Metier)) +
  theme_minimal() + ylab("Pouvoir d'achat du salaire") + xlab("") +
  scale_linetype_manual(values = c("dashed", "solid")) +
  scale_x_date(breaks = seq(1999, 2100, 2) %>% paste0("-01-01") %>% as.Date,
               labels = date_format("%Y")) +
  theme(legend.position = c(0.3, 0.8),
        legend.title = element_blank()) +
  scale_y_log10(breaks = seq(0, 200, 1)) +
  geom_hline(yintercept = 100, linetype = "dashed")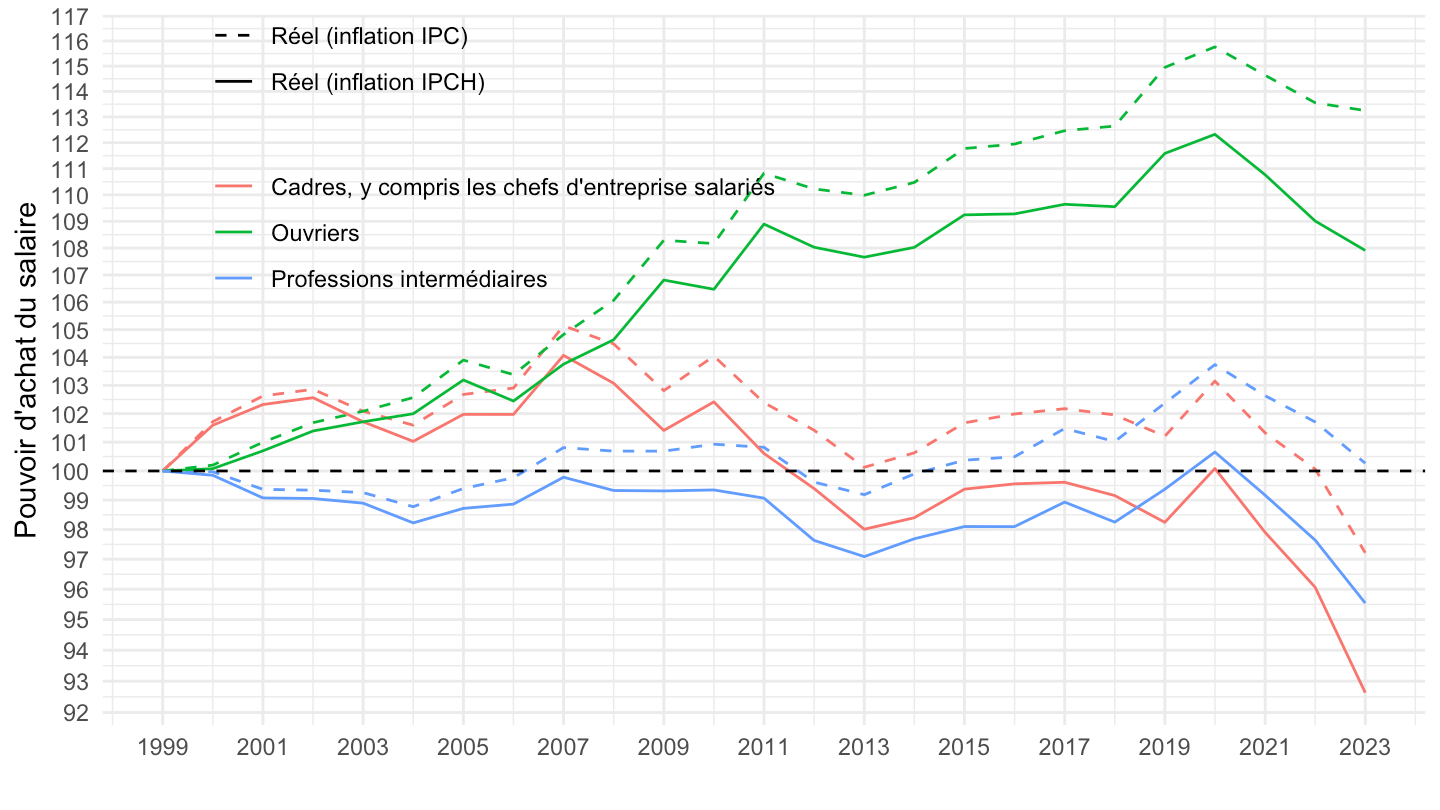
2007-
Code
`SALAIRES-ANNUELS` %>%
  filter(INDICATEUR == "SAL_ANN_MOY",
         SEXE == "0",
         `QUOTITE-TRAV` == "ETPP",
         METIER %in% c("CCE", "4", "6")) %>%
  left_join(METIER, by = "METIER") %>%
  year_to_date %>%
  filter(date >= as.Date("2007-01-01")) %>%
  group_by(Metier) %>%
  mutate(OBS_VALUE = 100*OBS_VALUE/OBS_VALUE[date == as.Date("2007-01-01")]) %>%
  ungroup %>%
  left_join(`inflation-A`, by = "date") %>%
  arrange(date) %>%
  transmute(date, Metier,
            `Réel (inflation IPCH)` = IPCH[1]*OBS_VALUE/IPCH,
            `Réel (inflation IPC)` = IPC[1]*OBS_VALUE/IPC) %>%
  gather(variable, value, -date, -Metier) %>%
  ggplot() + geom_line(aes(x = date, y = value,  color = variable, linetype = Metier)) +
  theme_minimal() + ylab("") + xlab("") +
  #scale_color_manual(values = c("darkgrey", "#F8766D", "#619CFF")) +
  scale_x_date(breaks = seq(1999, 2100, 1) %>% paste0("-01-01") %>% as.Date,
               labels = date_format("%Y")) +
  theme(legend.position = c(0.3, 0.8),
        legend.title = element_blank()) +
  scale_y_log10(breaks = seq(0, 200, 1)) +
  geom_hline(yintercept = 100, linetype = "dashed")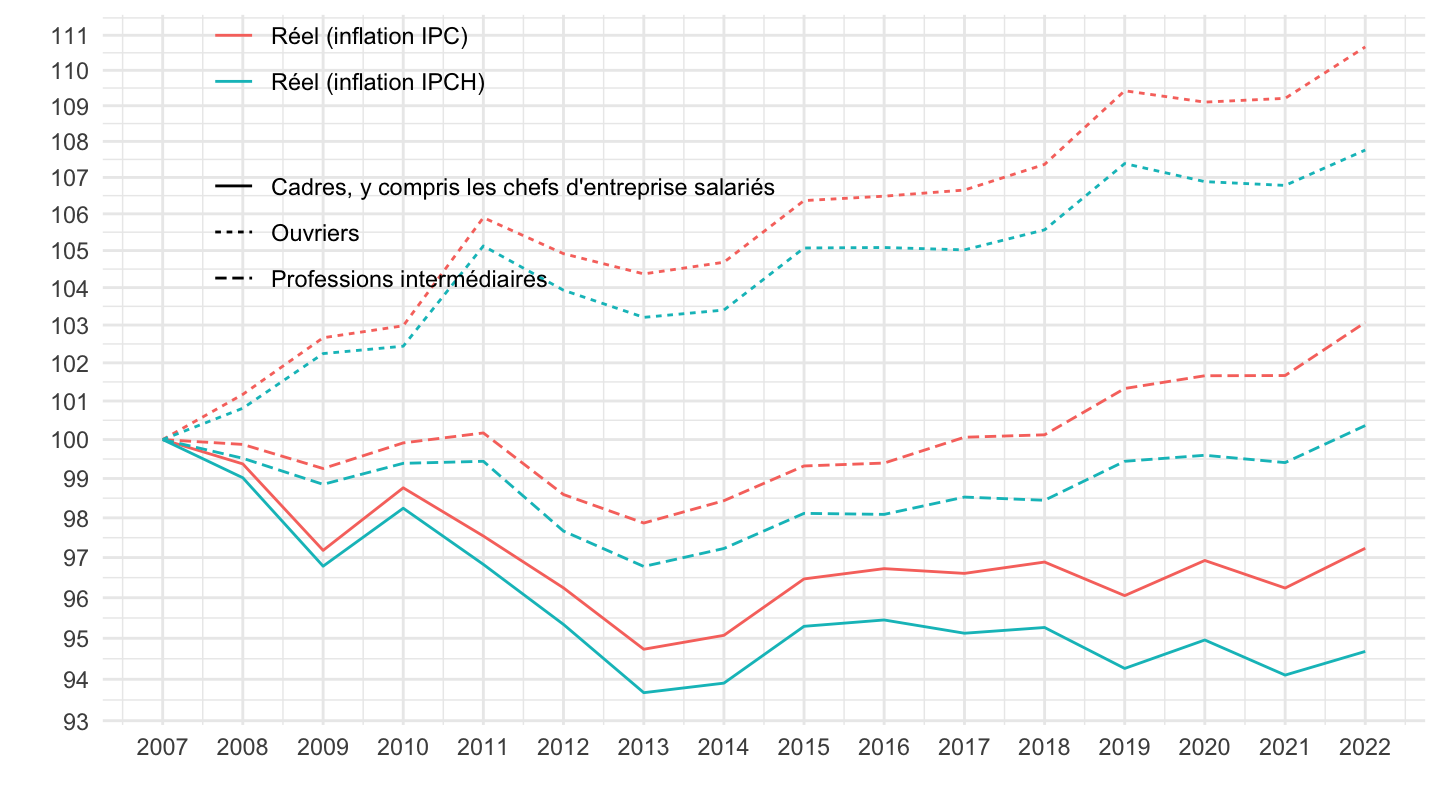
2017-
Code
`SALAIRES-ANNUELS` %>%
  filter(INDICATEUR == "SAL_ANN_MOY",
         SEXE == "0",
         `QUOTITE-TRAV` == "ETPP",
         METIER %in% c("CCE", "4", "6")) %>%
  left_join(METIER, by = "METIER") %>%
  year_to_date %>%
  filter(date >= as.Date("2017-01-01")) %>%
  group_by(Metier) %>%
  mutate(OBS_VALUE = 100*OBS_VALUE/OBS_VALUE[date == as.Date("2017-01-01")]) %>%
  ungroup %>%
  left_join(`inflation-A`, by = "date") %>%
  arrange(date) %>%
  transmute(date, Metier,
            `Réel (inflation IPCH)` = IPCH[1]*OBS_VALUE/IPCH,
            `Réel (inflation IPC)` = IPC[1]*OBS_VALUE/IPC) %>%
  gather(variable, value, -date, -Metier) %>%
  ggplot() + geom_line(aes(x = date, y = value,  color = variable, linetype = Metier)) +
  theme_minimal() + ylab("") + xlab("") +
  #scale_color_manual(values = c("darkgrey", "#F8766D", "#619CFF")) +
  scale_x_date(breaks = seq(1999, 2100, 1) %>% paste0("-01-01") %>% as.Date,
               labels = date_format("%Y")) +
  theme(legend.position = c(0.3, 0.3),
        legend.title = element_blank()) +
  scale_y_log10(breaks = seq(0, 200, 1)) +
  geom_hline(yintercept = 100, linetype = "dashed")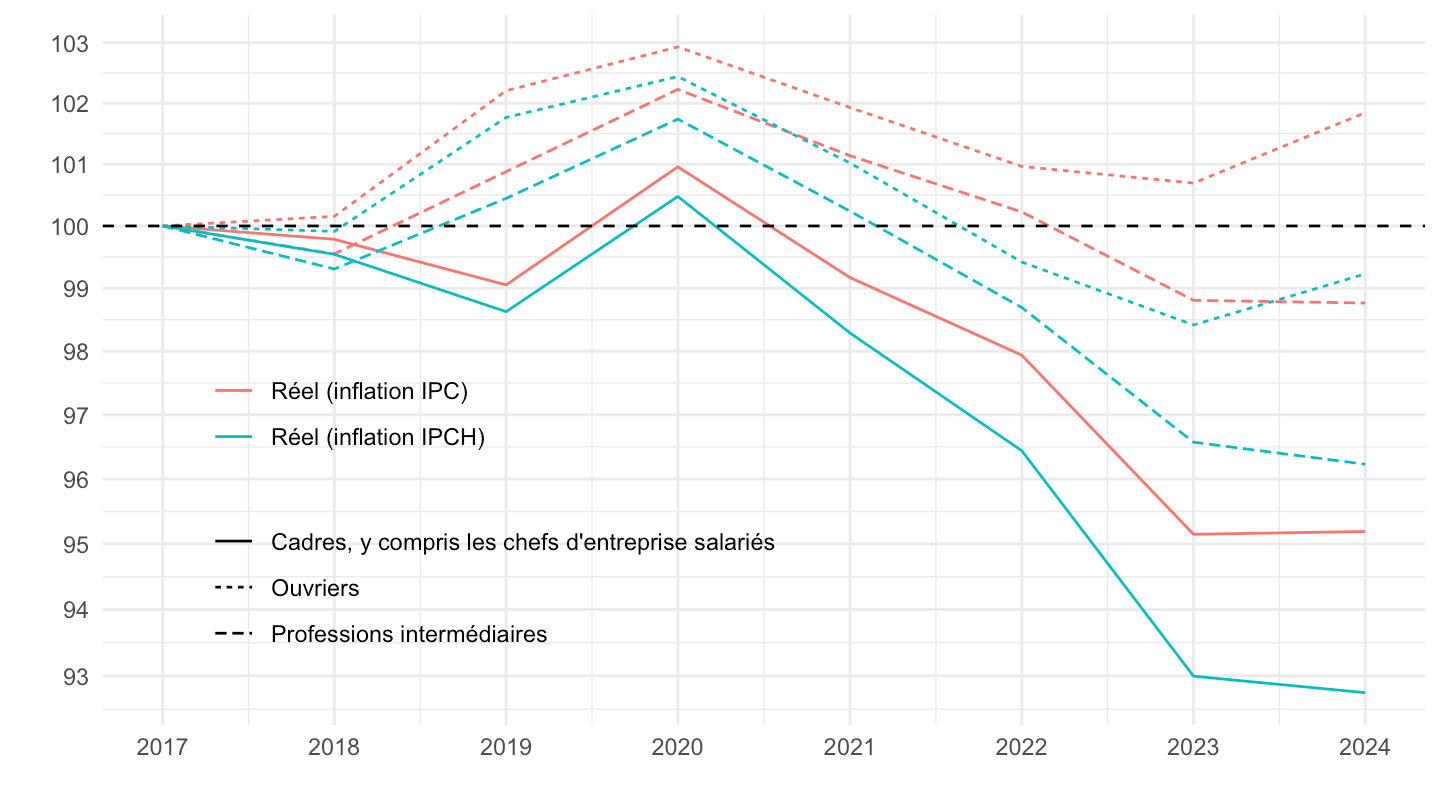
Médiane, 9ème décile, 1er décile
Values
Code
`SALAIRES-ANNUELS` %>%
  filter(INDICATEUR %in% c("SAL_ANN_D1", "SAL_ANN_D5", "SAL_ANN_D9"),
         SEXE == "0",
         `QUOTITE-TRAV` == "ETPP") %>%
  left_join(INDICATEUR, by = "INDICATEUR") %>%
  year_to_date %>%
  ggplot(.) + theme_minimal() + ylab("") + xlab("") +
  geom_line(aes(x = date, y = OBS_VALUE/1000, color = Indicateur)) +
  theme(legend.title = element_blank(),
        legend.position = c(0.7, 0.7)) +
  scale_x_date(breaks = seq(1950, 2100, 2) %>% paste0("-01-01") %>% as.Date,
               labels = date_format("%Y")) +
  scale_y_log10(breaks = seq(0, 200, 5),
                     labels = scales::dollar_format(accuracy = 1, suffix = " k€", prefix = ""))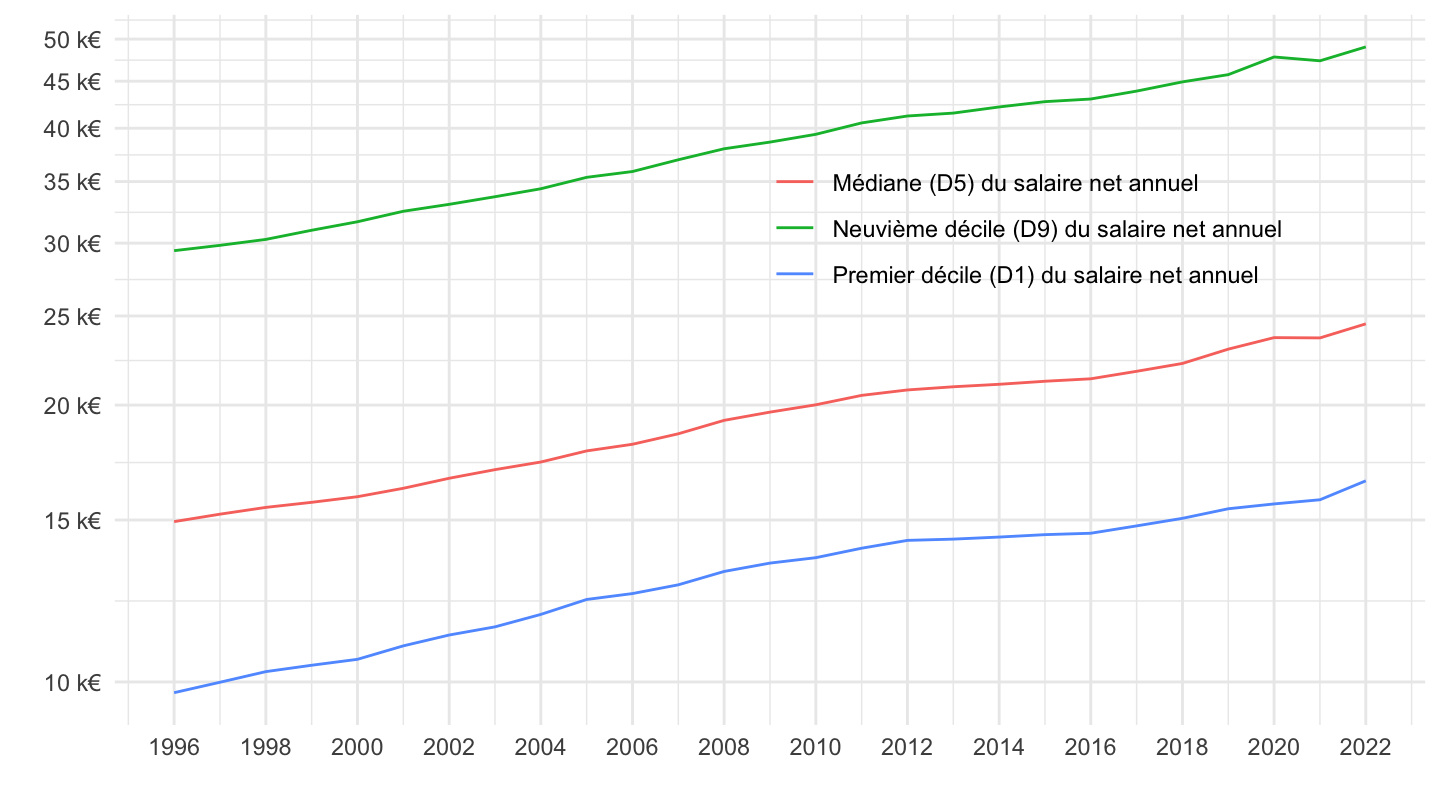
Indice
1996-
Code
`SALAIRES-ANNUELS` %>%
  filter(INDICATEUR %in% c("SAL_ANN_D1", "SAL_ANN_D5", "SAL_ANN_D9"),
         SEXE == "0",
         `QUOTITE-TRAV` == "ETPP") %>%
  left_join(INDICATEUR, by = "INDICATEUR") %>%
  year_to_date %>%
  group_by(Indicateur) %>%
  mutate(OBS_VALUE = 100*OBS_VALUE/OBS_VALUE[date == as.Date("1996-01-01")]) %>%
  ggplot(.) + theme_minimal() + ylab("") + xlab("") +
  geom_line(aes(x = date, y = OBS_VALUE, color = Indicateur)) +
  theme(legend.title = element_blank(),
        legend.position = c(0.3, 0.8)) +
  scale_x_date(breaks = seq(1950, 2100, 2) %>% paste0("-01-01") %>% as.Date,
               labels = date_format("%Y")) +
  scale_y_log10(breaks = seq(100, 200, 5))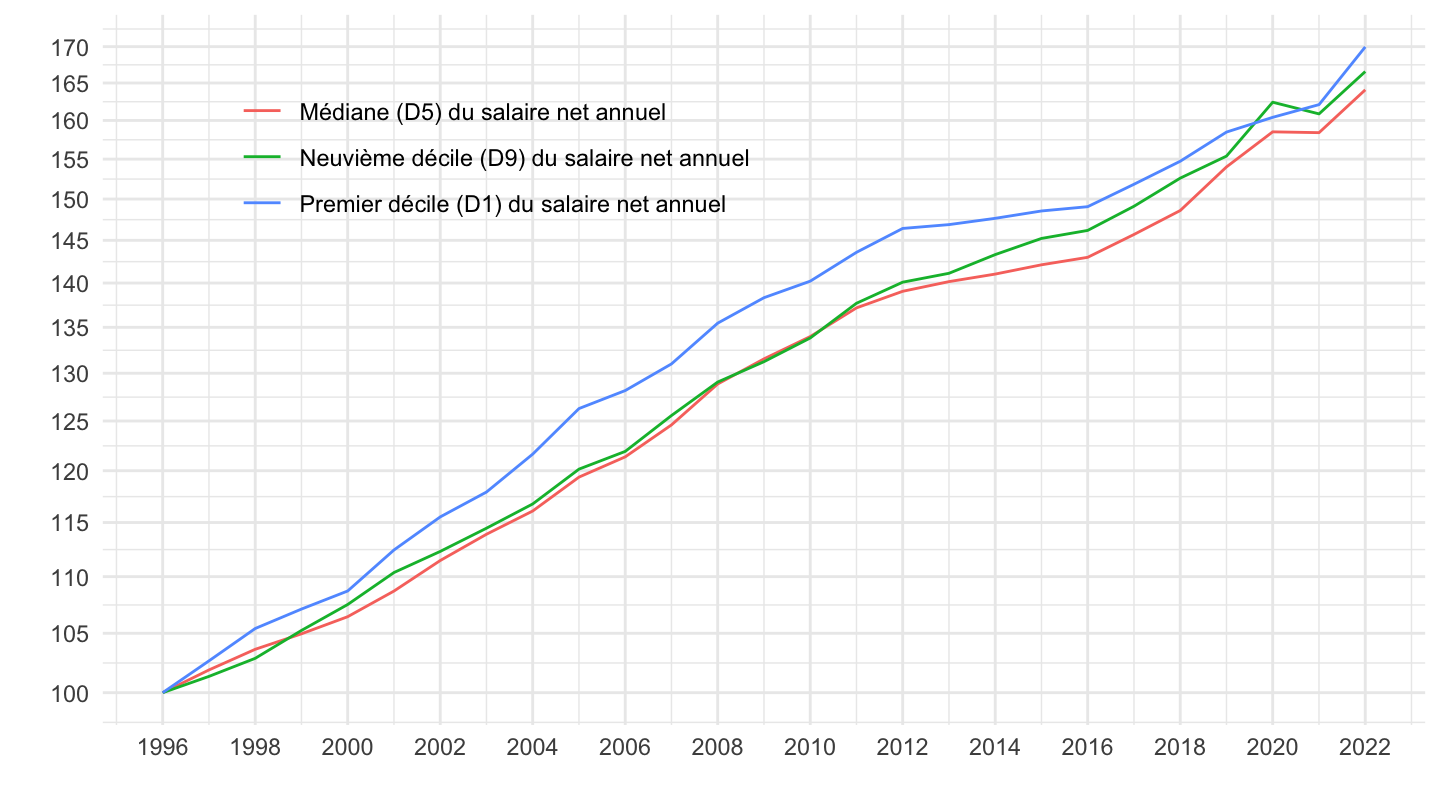
2002-
Code
`SALAIRES-ANNUELS` %>%
  filter(INDICATEUR %in% c("SAL_ANN_D1", "SAL_ANN_D5", "SAL_ANN_D9"),
         SEXE == "0",
         `QUOTITE-TRAV` == "ETPP") %>%
  left_join(INDICATEUR, by = "INDICATEUR") %>%
  year_to_date %>%
  filter(date >= as.Date("2002-01-01")) %>%
  group_by(Indicateur) %>%
  mutate(OBS_VALUE = 100*OBS_VALUE/OBS_VALUE[date == as.Date("2002-01-01")]) %>%
  ggplot(.) + theme_minimal() + ylab("") + xlab("") +
  geom_line(aes(x = date, y = OBS_VALUE, color = Indicateur)) +
  theme(legend.title = element_blank(),
        legend.position = c(0.3, 0.8)) +
  scale_x_date(breaks = seq(1950, 2100, 2) %>% paste0("-01-01") %>% as.Date,
               labels = date_format("%Y")) +
  scale_y_log10(breaks = seq(100, 200, 5))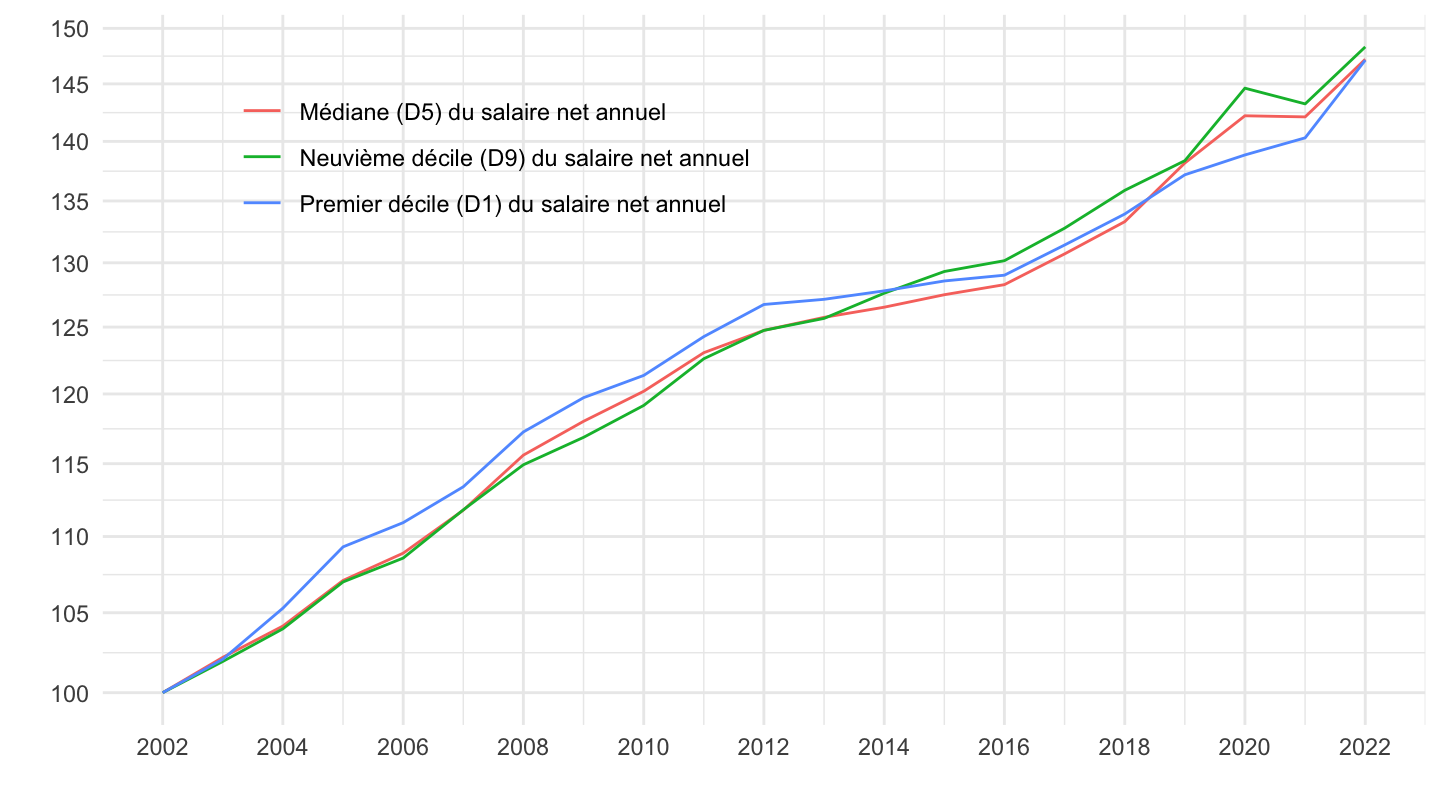
2017-
Code
`SALAIRES-ANNUELS` %>%
  filter(INDICATEUR %in% c("SAL_ANN_D1", "SAL_ANN_D5", "SAL_ANN_D9"),
         SEXE == "0",
         `QUOTITE-TRAV` == "ETPP") %>%
  left_join(INDICATEUR, by = "INDICATEUR") %>%
  year_to_date %>%
  filter(date >= as.Date("2017-01-01")) %>%
  group_by(Indicateur) %>%
  mutate(OBS_VALUE = 100*OBS_VALUE/OBS_VALUE[date == as.Date("2017-01-01")]) %>%
  ggplot(.) + theme_minimal() + ylab("") + xlab("") +
  geom_line(aes(x = date, y = OBS_VALUE, color = Indicateur)) +
  theme(legend.title = element_blank(),
        legend.position = c(0.3, 0.8)) +
  scale_x_date(breaks = seq(1950, 2100, 1) %>% paste0("-01-01") %>% as.Date,
               labels = date_format("%Y")) +
  scale_y_log10(breaks = seq(100, 200, 5))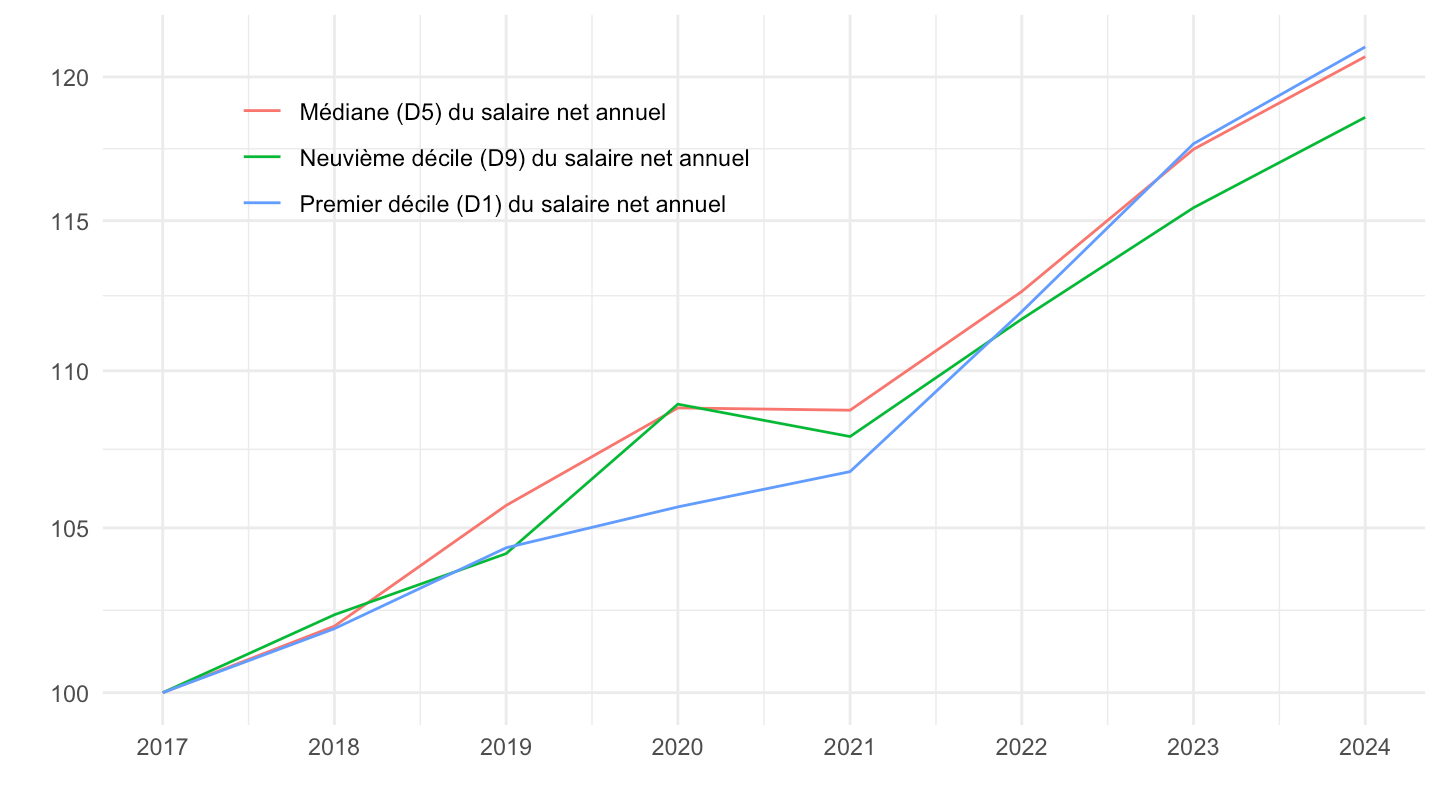
Médiane, 1er quartile, 3ème quartile
Values
Code
`SALAIRES-ANNUELS` %>%
  filter(INDICATEUR %in% c("SAL_ANN_Q1", "SAL_ANN_D5", "SAL_ANN_Q3"),
         SEXE == "0",
         `QUOTITE-TRAV` == "ETPP") %>%
  left_join(INDICATEUR, by = "INDICATEUR") %>%
  year_to_date %>%
  ggplot(.) + theme_minimal() + ylab("") + xlab("") +
  geom_line(aes(x = date, y = OBS_VALUE/1000, color = Indicateur)) +
  theme(legend.title = element_blank(),
        legend.position = c(0.7, 0.7)) +
  scale_x_date(breaks = seq(1950, 2100, 2) %>% paste0("-01-01") %>% as.Date,
               labels = date_format("%Y")) +
  scale_y_log10(breaks = seq(0, 200, 5),
                     labels = scales::dollar_format(accuracy = 1, suffix = " k€", prefix = ""))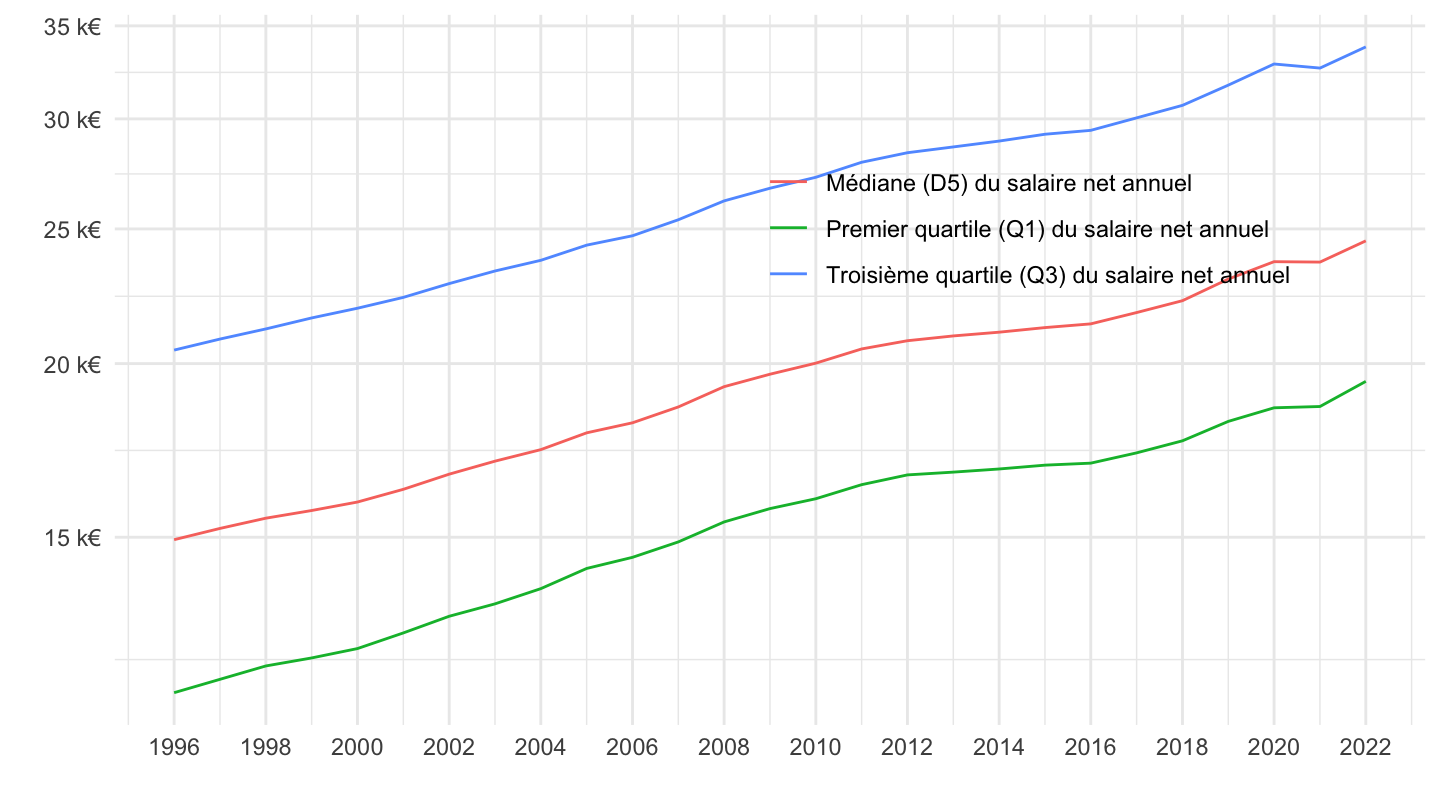
Indice
Code
`SALAIRES-ANNUELS` %>%
  filter(INDICATEUR %in% c("SAL_ANN_Q1", "SAL_ANN_D5", "SAL_ANN_Q3"),
         SEXE == "0",
         `QUOTITE-TRAV` == "ETPP") %>%
  left_join(INDICATEUR, by = "INDICATEUR") %>%
  year_to_date %>%
  group_by(Indicateur) %>%
  mutate(OBS_VALUE = 100*OBS_VALUE/OBS_VALUE[date == as.Date("1996-01-01")]) %>%
  ggplot(.) + theme_minimal() + ylab("") + xlab("") +
  geom_line(aes(x = date, y = OBS_VALUE, color = Indicateur)) +
  theme(legend.title = element_blank(),
        legend.position = c(0.3, 0.8)) +
  scale_x_date(breaks = seq(1950, 2100, 2) %>% paste0("-01-01") %>% as.Date,
               labels = date_format("%Y")) +
  scale_y_log10(breaks = seq(100, 200, 5))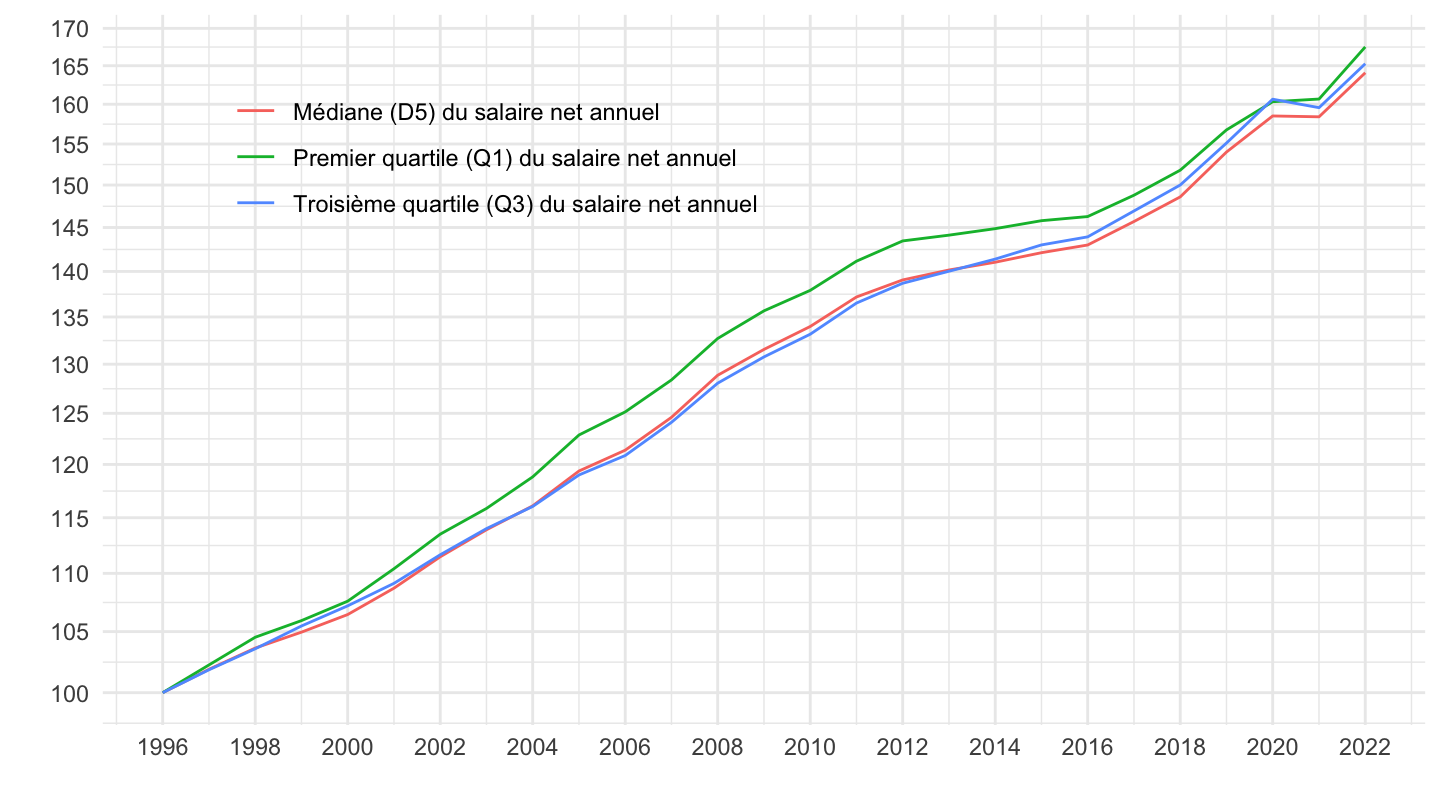
Médiane, 9ème décile, 1er décile, 95ème centile, 99ème centile
Values - Log
Code
`SALAIRES-ANNUELS` %>%
  filter(INDICATEUR %in% c("SAL_ANN_D1", "SAL_ANN_D5", "SAL_ANN_D9", "SAL_ANN_C95", "SAL_ANN_C99"),
         SEXE == "0",
         `QUOTITE-TRAV` == "ETPP") %>%
  left_join(INDICATEUR, by = "INDICATEUR") %>%
  year_to_date %>%
  ggplot(.) + theme_minimal() + ylab("") + xlab("") +
  geom_line(aes(x = date, y = OBS_VALUE/1000, color = Indicateur)) +
  theme(legend.title = element_blank(),
        legend.position = c(0.7, 0.7)) +
  scale_x_date(breaks = seq(1950, 2100, 2) %>% paste0("-01-01") %>% as.Date,
               labels = date_format("%Y")) +
  scale_y_log10(breaks = seq(0, 200, 5),
                     labels = scales::dollar_format(accuracy = 1, suffix = " k€", prefix = ""))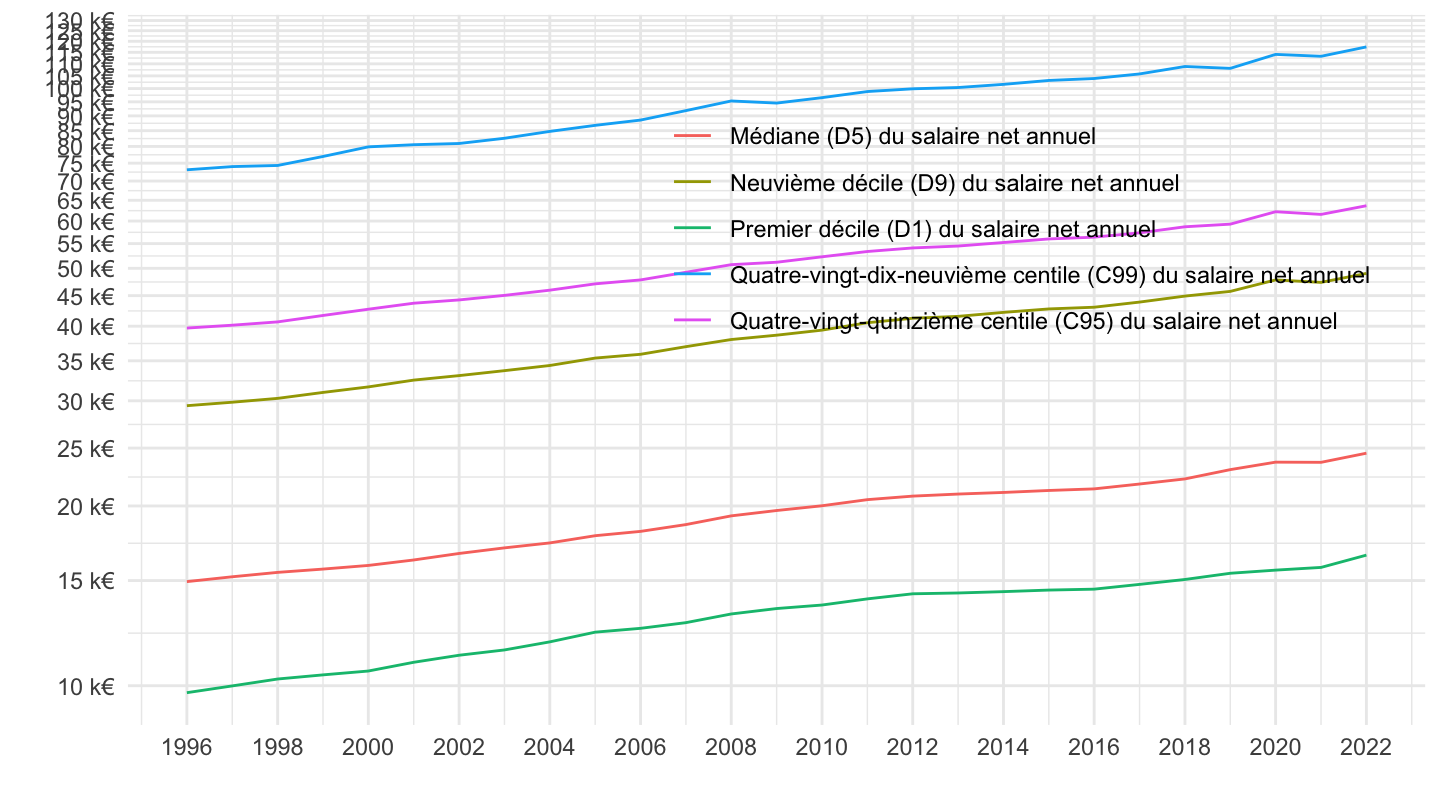
Values - Linear
Code
`SALAIRES-ANNUELS` %>%
  filter(INDICATEUR %in% c("SAL_ANN_D1", "SAL_ANN_D5", "SAL_ANN_D9", "SAL_ANN_C95", "SAL_ANN_C99"),
         SEXE == "0",
         `QUOTITE-TRAV` == "ETPP") %>%
  left_join(INDICATEUR, by = "INDICATEUR") %>%
  year_to_date %>%
  ggplot(.) + theme_minimal() + ylab("") + xlab("") +
  geom_line(aes(x = date, y = OBS_VALUE/1000, color = Indicateur)) +
  theme(legend.title = element_blank(),
        legend.position = c(0.7, 0.7)) +
  scale_x_date(breaks = seq(1950, 2100, 2) %>% paste0("-01-01") %>% as.Date,
               labels = date_format("%Y")) +
  scale_y_continuous(breaks = seq(0, 200, 5),
                     labels = scales::dollar_format(accuracy = 1, suffix = " k€", prefix = ""))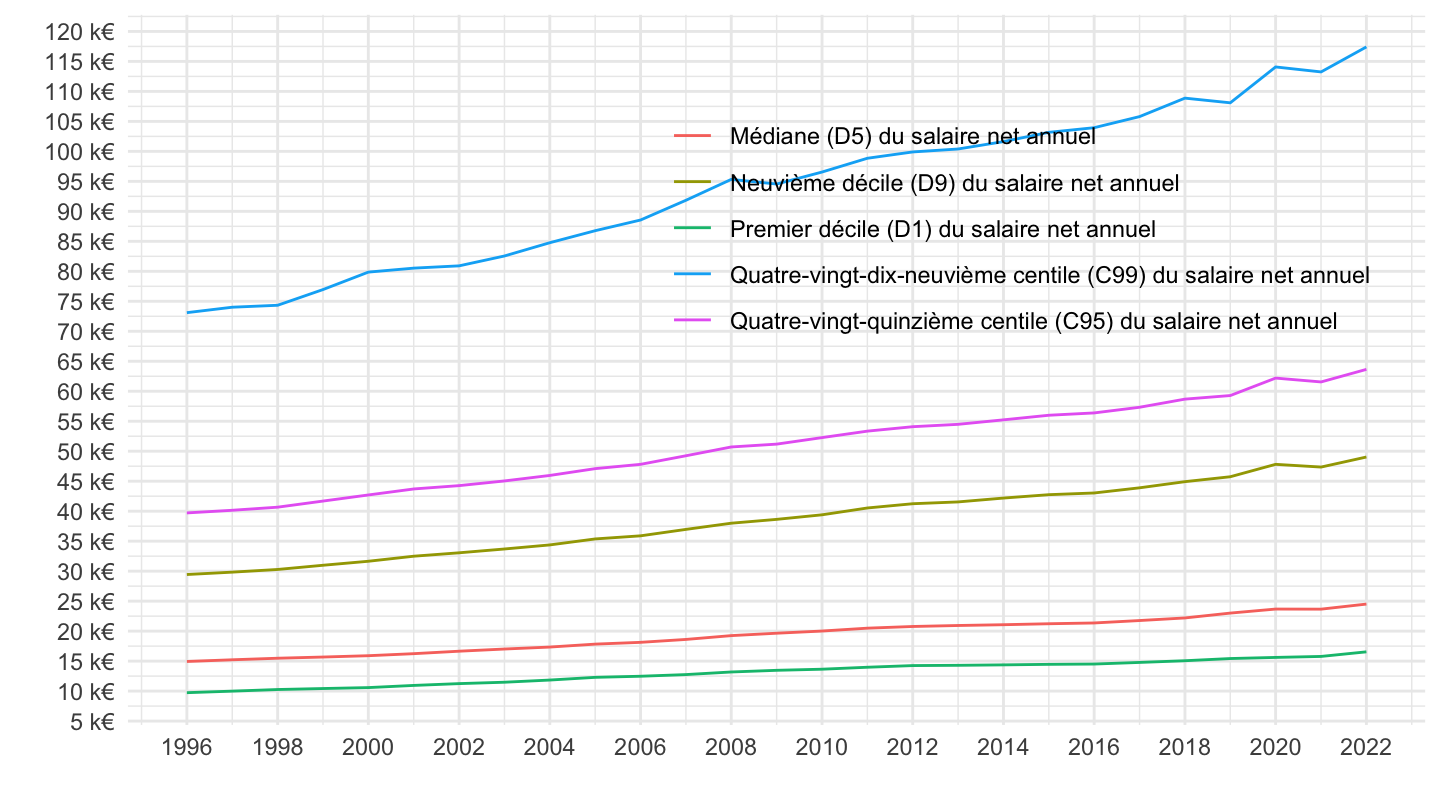
Indice
Nominal
Code
`SALAIRES-ANNUELS` %>%
  filter(INDICATEUR %in% c("SAL_ANN_D1", "SAL_ANN_D5", "SAL_ANN_D9", "SAL_ANN_C95", "SAL_ANN_C99"),
         SEXE == "0",
         `QUOTITE-TRAV` == "ETPP") %>%
  left_join(INDICATEUR, by = "INDICATEUR") %>%
  year_to_date %>%
  group_by(Indicateur) %>%
  mutate(OBS_VALUE = 100*OBS_VALUE/OBS_VALUE[date == as.Date("1996-01-01")]) %>%
  ggplot(.) + theme_minimal() + ylab("") + xlab("") +
  geom_line(aes(x = date, y = OBS_VALUE, color = Indicateur)) +
  theme(legend.title = element_blank(),
        legend.position = c(0.3, 0.8)) +
  scale_x_date(breaks = seq(1950, 2100, 2) %>% paste0("-01-01") %>% as.Date,
               labels = date_format("%Y")) +
  scale_y_log10(breaks = seq(100, 200, 5))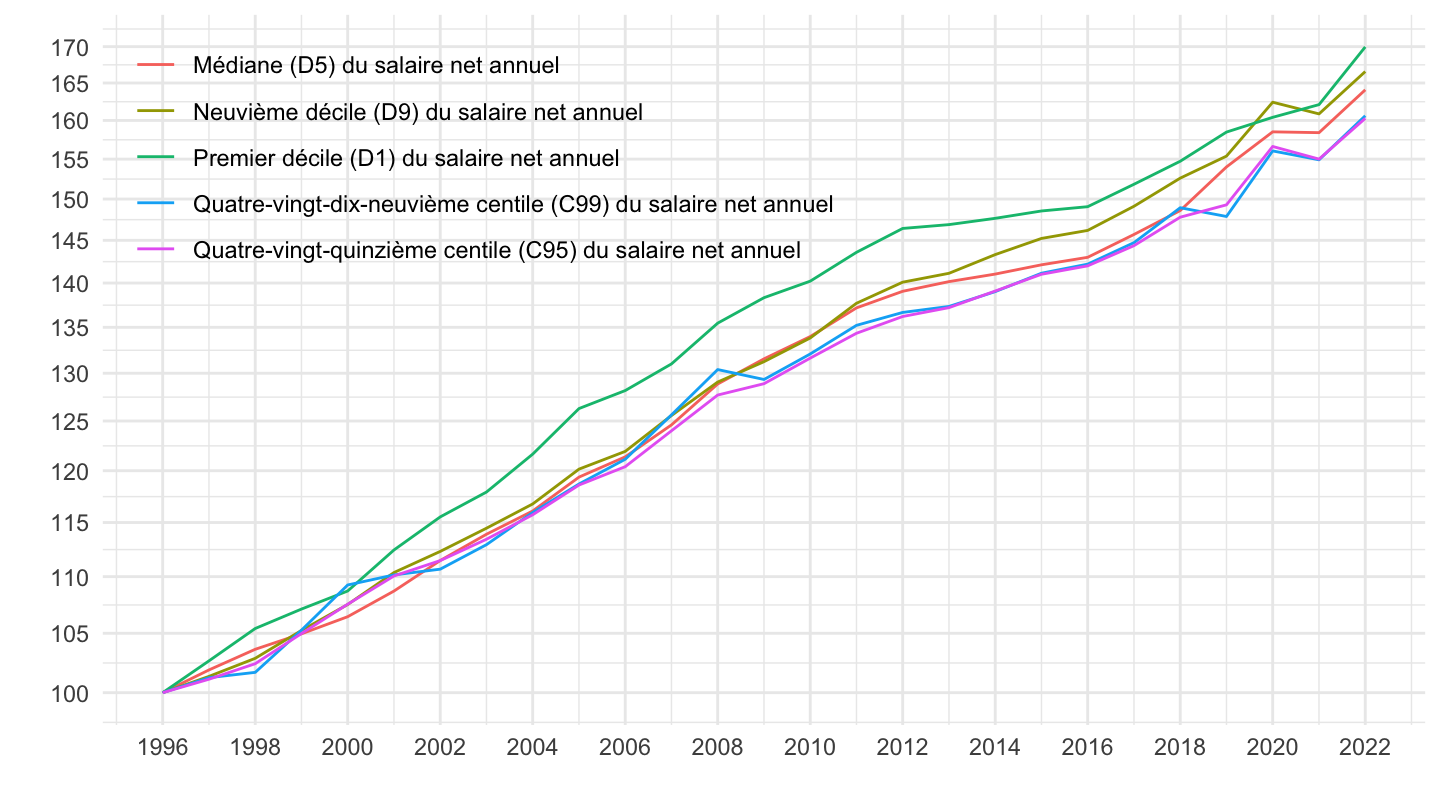
Nominal, 2017-
Code
`SALAIRES-ANNUELS` %>%
  filter(INDICATEUR %in% c("SAL_ANN_D1", "SAL_ANN_D5", "SAL_ANN_D9", "SAL_ANN_C95", "SAL_ANN_C99"),
         SEXE == "0",
         `QUOTITE-TRAV` == "ETPP") %>%
  left_join(INDICATEUR, by = "INDICATEUR") %>%
  year_to_date %>%
  group_by(Indicateur) %>%
  filter(date >= as.Date("2017-01-01")) %>%
  mutate(OBS_VALUE = 100*OBS_VALUE/OBS_VALUE[date == as.Date("2017-01-01")]) %>%
  ggplot(.) + theme_minimal() + ylab("") + xlab("") +
  geom_line(aes(x = date, y = OBS_VALUE, color = Indicateur)) +
  theme(legend.title = element_blank(),
        legend.position = c(0.3, 0.8)) +
  scale_x_date(breaks = seq(1950, 2100, 1) %>% paste0("-01-01") %>% as.Date,
               labels = date_format("%Y")) +
  scale_y_log10(breaks = seq(100, 200, 5))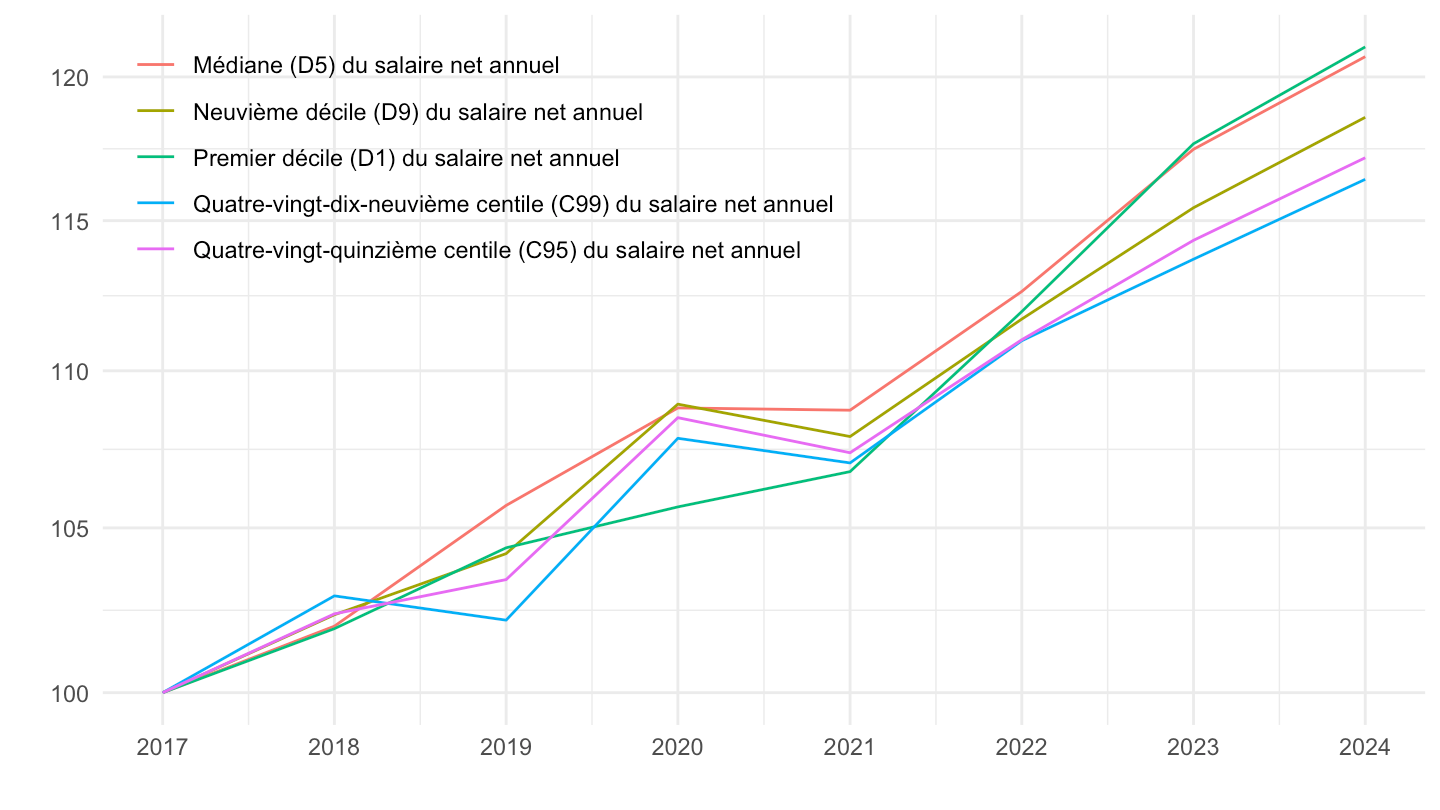
Réel
Tous
Code
`SALAIRES-ANNUELS` %>%
  filter(INDICATEUR %in% c("SAL_ANN_D1", "SAL_ANN_D5", "SAL_ANN_D9", "SAL_ANN_C95", "SAL_ANN_C99"),
         SEXE == "0",
         `QUOTITE-TRAV` == "ETPP") %>%
  left_join(INDICATEUR, by = "INDICATEUR") %>%
  year_to_date %>%
  group_by(Indicateur) %>%
  left_join(`inflation-A`, by = "date") %>%
  mutate(OBS_VALUE = OBS_VALUE/IPCH) %>%
  mutate(OBS_VALUE = 100*OBS_VALUE/OBS_VALUE[date == as.Date("1996-01-01")]) %>%
  ggplot(.) + theme_minimal() + ylab("") + xlab("") +
  geom_line(aes(x = date, y = OBS_VALUE, color = Indicateur)) +
  theme(legend.title = element_blank(),
        legend.position = c(0.3, 0.8)) +
  scale_x_date(breaks = seq(1950, 2100, 2) %>% paste0("-01-01") %>% as.Date,
               labels = date_format("%Y")) +
  scale_y_log10(breaks = seq(100, 200, 2)) +
  geom_hline(yintercept = 100, linetype = "dashed")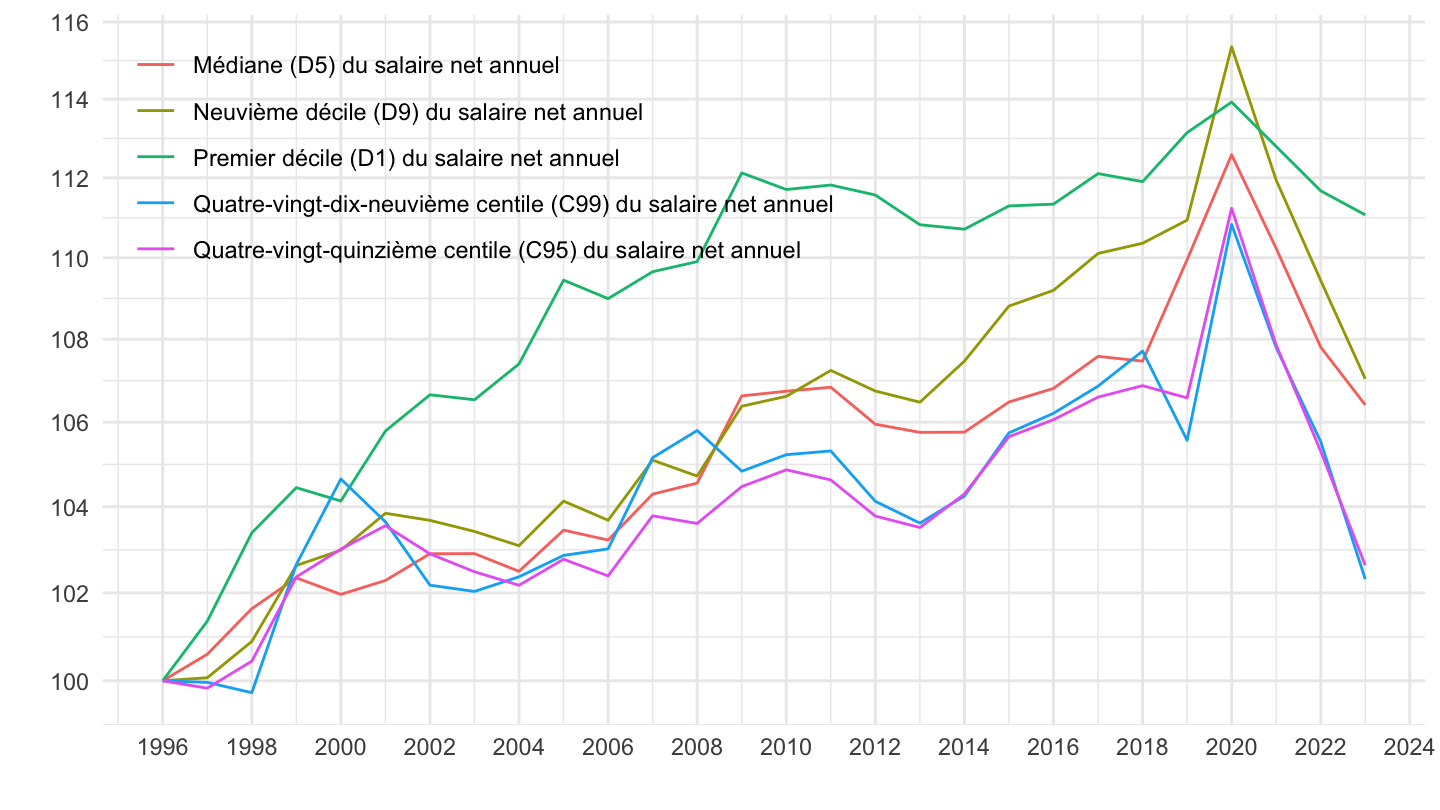
2008-
Code
`SALAIRES-ANNUELS` %>%
  filter(INDICATEUR %in% c("SAL_ANN_D1", "SAL_ANN_D5", "SAL_ANN_D9", "SAL_ANN_C95", "SAL_ANN_C99"),
         SEXE == "0",
         `QUOTITE-TRAV` == "ETPP") %>%
  left_join(INDICATEUR, by = "INDICATEUR") %>%
  year_to_date %>%
  group_by(Indicateur) %>%
  left_join(`inflation-A`, by = "date") %>%
  mutate(OBS_VALUE = OBS_VALUE/IPCH) %>%
  filter(date >= as.Date("2008-01-01")) %>%
  mutate(OBS_VALUE = 100*OBS_VALUE/OBS_VALUE[date == as.Date("2008-01-01")]) %>%
  ggplot(.) + theme_minimal() + ylab("") + xlab("") +
  geom_line(aes(x = date, y = OBS_VALUE, color = Indicateur)) +
  theme(legend.title = element_blank(),
        legend.position = c(0.3, 0.8)) +
  scale_x_date(breaks = seq(1950, 2100, 1) %>% paste0("-01-01") %>% as.Date,
               labels = date_format("%Y")) +
  scale_y_log10(breaks = seq(80, 200, 2))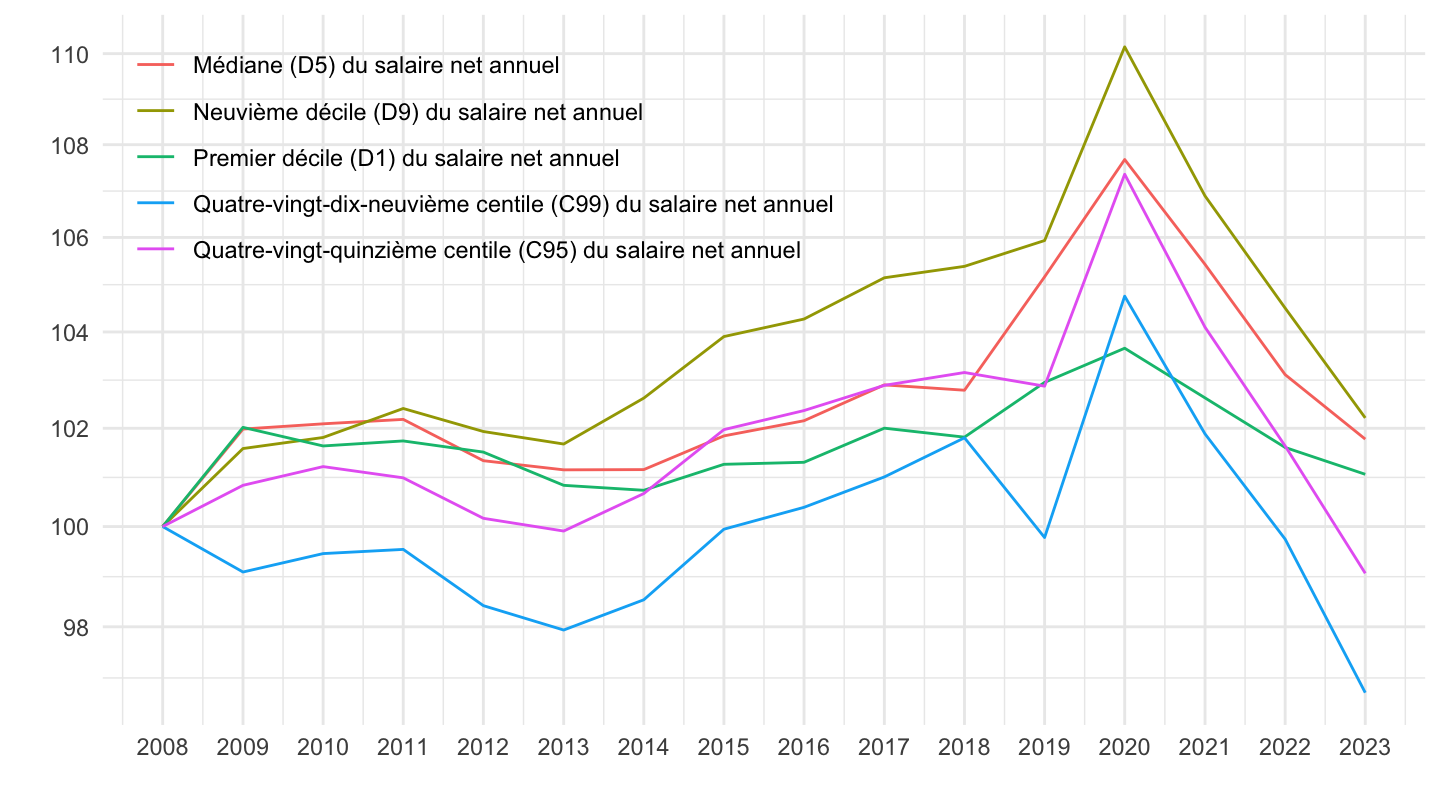
2017-
Code
`SALAIRES-ANNUELS` %>%
  filter(INDICATEUR %in% c("SAL_ANN_D1", "SAL_ANN_D5", "SAL_ANN_D9", "SAL_ANN_C95", "SAL_ANN_C99"),
         SEXE == "0",
         `QUOTITE-TRAV` == "ETPP") %>%
  left_join(INDICATEUR, by = "INDICATEUR") %>%
  year_to_date %>%
  group_by(Indicateur) %>%
  left_join(`inflation-A`, by = "date") %>%
  mutate(OBS_VALUE = OBS_VALUE/IPCH) %>%
  filter(date >= as.Date("2017-01-01")) %>%
  mutate(OBS_VALUE = 100*OBS_VALUE/OBS_VALUE[date == as.Date("2017-01-01")]) %>%
  ggplot(.) + theme_minimal() + ylab("Pouvoir d'achat du salaire réel (IPCH)") + xlab("") +
  geom_line(aes(x = date, y = OBS_VALUE, color = Indicateur)) +
  theme(legend.title = element_blank(),
        legend.position = c(0.3, 0.8)) +
  scale_x_date(breaks = seq(1950, 2100, 1) %>% paste0("-01-01") %>% as.Date,
               labels = date_format("%Y")) +
  scale_y_log10(breaks = seq(80, 200, 1)) +
  geom_hline(yintercept = 100, linetype = "dashed")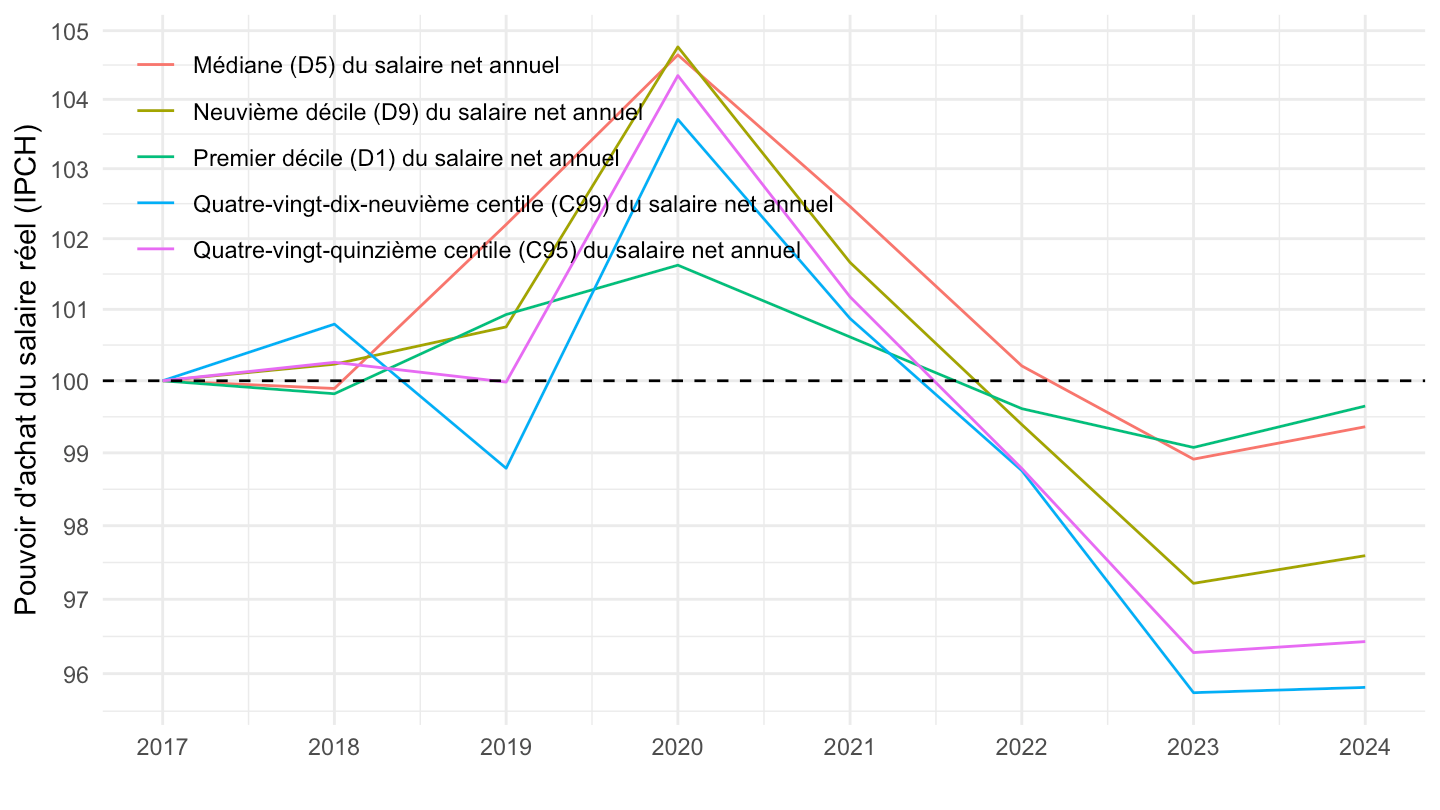
2017-
Code
`SALAIRES-ANNUELS` %>%
  filter(INDICATEUR %in% c("SAL_ANN_D1", "SAL_ANN_D5", "SAL_ANN_D9", "SAL_ANN_C95", "SAL_ANN_C99"),
         SEXE == "0",
         `QUOTITE-TRAV` == "ETPP") %>%
  left_join(INDICATEUR, by = "INDICATEUR") %>%
  year_to_date %>%
  group_by(Indicateur) %>%
  left_join(`inflation-A`, by = "date") %>%
  mutate(OBS_VALUE = OBS_VALUE/IPC) %>%
  filter(date >= as.Date("2017-01-01")) %>%
  mutate(OBS_VALUE = 100*OBS_VALUE/OBS_VALUE[date == as.Date("2017-01-01")]) %>%
  ggplot(.) + theme_minimal() + ylab("Pouvoir d'achat du salaire réel (IPC)") + xlab("") +
  geom_line(aes(x = date, y = OBS_VALUE, color = Indicateur)) +
  theme(legend.title = element_blank(),
        legend.position = c(0.3, 0.8)) +
  scale_x_date(breaks = seq(1950, 2100, 1) %>% paste0("-01-01") %>% as.Date,
               labels = date_format("%Y")) +
  scale_y_log10(breaks = seq(80, 200, 1)) +
  geom_hline(yintercept = 100, linetype = "dashed")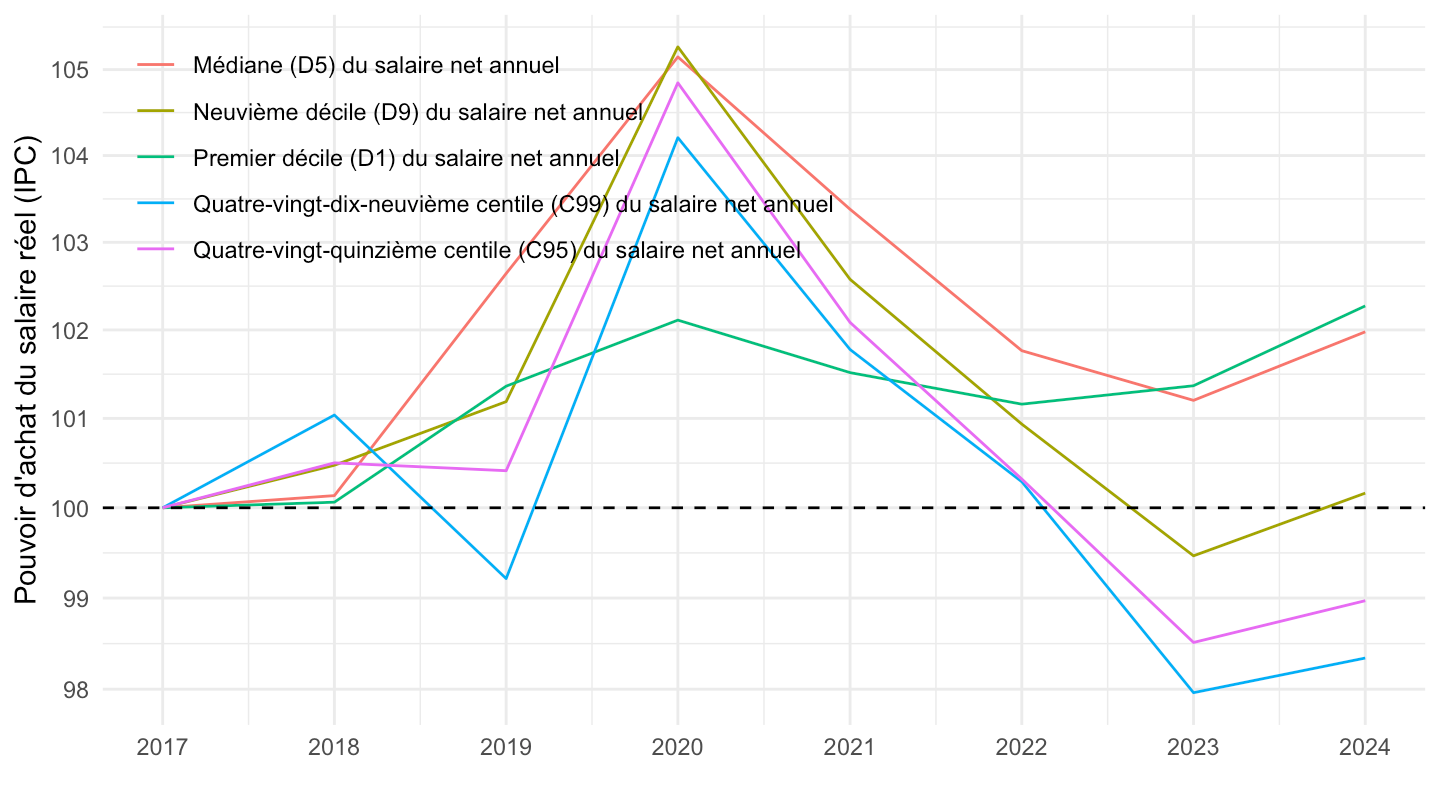
Euros constants vs courants
Euros constants
Code
`SALAIRES-ANNUELS` %>%
  filter(VALORISATION == "EUROS_CONST",
         `QUOTITE-TRAV` == "SO") %>%
  left_join(INDICATEUR, by = "INDICATEUR") %>%
  year_to_date %>%
  group_by(Indicateur) %>%
  mutate(OBS_VALUE = 100*OBS_VALUE/OBS_VALUE[date == as.Date("2000-01-01")]) %>%
  ggplot(.) + theme_minimal() + ylab("") + xlab("") +
  geom_line(aes(x = date, y = OBS_VALUE, color = Indicateur)) +
  theme(legend.title = element_blank(),
        legend.position = c(0.3, 0.7)) +
  scale_x_date(breaks = seq(1950, 2100, 2) %>% paste0("-01-01") %>% as.Date,
               labels = date_format("%Y")) +
  scale_y_log10(breaks = seq(100, 200, 2))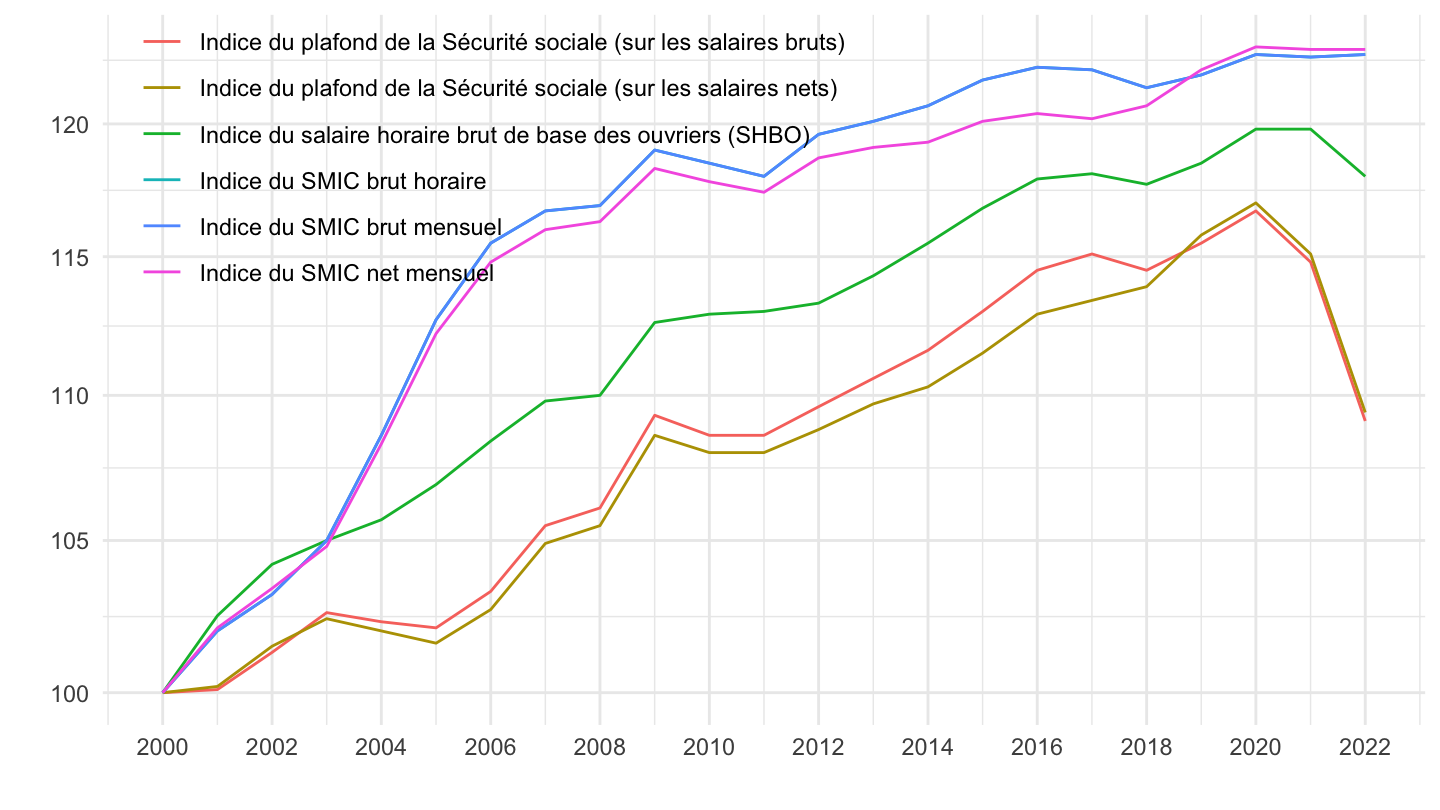
Euros courants
Code
`SALAIRES-ANNUELS` %>%
  filter(VALORISATION == "EUROS_COUR",
         `QUOTITE-TRAV` == "SO") %>%
  left_join(INDICATEUR, by = "INDICATEUR") %>%
  year_to_date %>%
  group_by(Indicateur) %>%
  mutate(OBS_VALUE = 100*OBS_VALUE/OBS_VALUE[date == as.Date("2000-01-01")]) %>%
  ggplot(.) + theme_minimal() + ylab("") + xlab("") +
  geom_line(aes(x = date, y = OBS_VALUE, color = Indicateur)) +
  theme(legend.title = element_blank(),
        legend.position = c(0.3, 0.8)) +
  scale_x_date(breaks = seq(1950, 2100, 2) %>% paste0("-01-01") %>% as.Date,
               labels = date_format("%Y")) +
  scale_y_log10(breaks = seq(100, 200, 5))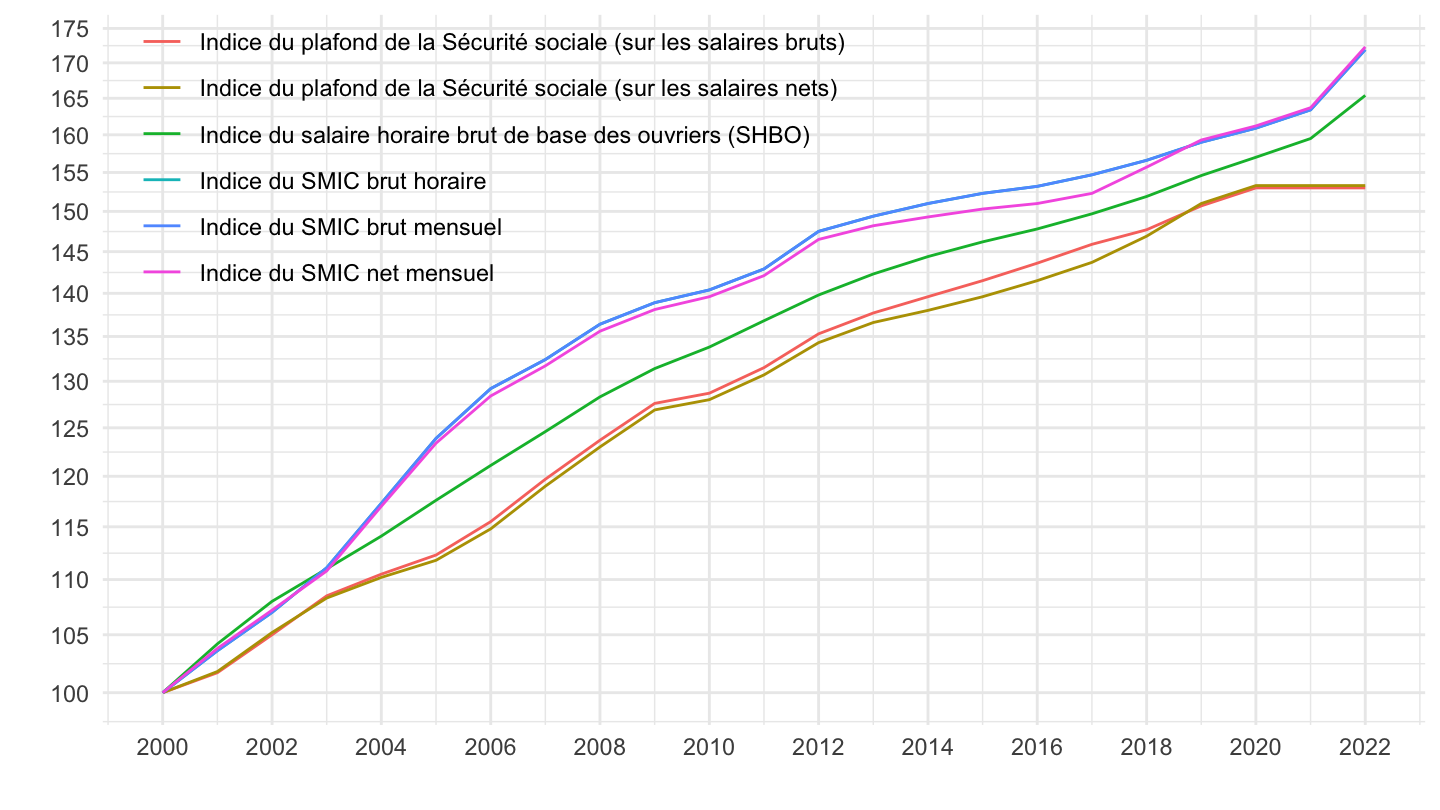
Series
En 1980
Code
`SALAIRES-ANNUELS` %>%
  filter(TIME_PERIOD == "1980") %>%
  select(IDBANK, TITLE_FR, METIER, INDICATEUR, SEXE, OBS_VALUE) %>%
  print_table_conditional()
Salaire moyen dans le secteur privé
Annuel, temps complet
Code
`SALAIRES-ANNUELS` %>%
  filter(IDBANK == "010752364") %>%
  select(TIME_PERIOD, OBS_VALUE, TITLE_FR) %>%
  year_to_date() %>%
  ggplot(.) + theme_minimal() + xlab("") + ylab("") +
  geom_line(aes(x = date, y = OBS_VALUE / 1000, color = TITLE_FR)) +
  scale_color_manual(values = viridis(3)[1:2]) +
  theme(legend.title = element_blank(),
        legend.position = c(0.8, 0.2)) +
  scale_x_date(breaks = seq(1920, 2100, 5) %>% paste0("-01-01") %>% as.Date(),
               labels = date_format("%Y")) +
  scale_y_continuous(breaks = seq(0, 200, 5))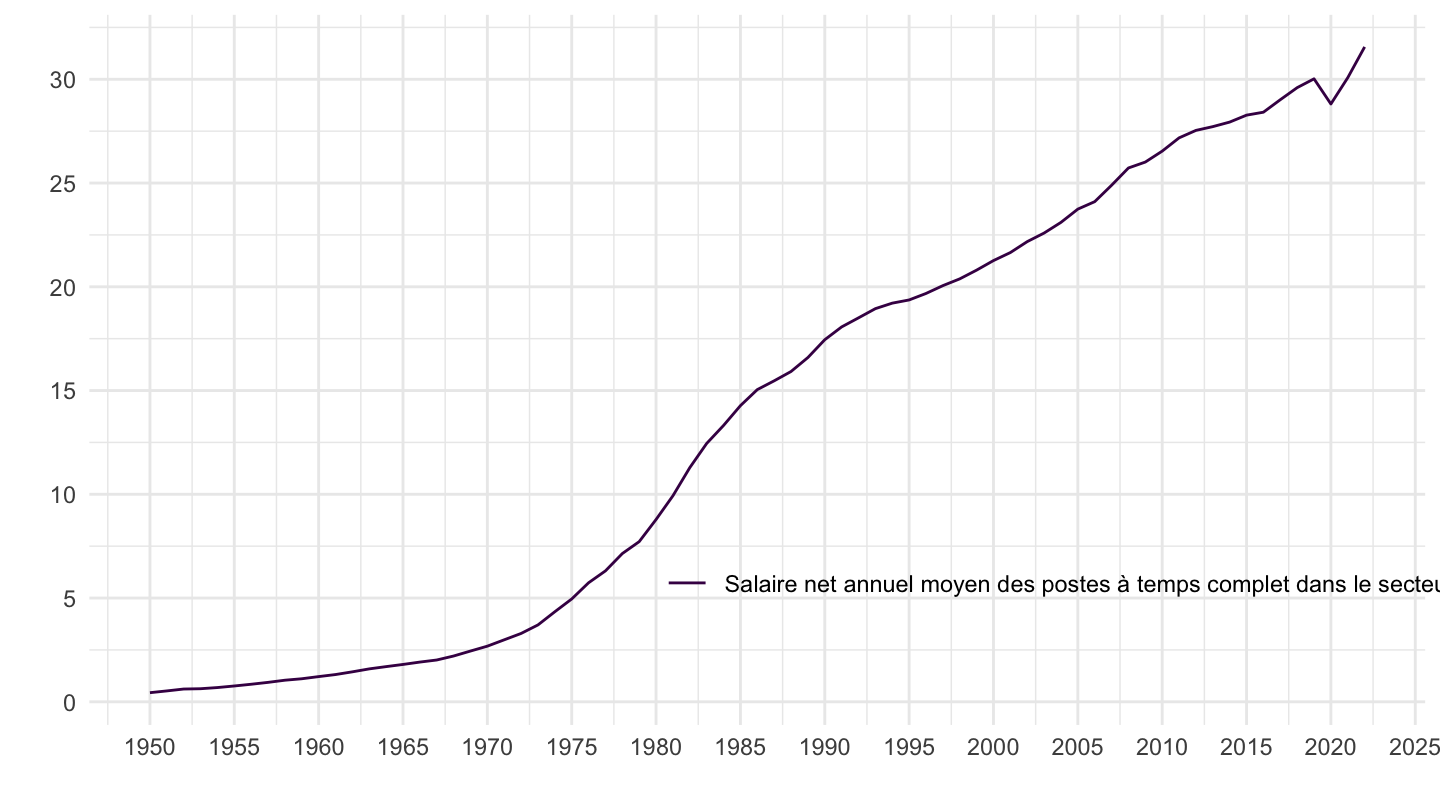
Smic
Code
`SALAIRES-ANNUELS` %>%
  filter(IDBANK %in% c("000883657", "000883658")) %>%
  year_to_date() %>%
  ggplot(.) + theme_minimal() + xlab("") + ylab("") +
  geom_line(aes(x = date, y = OBS_VALUE / 1000, color = TITLE_FR)) +
  scale_color_manual(values = viridis(3)[1:2]) +
  theme(legend.title = element_blank(),
        legend.position = c(0.8, 0.2)) +
  scale_x_date(breaks = seq(1920, 2100, 5) %>% paste0("-01-01") %>% as.Date(),
               labels = date_format("%Y")) +
  scale_y_continuous(breaks = seq(0, 200, 1))
Ratio D9/D1
Code
`SALAIRES-ANNUELS` %>%
  left_join(INDICATEUR, by = "INDICATEUR") %>%
  filter(IDBANK %in% c("010752411", "001665221")) %>%
  left_join(`QUOTITE-TRAV`, by = "QUOTITE-TRAV") %>%
  year_to_date() %>%
  ggplot(.) + theme_minimal() + xlab("") + ylab("") +
  geom_line(aes(x = date, y = OBS_VALUE, color = `Quotite-Trav`)) +
  scale_color_manual(values = viridis(3)[1:2]) +
  theme(legend.title = element_blank(),
        legend.position = c(0.7, 0.8)) +
  scale_x_date(breaks = seq(1920, 2100, 5) %>% paste0("-01-01") %>% as.Date(),
               labels = date_format("%Y")) +
  scale_y_continuous(breaks = seq(2, 5, 0.2))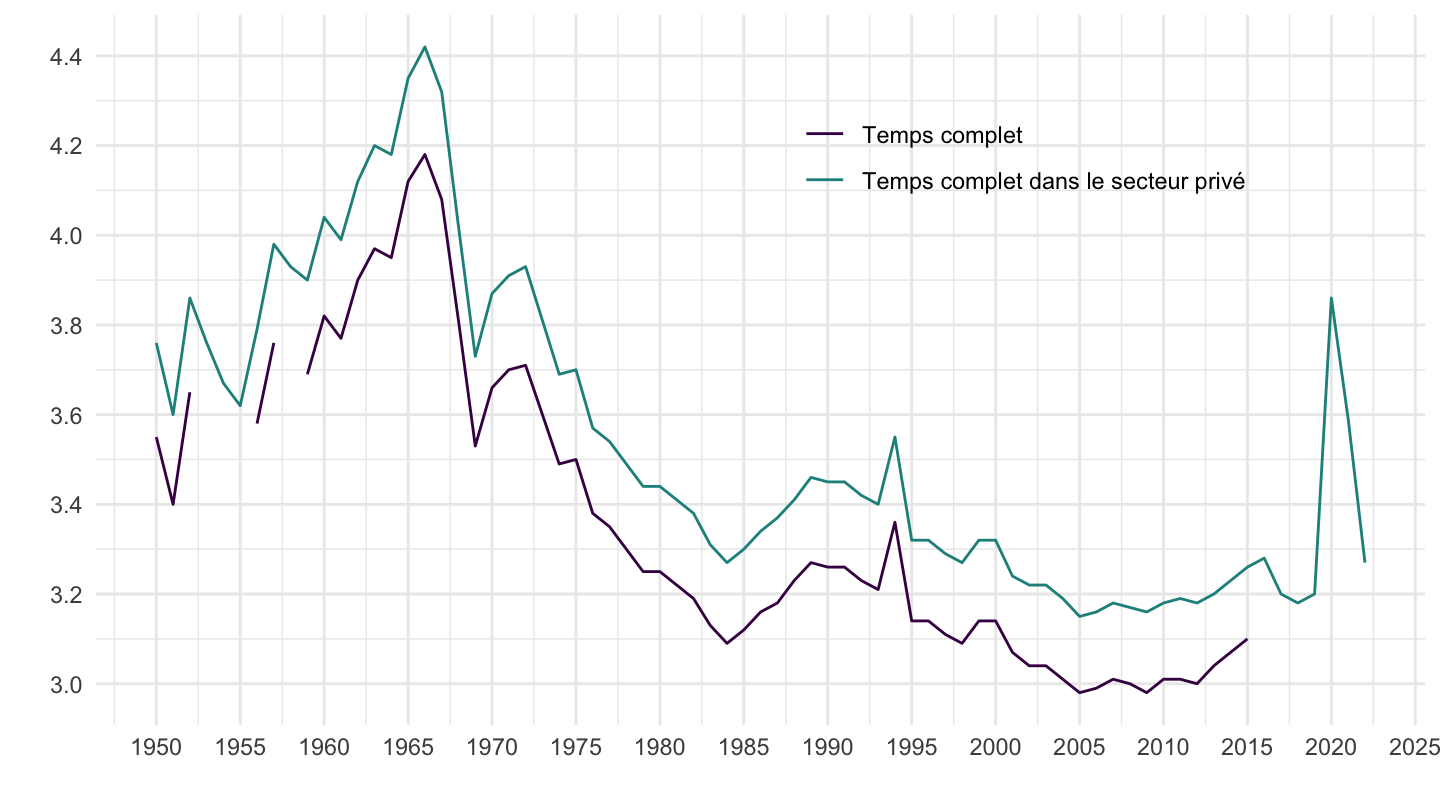
Séries longues, Temps complets dans le privé
1951
Code
`SALAIRES-ANNUELS` %>%
  filter(TIME_PERIOD %in% c("1951", "2010"),
         is.finite(OBS_VALUE)) %>%
  select_if(~ n_distinct(.) > 1) %>%
  select(TITLE_FR, TIME_PERIOD, OBS_VALUE) %>%
  group_by(TITLE_FR) %>%
  filter(n() == 2) %>%
  spread(TIME_PERIOD, OBS_VALUE) %>%
  print_table_conditional
Les Deux - 010752375, 010752366
Tous
Code
`SALAIRES-ANNUELS` %>%
  filter(IDBANK %in% c("010752375", "010752366")) %>%
  year_to_date() %>%
  group_by(TITLE_FR) %>%
  arrange(date) %>%
  mutate(OBS_VALUE = 100*OBS_VALUE/OBS_VALUE[1]) %>%
  ggplot(.) + theme_minimal() +
  xlab("") + ylab("Pouvoir d'achat du salaire net annuel moyen dans le privé") +
  geom_line(aes(x = date, y = OBS_VALUE, color = TITLE_FR)) +
  theme(legend.title = element_blank(),
        legend.position = c(0.7, 0.8)) +
  scale_x_date(breaks = seq(1920, 2100, 5) %>% paste0("-01-01") %>% as.Date(),
               labels = date_format("%Y")) +
  scale_y_log10(breaks = c(100, 200, 500, 800, 1000, 2000, 5000, 10000, 20000))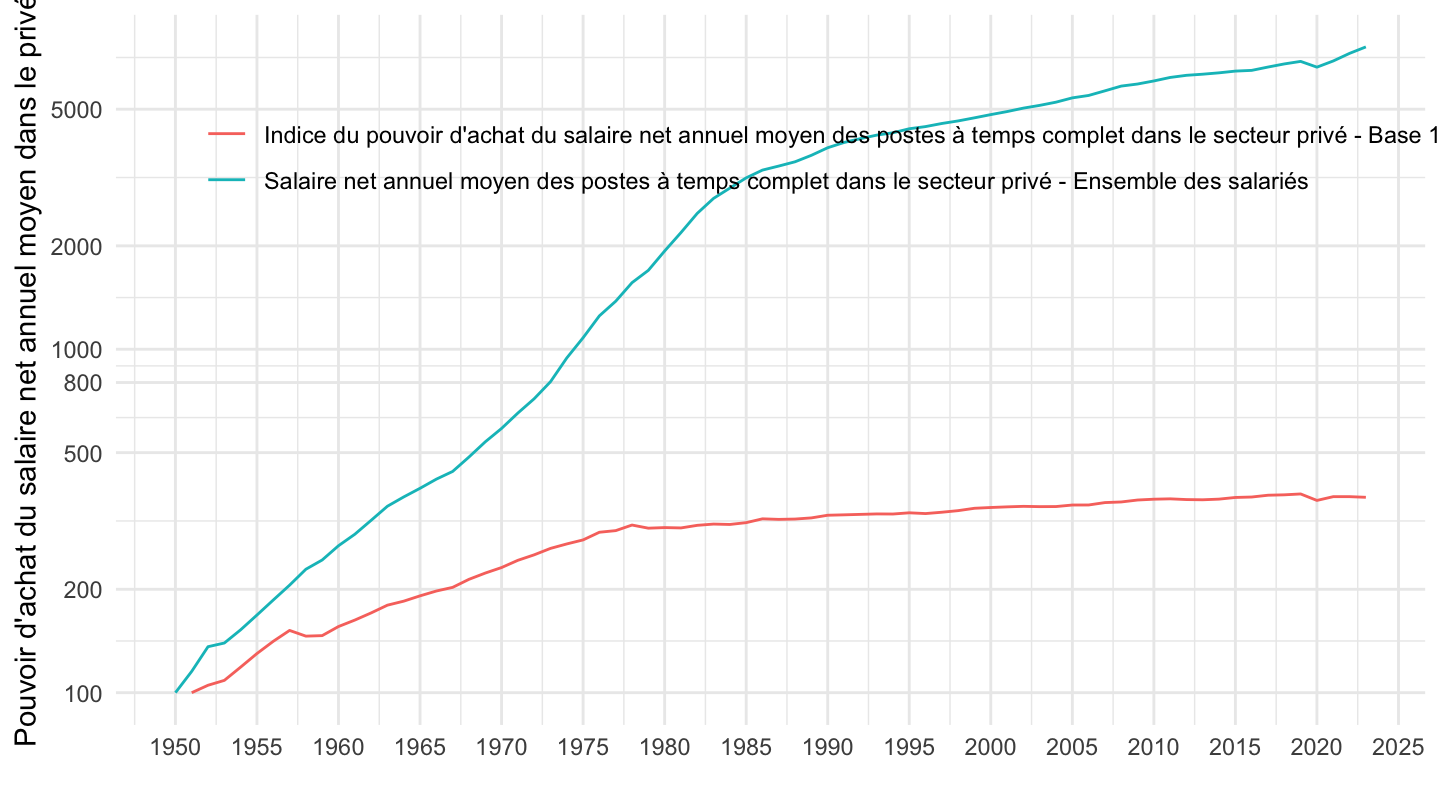
1975-
Code
`SALAIRES-ANNUELS` %>%
  filter(IDBANK %in% c("010752375", "010752366")) %>%
  year_to_date() %>%
  filter(date >= as.Date("1975-01-01")) %>%
  group_by(TITLE_FR) %>%
  arrange(date) %>%
  mutate(OBS_VALUE = 100*OBS_VALUE/OBS_VALUE[1]) %>%
  ggplot(.) + theme_minimal() +
  xlab("") + ylab("Pouvoir d'achat du salaire net annuel moyen dans le privé") +
  geom_line(aes(x = date, y = OBS_VALUE, color = TITLE_FR)) +
  theme(legend.title = element_blank(),
        legend.position = c(0.7, 0.8)) +
  scale_x_date(breaks = seq(1920, 2100, 5) %>% paste0("-01-01") %>% as.Date(),
               labels = date_format("%Y")) +
  scale_y_log10(breaks = seq(100, 5000, 100))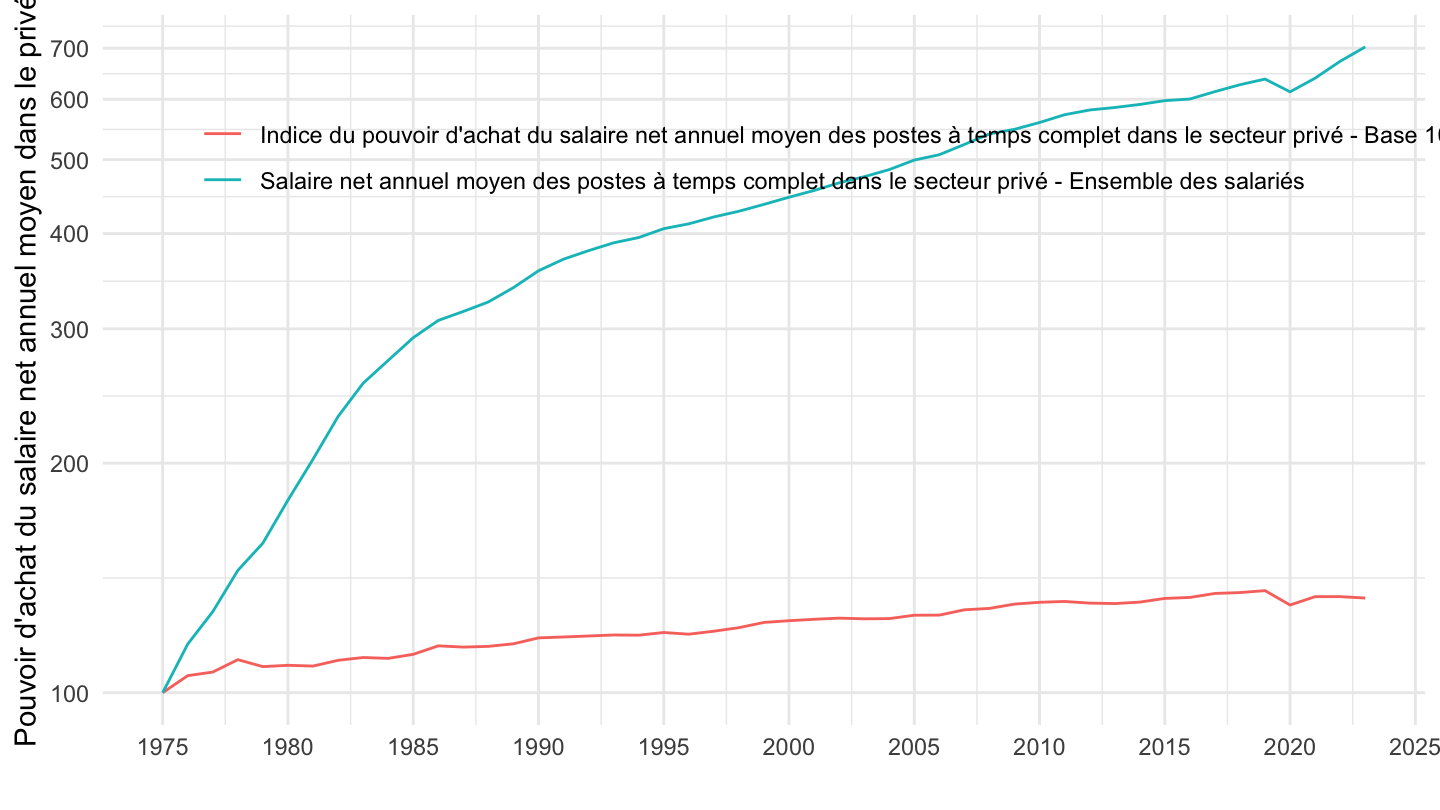
1984-
Code
`SALAIRES-ANNUELS` %>%
  filter(IDBANK %in% c("010752375", "010752366")) %>%
  year_to_date() %>%
  filter(date >= as.Date("1984-01-01")) %>%
  group_by(TITLE_FR) %>%
  arrange(date) %>%
  mutate(OBS_VALUE = 100*OBS_VALUE/OBS_VALUE[1]) %>%
  ggplot(.) + theme_minimal() +
  xlab("") + ylab("Pouvoir d'achat du salaire net annuel moyen dans le privé") +
  geom_line(aes(x = date, y = OBS_VALUE, color = TITLE_FR)) +
  theme(legend.title = element_blank(),
        legend.position = c(0.7, 0.8)) +
  scale_x_date(breaks = seq(1920, 2100, 5) %>% paste0("-01-01") %>% as.Date(),
               labels = date_format("%Y")) +
  scale_y_log10(breaks = seq(100, 5000, 10))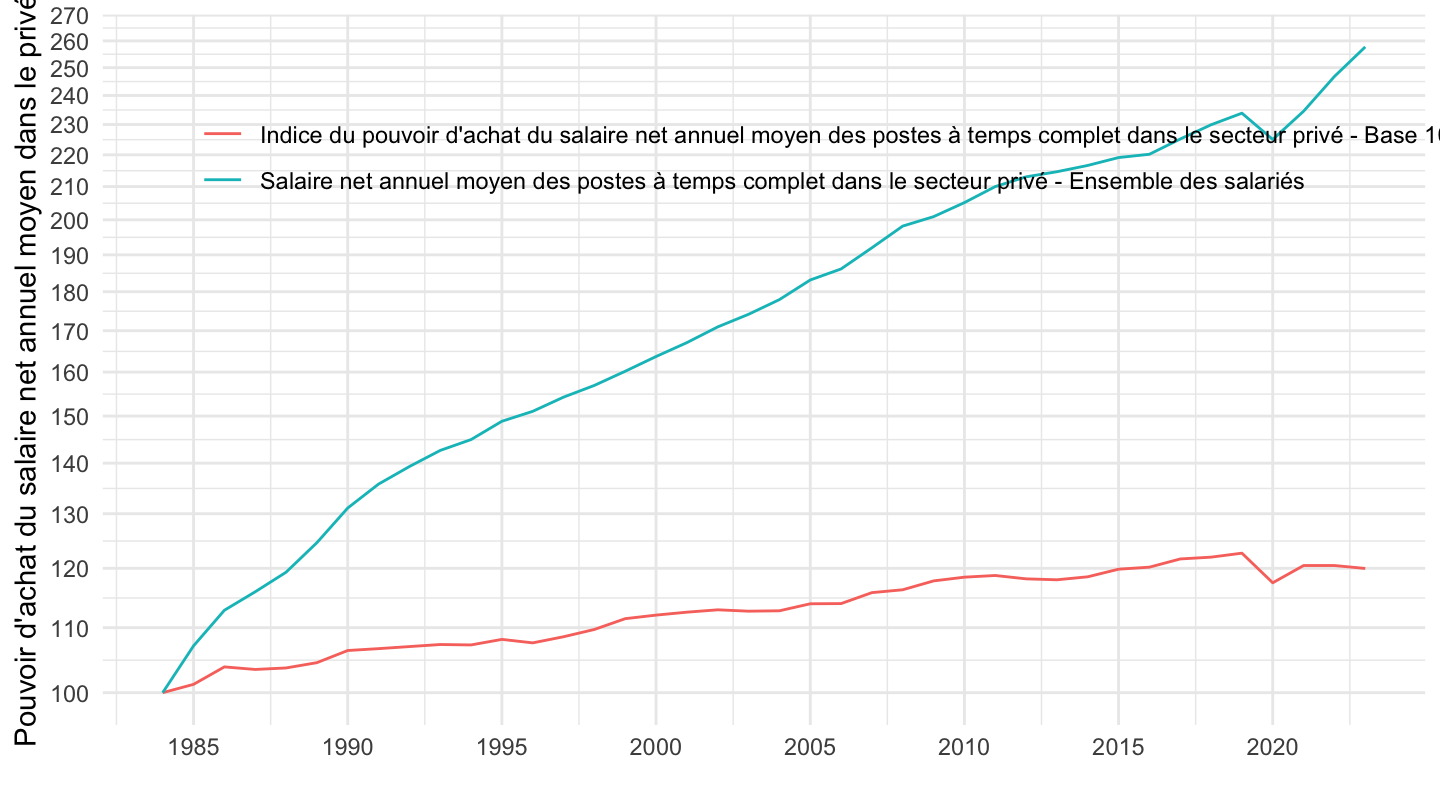
1990-
Code
`SALAIRES-ANNUELS` %>%
  filter(IDBANK %in% c("010752375", "010752366")) %>%
  year_to_date() %>%
  filter(date >= as.Date("1990-01-01")) %>%
  group_by(TITLE_FR) %>%
  arrange(date) %>%
  mutate(OBS_VALUE = 100*OBS_VALUE/OBS_VALUE[1]) %>%
  ggplot(.) + theme_minimal() +
  xlab("") + ylab("Pouvoir d'achat du salaire net annuel moyen dans le privé") +
  geom_line(aes(x = date, y = OBS_VALUE, color = TITLE_FR)) +
  theme(legend.title = element_blank(),
        legend.position = c(0.6, 0.8)) +
  scale_x_date(breaks = seq(1920, 2100, 5) %>% paste0("-01-01") %>% as.Date(),
               labels = date_format("%Y")) +
  scale_y_log10(breaks = seq(100, 5000, 10))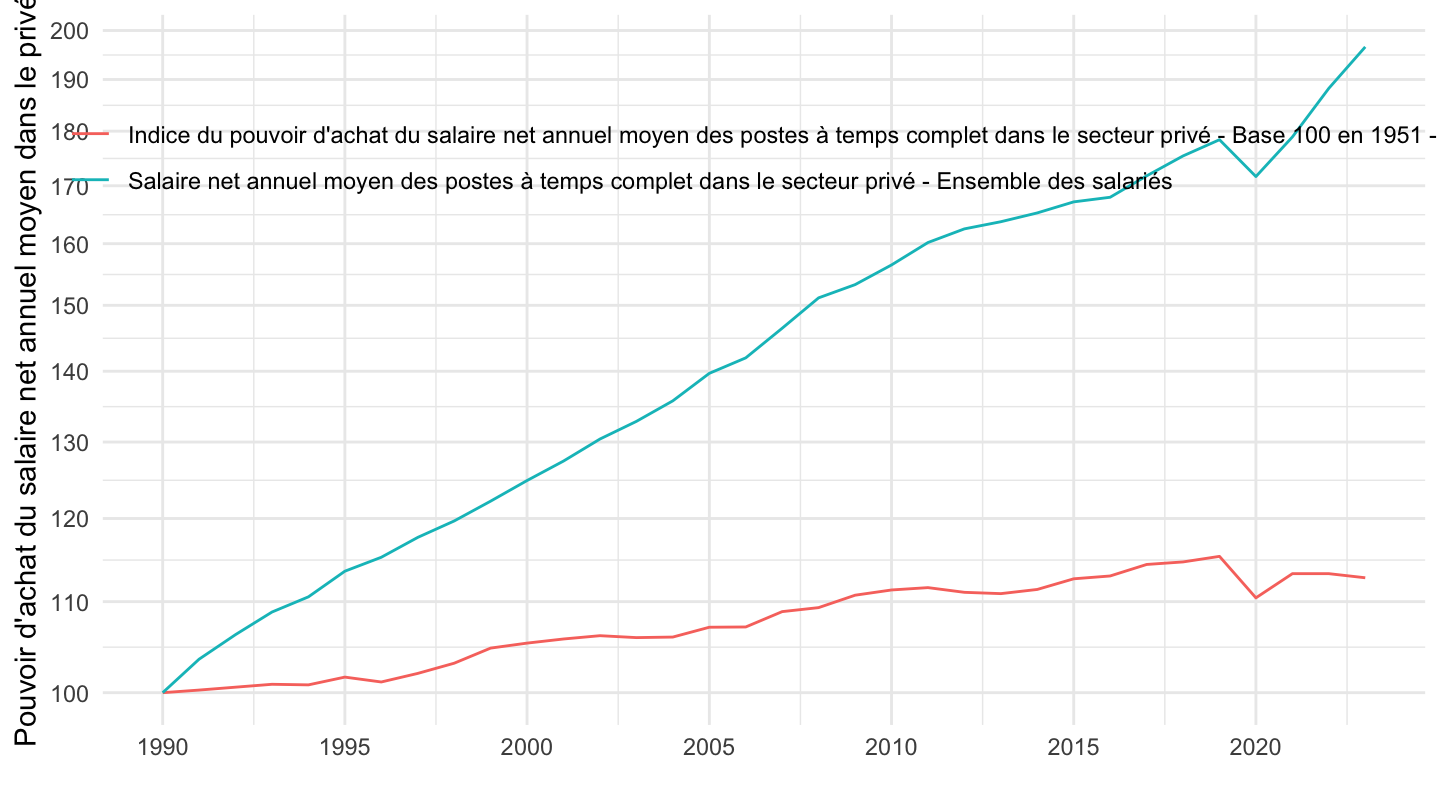
1993-
Code
`SALAIRES-ANNUELS` %>%
  filter(IDBANK %in% c("010752375", "010752366")) %>%
  year_to_date() %>%
  filter(date >= as.Date("1993-01-01")) %>%
  group_by(TITLE_FR) %>%
  arrange(date) %>%
  mutate(OBS_VALUE = 100*OBS_VALUE/OBS_VALUE[1]) %>%
  ggplot(.) + theme_minimal() +
  xlab("") + ylab("Pouvoir d'achat du salaire net annuel moyen dans le privé") +
  geom_line(aes(x = date, y = OBS_VALUE, color = TITLE_FR)) +
  theme(legend.title = element_blank(),
        legend.position = c(0.6, 0.8)) +
  scale_x_date(breaks = seq(1993, 2100, 2) %>% paste0("-01-01") %>% as.Date(),
               labels = date_format("%Y")) +
  scale_y_log10(breaks = seq(100, 5000, 10)) +
  geom_text_repel(aes(x = date, y = OBS_VALUE, label = round(OBS_VALUE, 1)),
                  fontface ="plain", color = "black", size = 3)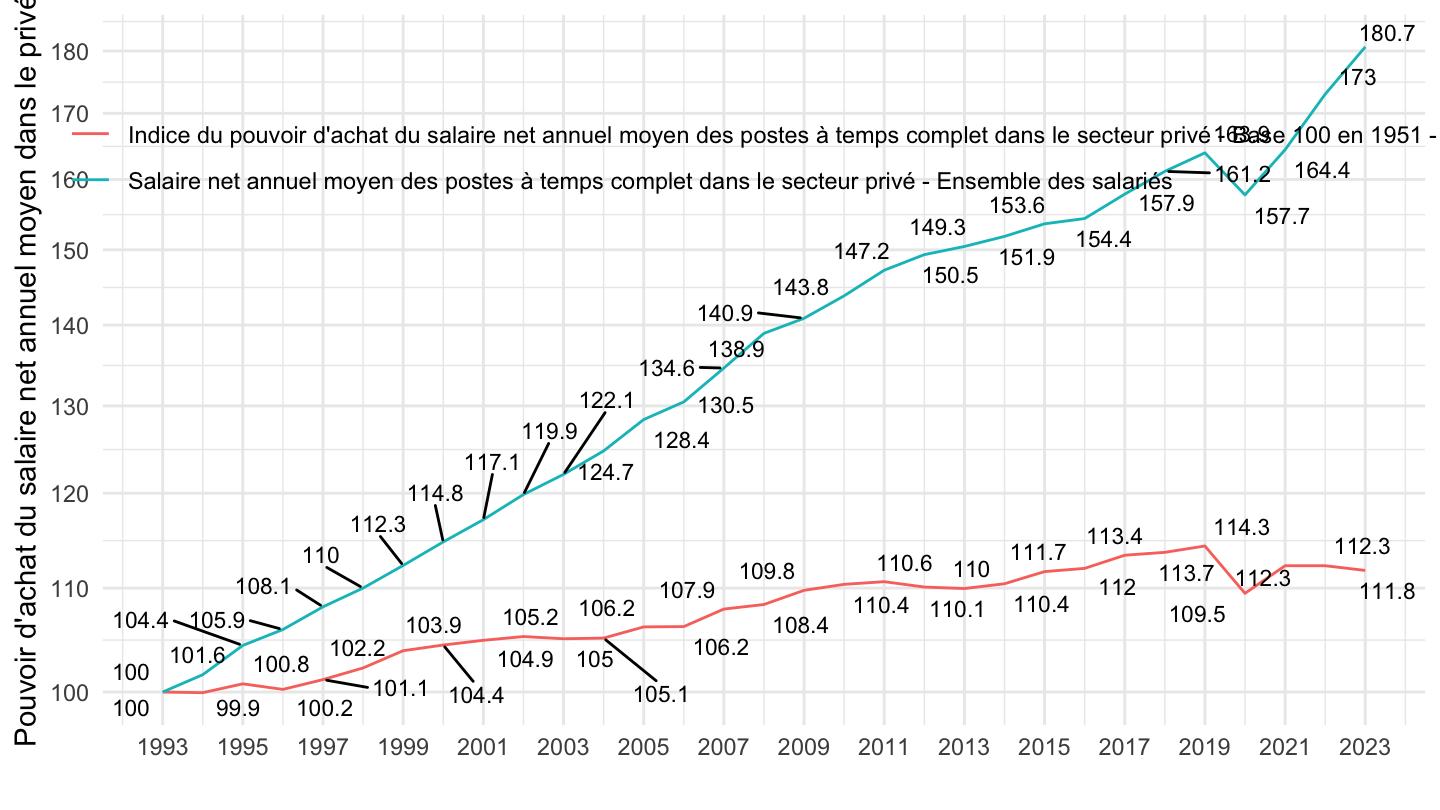
1996-
Hommes
Code
`SALAIRES-ANNUELS` %>%
  filter(IDBANK %in% c("010752373", "010752366")) %>%
  year_to_date() %>%
  filter(date >= as.Date("1996-01-01")) %>%
  group_by(TITLE_FR) %>%
  arrange(date) %>%
  mutate(OBS_VALUE = 100*OBS_VALUE/OBS_VALUE[1]) %>%
  ggplot(.) + theme_minimal() +
  xlab("") + ylab("Pouvoir d'achat du salaire net annuel moyen dans le privé") +
  geom_line(aes(x = date, y = OBS_VALUE, color = TITLE_FR)) +
  theme(legend.title = element_blank(),
        legend.position = c(0.6, 0.8)) +
  scale_x_date(breaks = seq(1920, 2100, 2) %>% paste0("-01-01") %>% as.Date(),
               labels = date_format("%Y")) +
  scale_y_log10(breaks = seq(100, 5000, 10))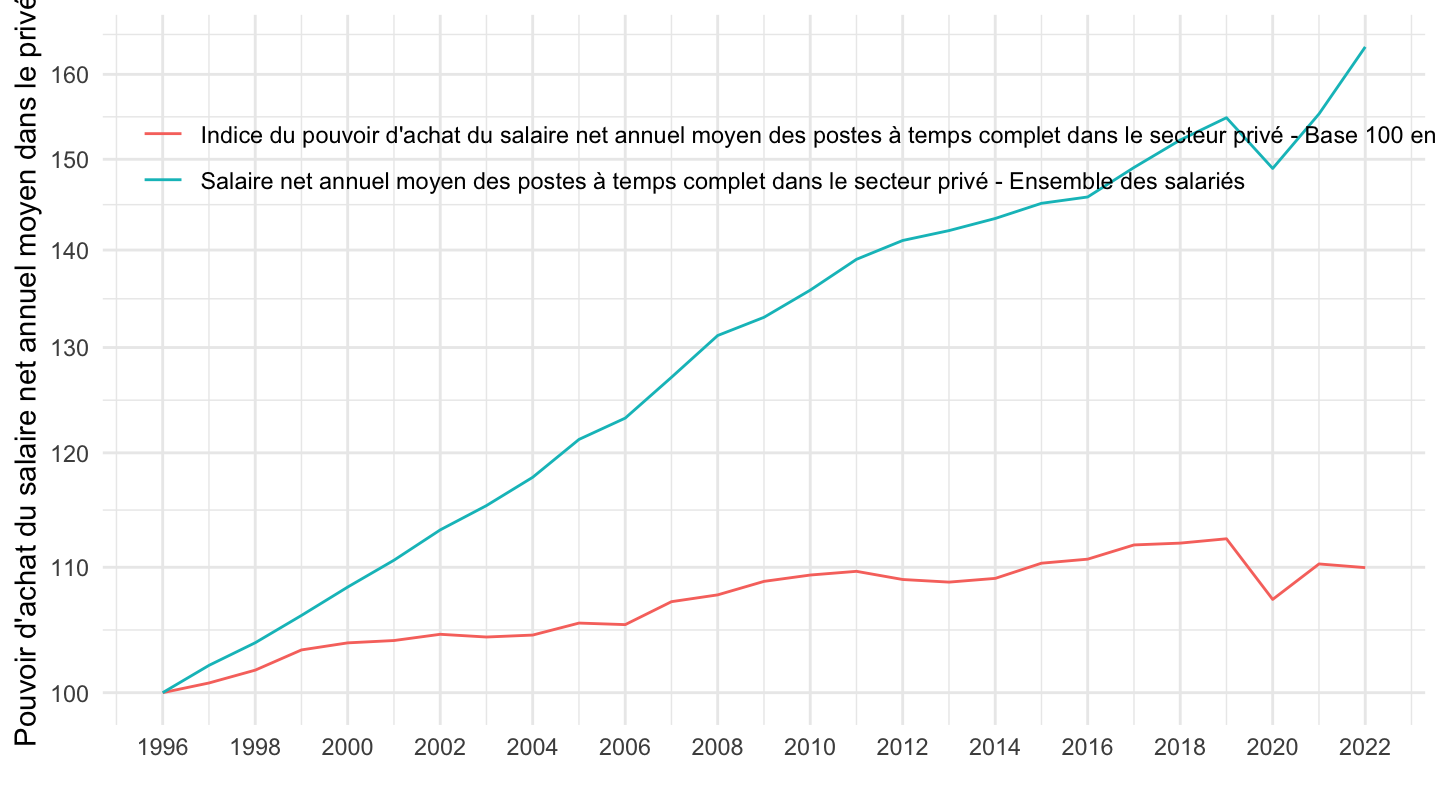
Femmes
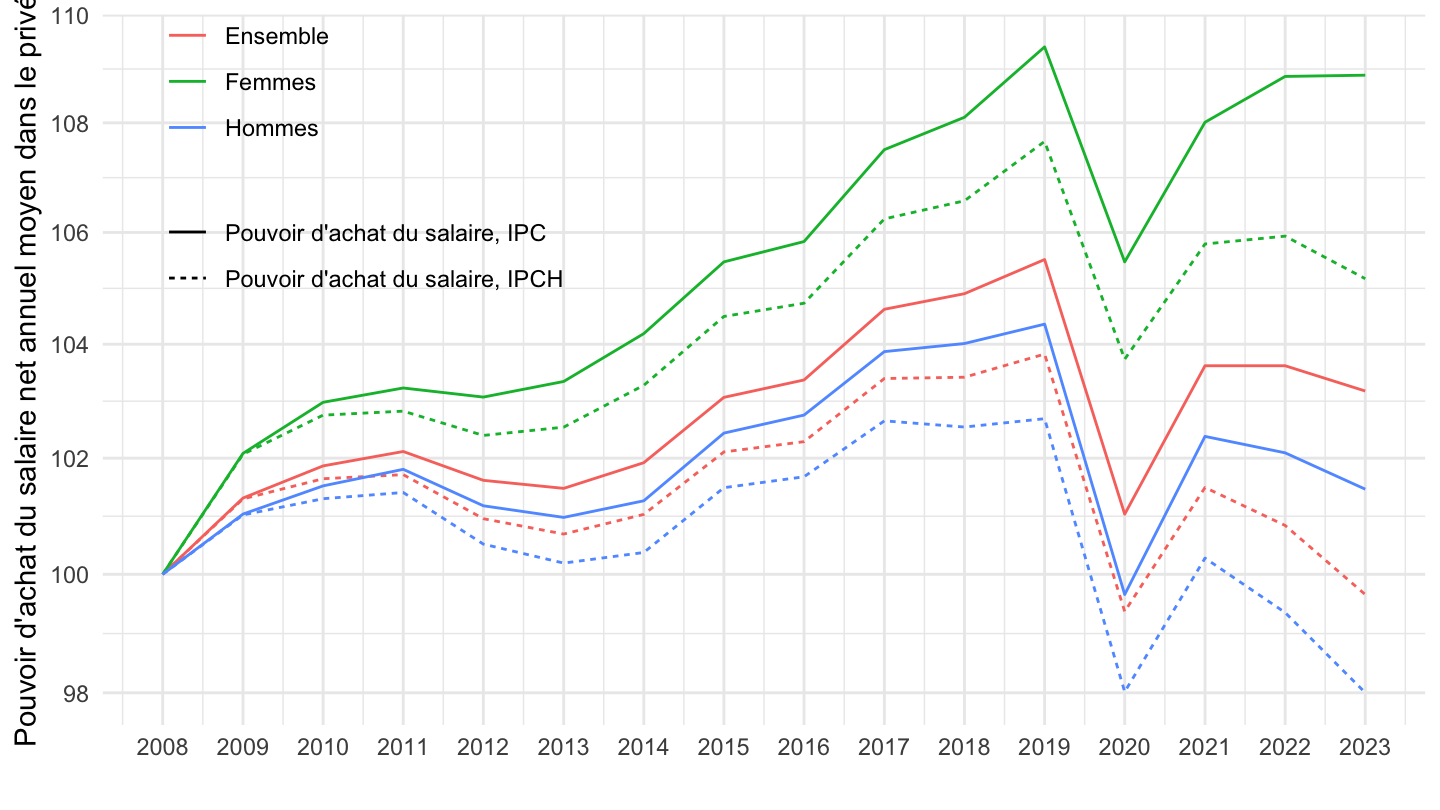
Code
`SALAIRES-ANNUELS` %>%
  filter(IDBANK %in% c("010752374", "010752366")) %>%
  year_to_date() %>%
  filter(date >= as.Date("1996-01-01")) %>%
  group_by(TITLE_FR) %>%
  arrange(date) %>%
  mutate(OBS_VALUE = 100*OBS_VALUE/OBS_VALUE[1]) %>%
  ggplot(.) + theme_minimal() +
  xlab("") + ylab("Pouvoir d'achat du salaire net annuel moyen dans le privé") +
  geom_line(aes(x = date, y = OBS_VALUE, color = TITLE_FR)) +
  theme(legend.title = element_blank(),
        legend.position = c(0.6, 0.8)) +
  scale_x_date(breaks = seq(1920, 2100, 2) %>% paste0("-01-01") %>% as.Date(),
               labels = date_format("%Y")) +
  scale_y_log10(breaks = seq(100, 5000, 10))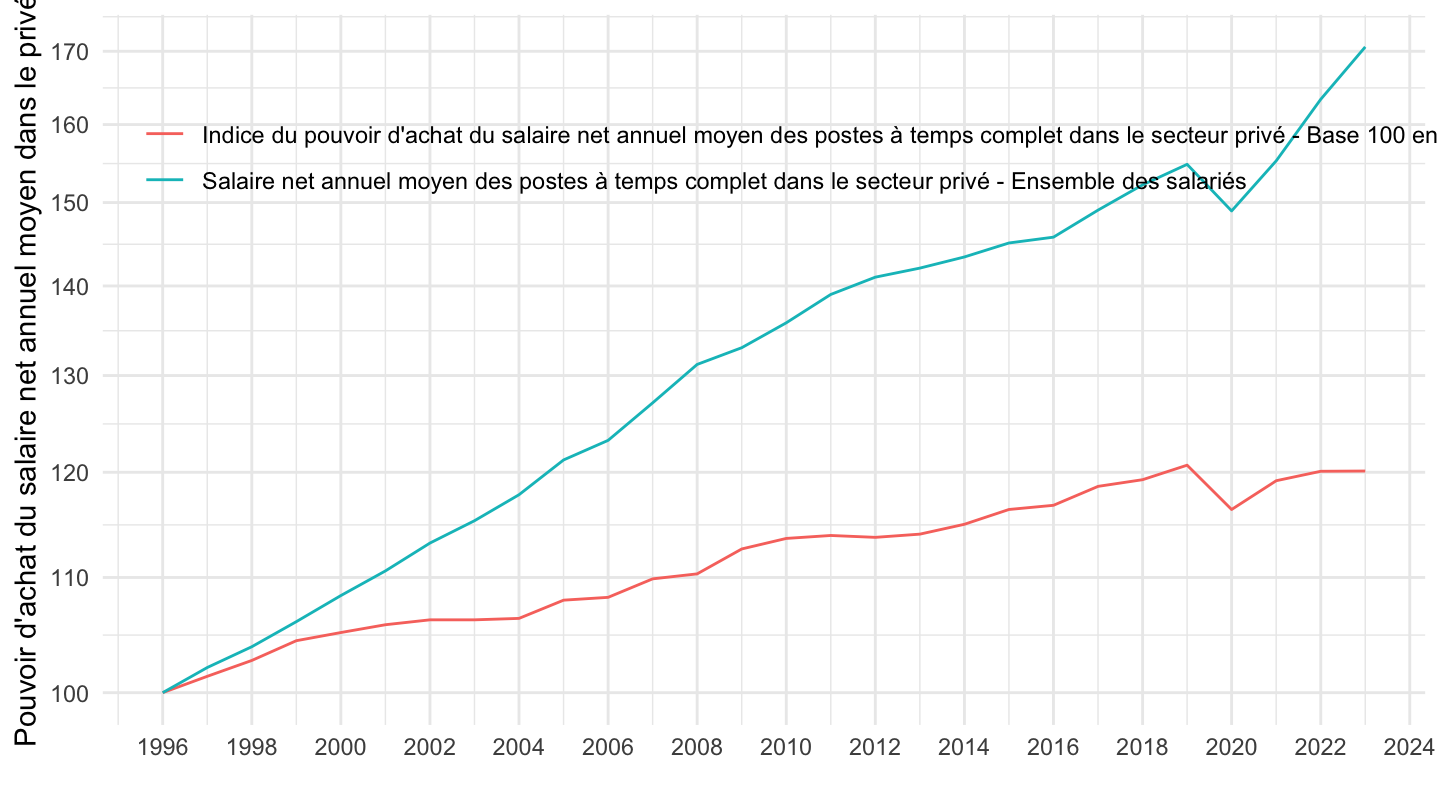
Tous
Code
`SALAIRES-ANNUELS` %>%
  filter(IDBANK %in% c("010752375", "010752366")) %>%
  year_to_date() %>%
  filter(date >= as.Date("1996-01-01")) %>%
  group_by(TITLE_FR) %>%
  arrange(date) %>%
  mutate(OBS_VALUE = 100*OBS_VALUE/OBS_VALUE[1]) %>%
  ggplot(.) + theme_minimal() +
  xlab("") + ylab("Pouvoir d'achat du salaire net annuel moyen dans le privé") +
  geom_line(aes(x = date, y = OBS_VALUE, color = TITLE_FR)) +
  theme(legend.title = element_blank(),
        legend.position = c(0.6, 0.8)) +
  scale_x_date(breaks = seq(1920, 2100, 2) %>% paste0("-01-01") %>% as.Date(),
               labels = date_format("%Y")) +
  scale_y_log10(breaks = seq(100, 5000, 10))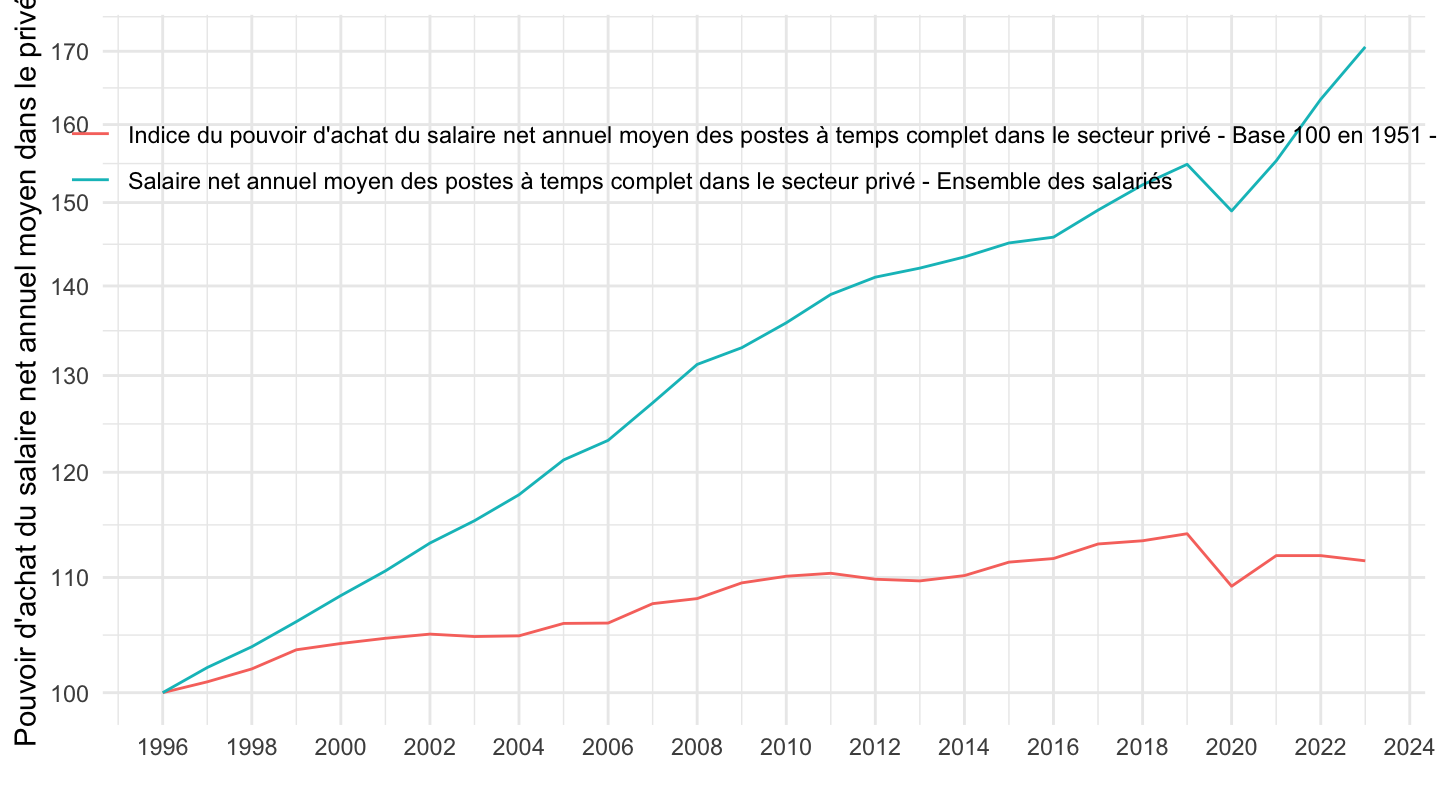
1999-
Code
`SALAIRES-ANNUELS` %>%
  filter(IDBANK %in% c("010752375", "010752366")) %>%
  year_to_date() %>%
  filter(date >= as.Date("1999-01-01")) %>%
  group_by(TITLE_FR) %>%
  arrange(date) %>%
  mutate(OBS_VALUE = 100*OBS_VALUE/OBS_VALUE[1]) %>%
  ggplot(.) + theme_minimal() +
  xlab("") + ylab("Pouvoir d'achat du salaire net annuel moyen dans le privé") +
  geom_line(aes(x = date, y = OBS_VALUE, color = TITLE_FR)) +
  theme(legend.title = element_blank(),
        legend.position = c(0.6, 0.8)) +
  scale_x_date(breaks = seq(1920, 2100, 2) %>% paste0("-01-01") %>% as.Date(),
               labels = date_format("%Y")) +
  scale_y_log10(breaks = seq(100, 5000, 10))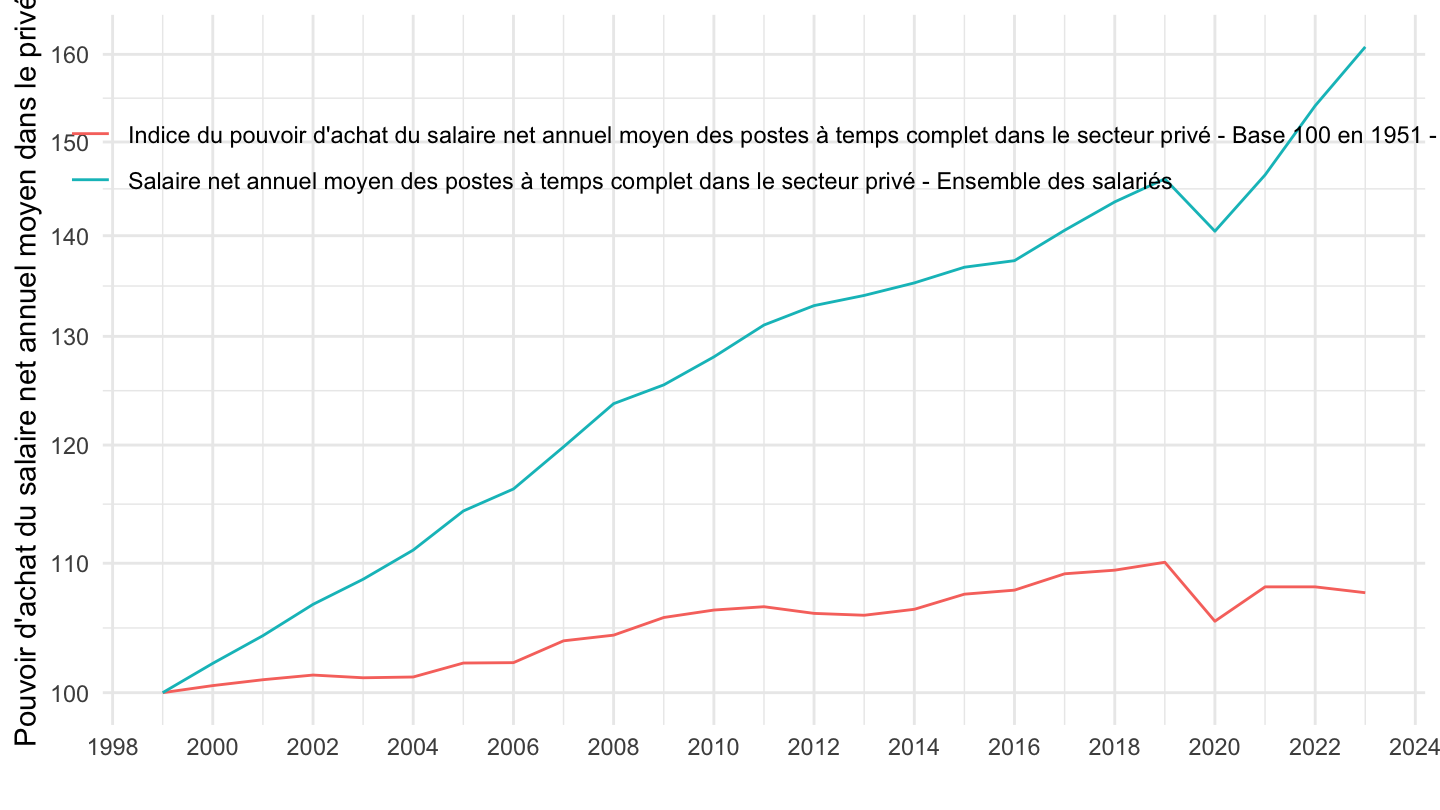
2008-
Code
`SALAIRES-ANNUELS` %>%
  filter(IDBANK %in% c("010752375", "010752366")) %>%
  year_to_date() %>%
  filter(date >= as.Date("2008-01-01")) %>%
  group_by(TITLE_FR) %>%
  arrange(date) %>%
  mutate(OBS_VALUE = 100*OBS_VALUE/OBS_VALUE[1]) %>%
  ggplot(.) + theme_minimal() +
  xlab("") + ylab("Pouvoir d'achat du salaire net annuel moyen dans le privé") +
  geom_line(aes(x = date, y = OBS_VALUE, color = TITLE_FR)) +
  theme(legend.title = element_blank(),
        legend.position = c(0.6, 0.8)) +
  scale_x_date(breaks = seq(1920, 2100, 1) %>% paste0("-01-01") %>% as.Date(),
               labels = date_format("%Y")) +
  scale_y_log10(breaks = seq(100, 5000, 2))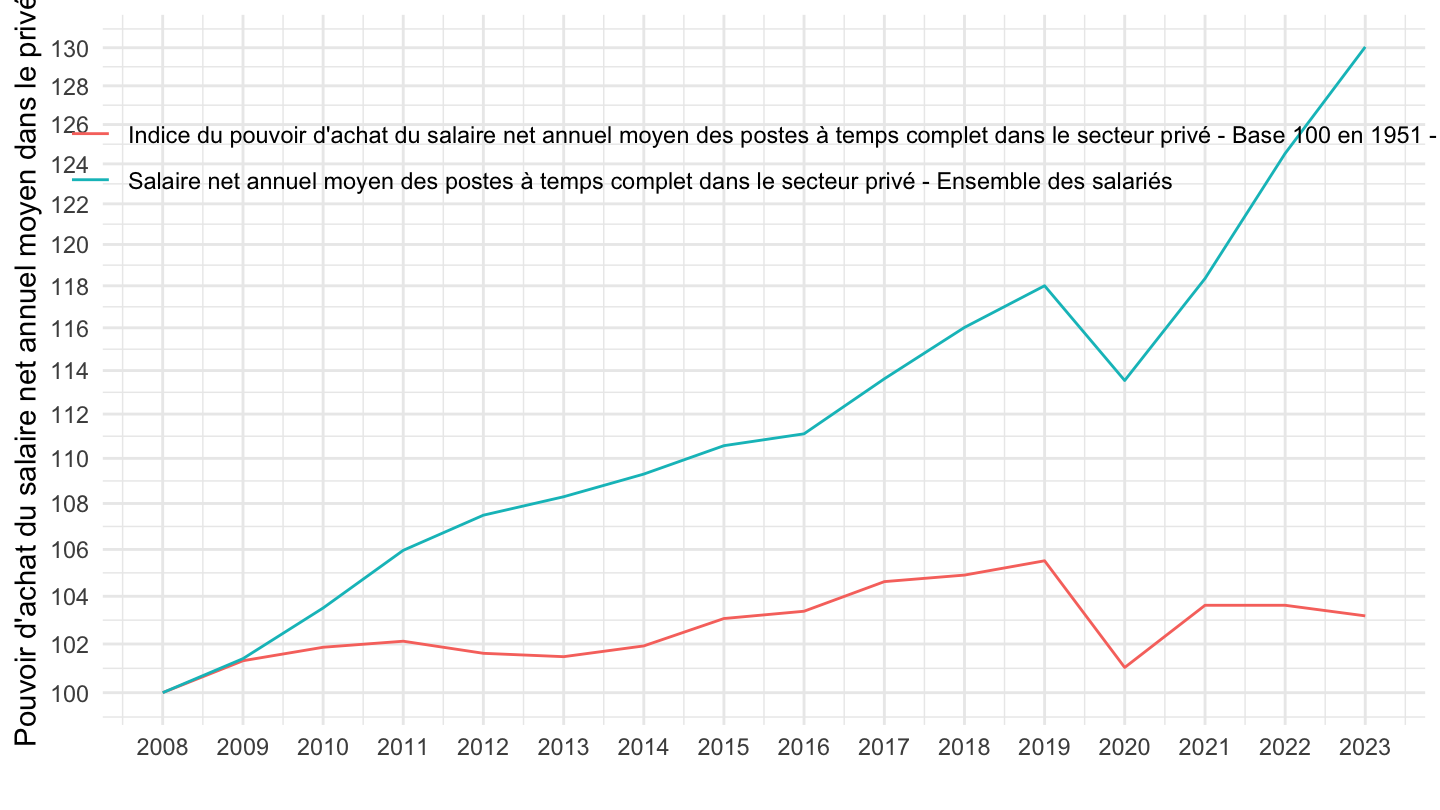
2017-
Code
`SALAIRES-ANNUELS` %>%
  filter(IDBANK %in% c("010752375", "010752366")) %>%
  year_to_date() %>%
  filter(date >= as.Date("2017-01-01")) %>%
  group_by(TITLE_FR) %>%
  arrange(date) %>%
  mutate(OBS_VALUE = 100*OBS_VALUE/OBS_VALUE[1]) %>%
  ggplot(.) + theme_minimal() +
  xlab("") + ylab("Pouvoir d'achat du salaire net annuel moyen dans le privé") +
  geom_line(aes(x = date, y = OBS_VALUE, color = TITLE_FR)) +
  theme(legend.title = element_blank(),
        legend.position = c(0.6, 0.8)) +
  scale_x_date(breaks = seq(1920, 2100, 1) %>% paste0("-01-01") %>% as.Date(),
               labels = date_format("%Y")) +
  scale_y_log10(breaks = seq(100, 5000, 2))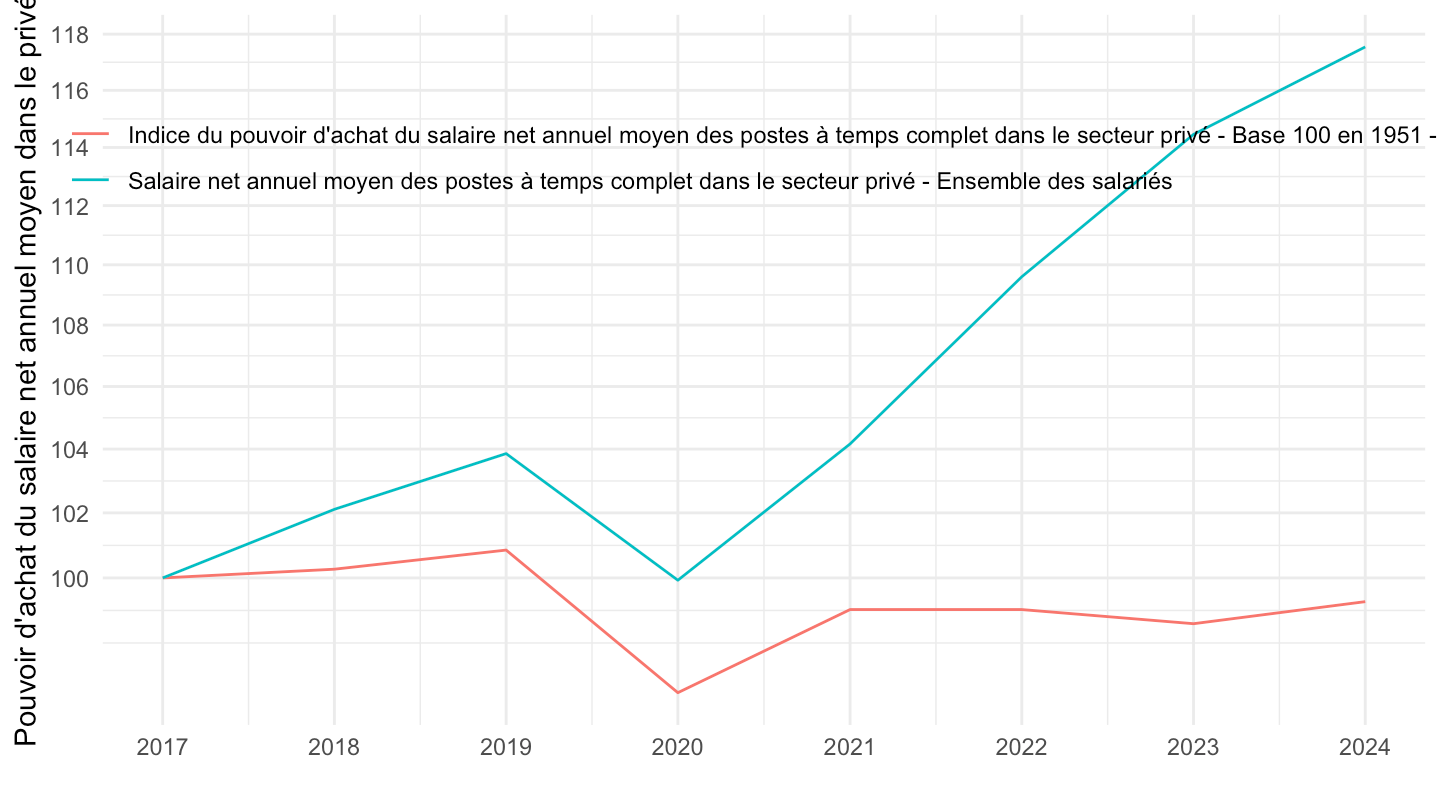
Indice des prix Implicite - 010752375, 010752366
Tous
Code
`SALAIRES-ANNUELS` %>%
  filter(IDBANK %in% c("010752375", "010752366")) %>%
  year_to_date() %>%
  select(date, IDBANK, OBS_VALUE) %>%
  spread(IDBANK, OBS_VALUE) %>%
  mutate(OBS_VALUE = `010752366` / `010752375`) %>%
  na.omit %>%
  mutate(OBS_VALUE = 100*OBS_VALUE/OBS_VALUE[1]) %>%
  ggplot(.) + theme_minimal() +
  xlab("") + ylab("Indice des prix implicite") +
  geom_line(aes(x = date, y = OBS_VALUE)) +
  theme(legend.title = element_blank(),
        legend.position = c(0.7, 0.8)) +
  scale_x_date(breaks = seq(1920, 2100, 5) %>% paste0("-01-01") %>% as.Date(),
               labels = date_format("%Y")) +
  scale_y_log10(breaks = c(100, 200, 500, 800, 1000, 1500, 2000, 5000, 10000, 20000))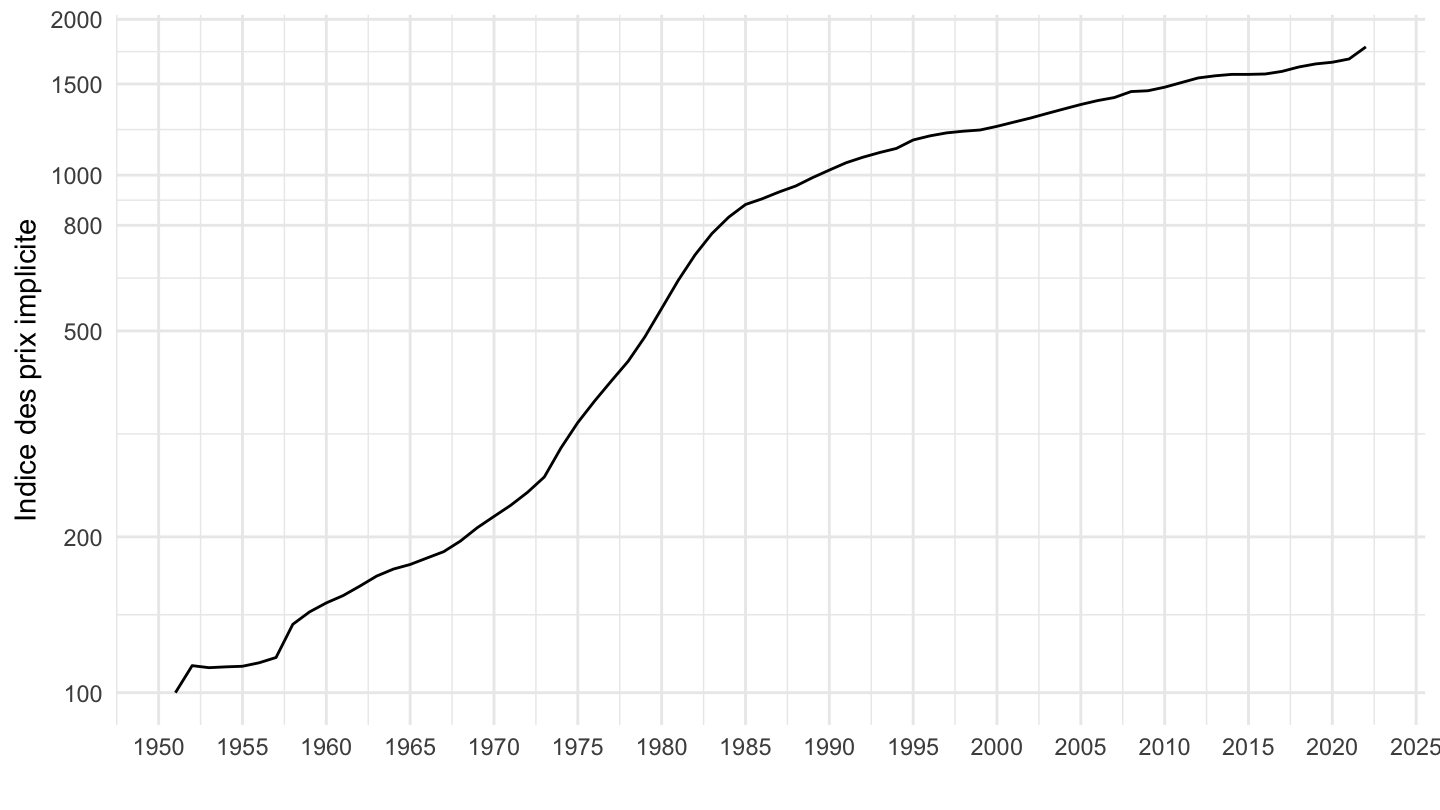
1975-
Code
`SALAIRES-ANNUELS` %>%
  filter(IDBANK %in% c("010752375", "010752366")) %>%
  year_to_date() %>%
  filter(date >= as.Date("1975-01-01")) %>%
  select(date, IDBANK, OBS_VALUE) %>%
  spread(IDBANK, OBS_VALUE) %>%
  mutate(OBS_VALUE = `010752366` / `010752375`) %>%
  na.omit %>%
  mutate(OBS_VALUE = 100*OBS_VALUE/OBS_VALUE[1]) %>%
  ggplot(.) + theme_minimal() +
  xlab("") + ylab("Indice des prix implicite") +
  geom_line(aes(x = date, y = OBS_VALUE)) +
  theme(legend.title = element_blank(),
        legend.position = c(0.7, 0.8)) +
  scale_x_date(breaks = seq(1920, 2100, 5) %>% paste0("-01-01") %>% as.Date(),
               labels = date_format("%Y")) +
  scale_y_log10(breaks = seq(100, 5000, 100))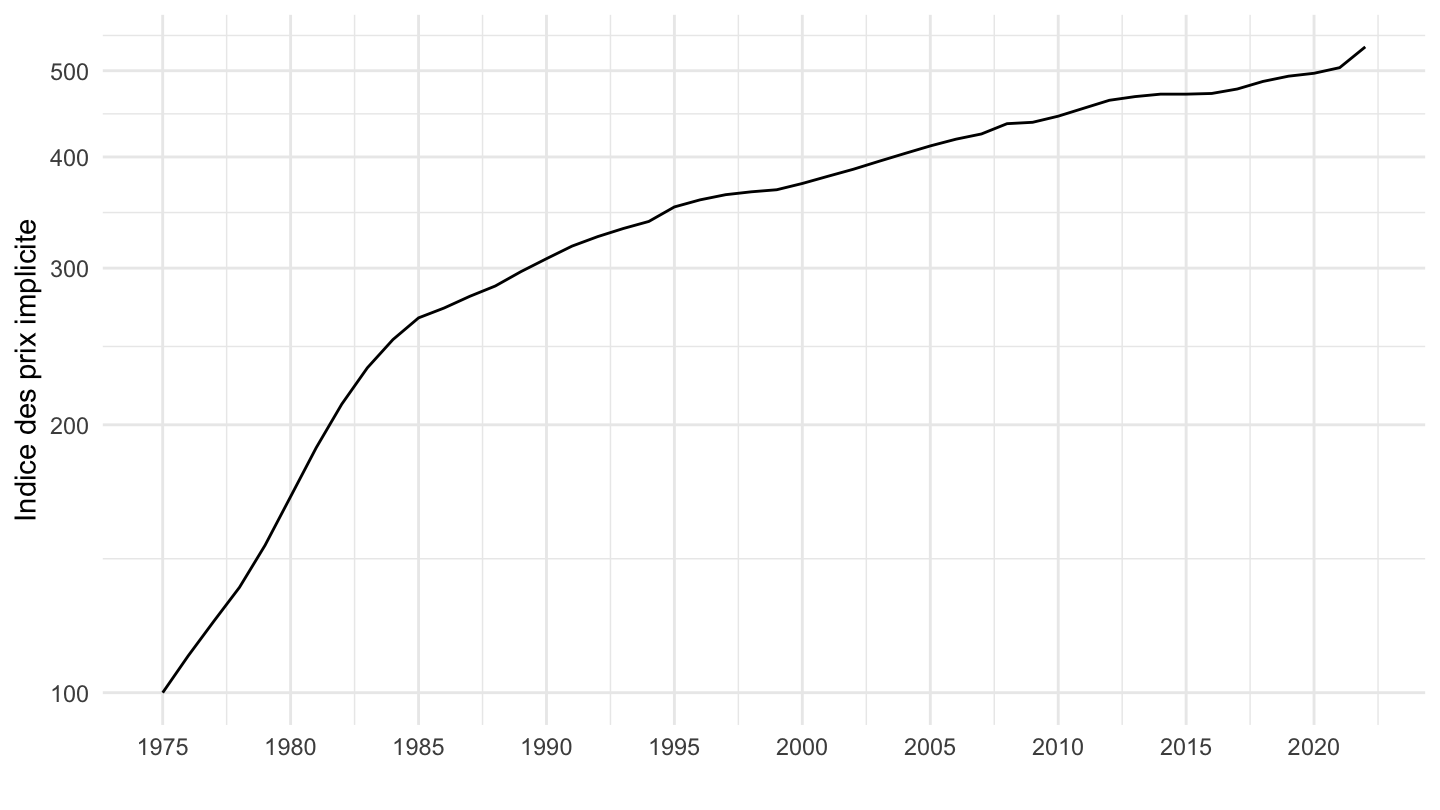
1984-
Code
`SALAIRES-ANNUELS` %>%
  filter(IDBANK %in% c("010752375", "010752366")) %>%
  year_to_date() %>%
  filter(date >= as.Date("1984-01-01")) %>%
  select(date, IDBANK, OBS_VALUE) %>%
  spread(IDBANK, OBS_VALUE) %>%
  mutate(OBS_VALUE = `010752366` / `010752375`) %>%
  na.omit %>%
  mutate(OBS_VALUE = 100*OBS_VALUE/OBS_VALUE[1]) %>%
  ggplot(.) + theme_minimal() +
  xlab("") + ylab("Indice des prix implicite") +
  geom_line(aes(x = date, y = OBS_VALUE)) +
  theme(legend.title = element_blank(),
        legend.position = c(0.7, 0.8)) +
  scale_x_date(breaks = seq(1920, 2100, 5) %>% paste0("-01-01") %>% as.Date(),
               labels = date_format("%Y")) +
  scale_y_log10(breaks = seq(100, 5000, 10))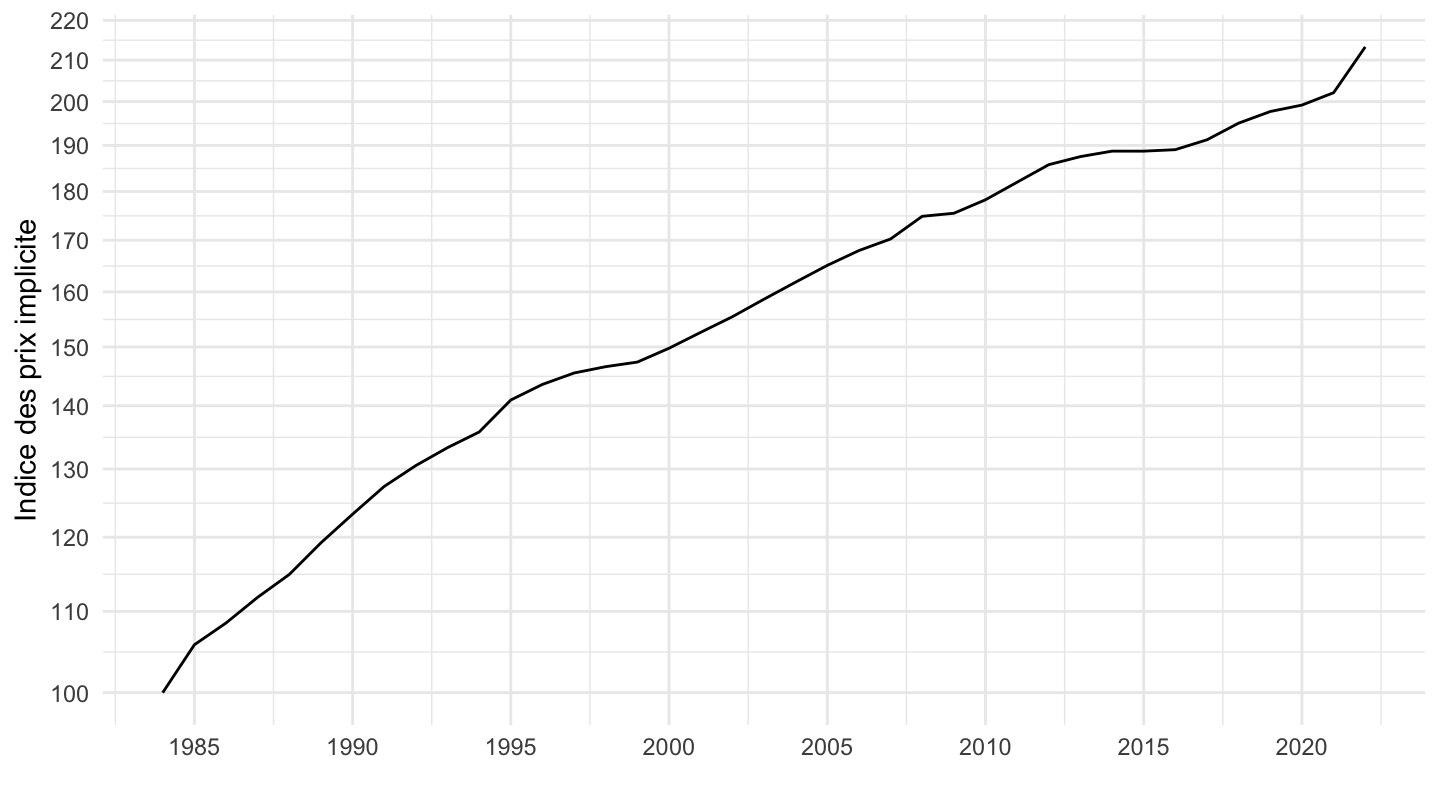
1990-
Code
`SALAIRES-ANNUELS` %>%
  filter(IDBANK %in% c("010752375", "010752366")) %>%
  year_to_date() %>%
  filter(date >= as.Date("1990-01-01")) %>%
  select(date, IDBANK, OBS_VALUE) %>%
  spread(IDBANK, OBS_VALUE) %>%
  mutate(OBS_VALUE = `010752366` / `010752375`) %>%
  na.omit %>%
  mutate(OBS_VALUE = 100*OBS_VALUE/OBS_VALUE[1]) %>%
  ggplot(.) + theme_minimal() +
  xlab("") + ylab("Indice des prix implicite") +
  geom_line(aes(x = date, y = OBS_VALUE)) +
  theme(legend.title = element_blank(),
        legend.position = c(0.6, 0.8)) +
  scale_x_date(breaks = seq(1920, 2100, 5) %>% paste0("-01-01") %>% as.Date(),
               labels = date_format("%Y")) +
  scale_y_log10(breaks = seq(100, 5000, 5))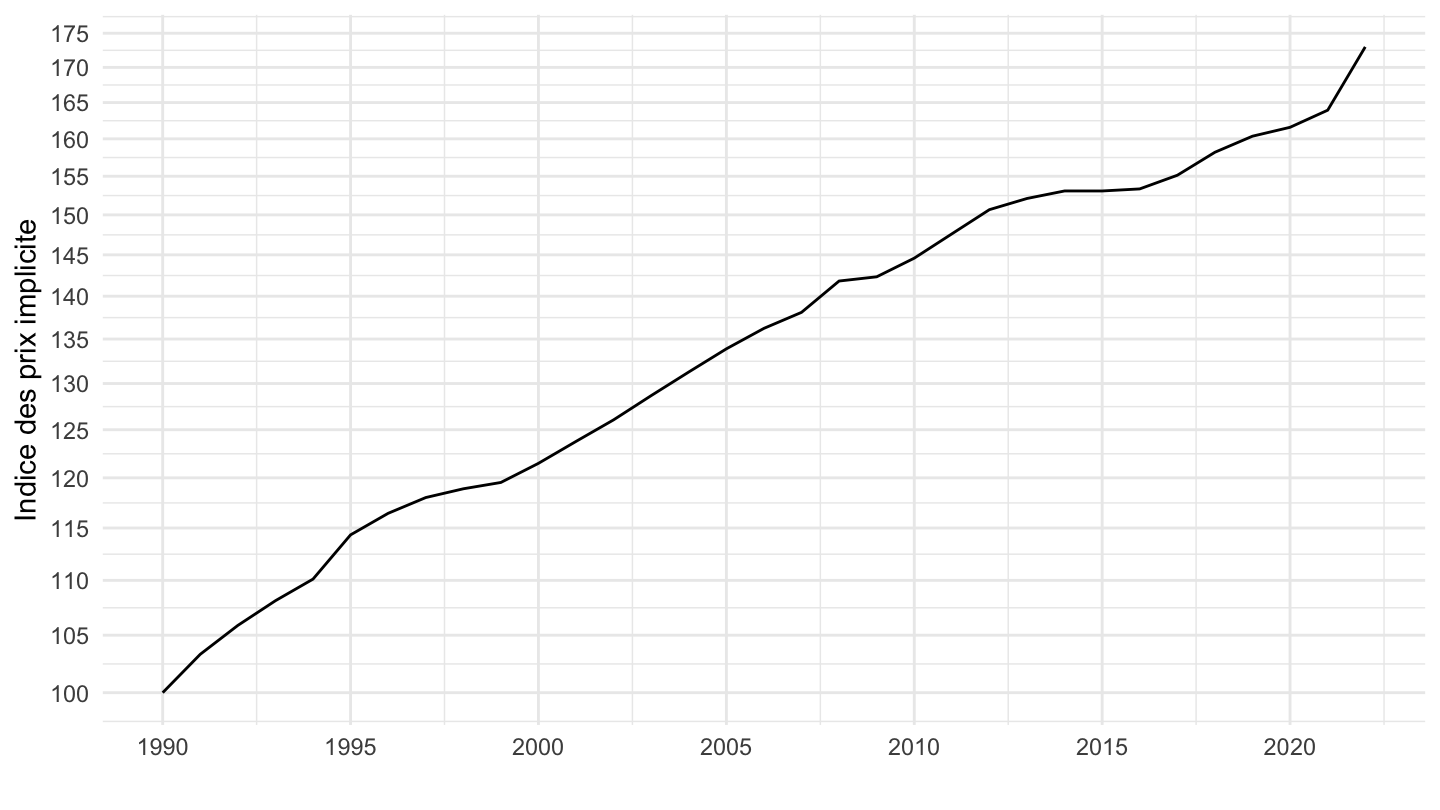
1993-
Code
`SALAIRES-ANNUELS` %>%
  filter(IDBANK %in% c("010752375", "010752366")) %>%
  year_to_date() %>%
  filter(date >= as.Date("1993-01-01")) %>%
  select(date, IDBANK, OBS_VALUE) %>%
  spread(IDBANK, OBS_VALUE) %>%
  mutate(OBS_VALUE = `010752366` / `010752375`) %>%
  na.omit %>%
  mutate(OBS_VALUE = 100*OBS_VALUE/OBS_VALUE[1]) %>%
  ggplot(.) + theme_minimal() +
  xlab("") + ylab("Indice des prix implicite") +
  geom_line(aes(x = date, y = OBS_VALUE)) +
  theme(legend.title = element_blank(),
        legend.position = c(0.6, 0.8)) +
  scale_x_date(breaks = seq(1993, 2100, 2) %>% paste0("-01-01") %>% as.Date(),
               labels = date_format("%Y")) +
  scale_y_log10(breaks = seq(100, 5000, 5)) +
  geom_text_repel(aes(x = date, y = OBS_VALUE, label = round(OBS_VALUE, 1)),
                  fontface ="plain", color = "black", size = 3)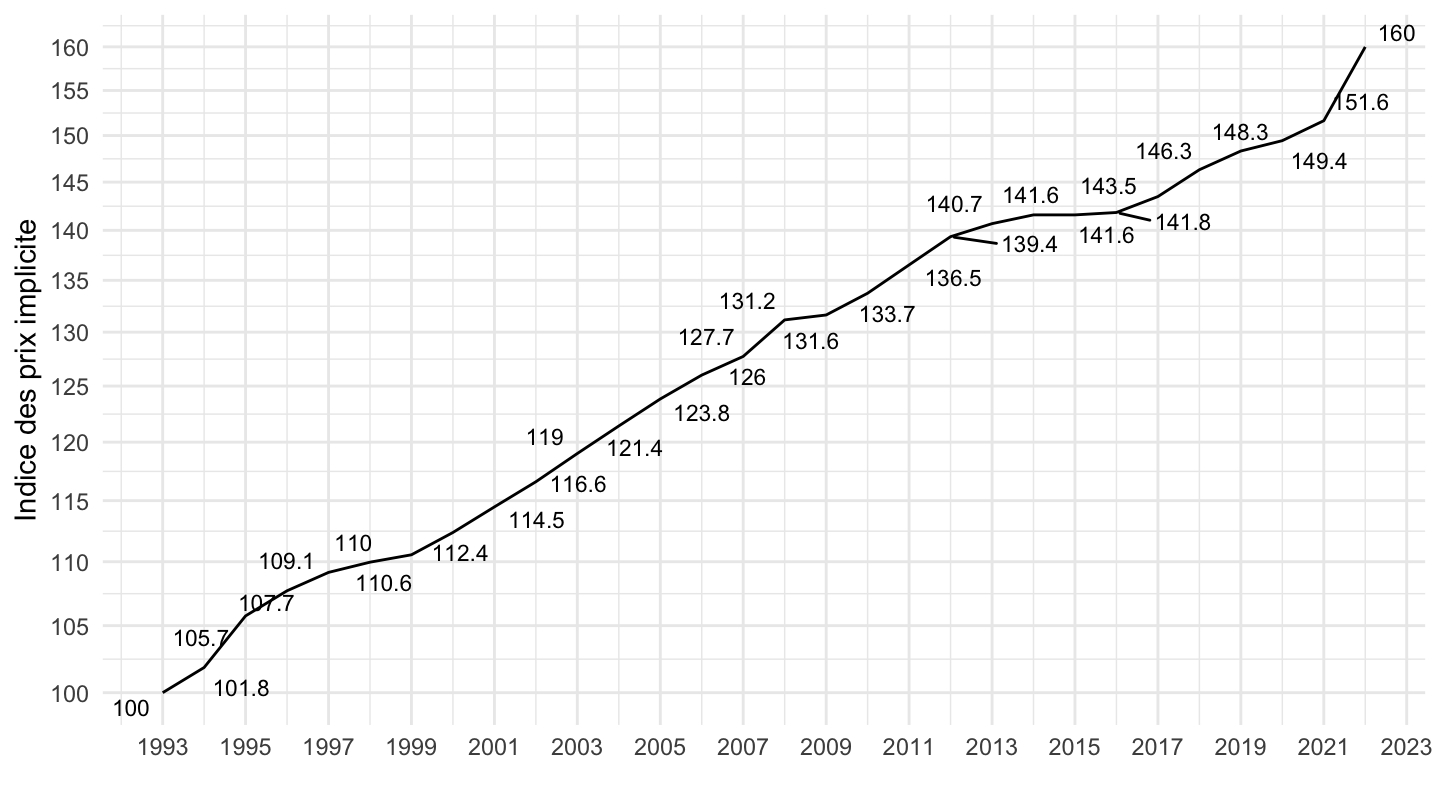
1996-
Exactement l’IPC !
Code
`SALAIRES-ANNUELS` %>%
  filter(IDBANK %in% c("010752375", "010752366")) %>%
  year_to_date() %>%
  filter(date >= as.Date("1996-01-01")) %>%
  select(date, IDBANK, OBS_VALUE) %>%
  spread(IDBANK, OBS_VALUE) %>%
  mutate(OBS_VALUE = `010752366` / `010752375`) %>%
  na.omit %>%
  mutate(OBS_VALUE = 100*OBS_VALUE/OBS_VALUE[1]) %>%
  ggplot(.) + theme_minimal() +
  xlab("") + ylab("Indice des prix implicite") +
  geom_line(aes(x = date, y = OBS_VALUE)) +
  theme(legend.title = element_blank(),
        legend.position = c(0.6, 0.8)) +
  scale_x_date(breaks = seq(1920, 2100, 2) %>% paste0("-01-01") %>% as.Date(),
               labels = date_format("%Y")) +
  scale_y_log10(breaks = seq(100, 5000, 5)) +
  geom_text_repel(aes(x = date, y = OBS_VALUE, label = round(OBS_VALUE, 1)),
                  fontface ="plain", color = "black", size = 3)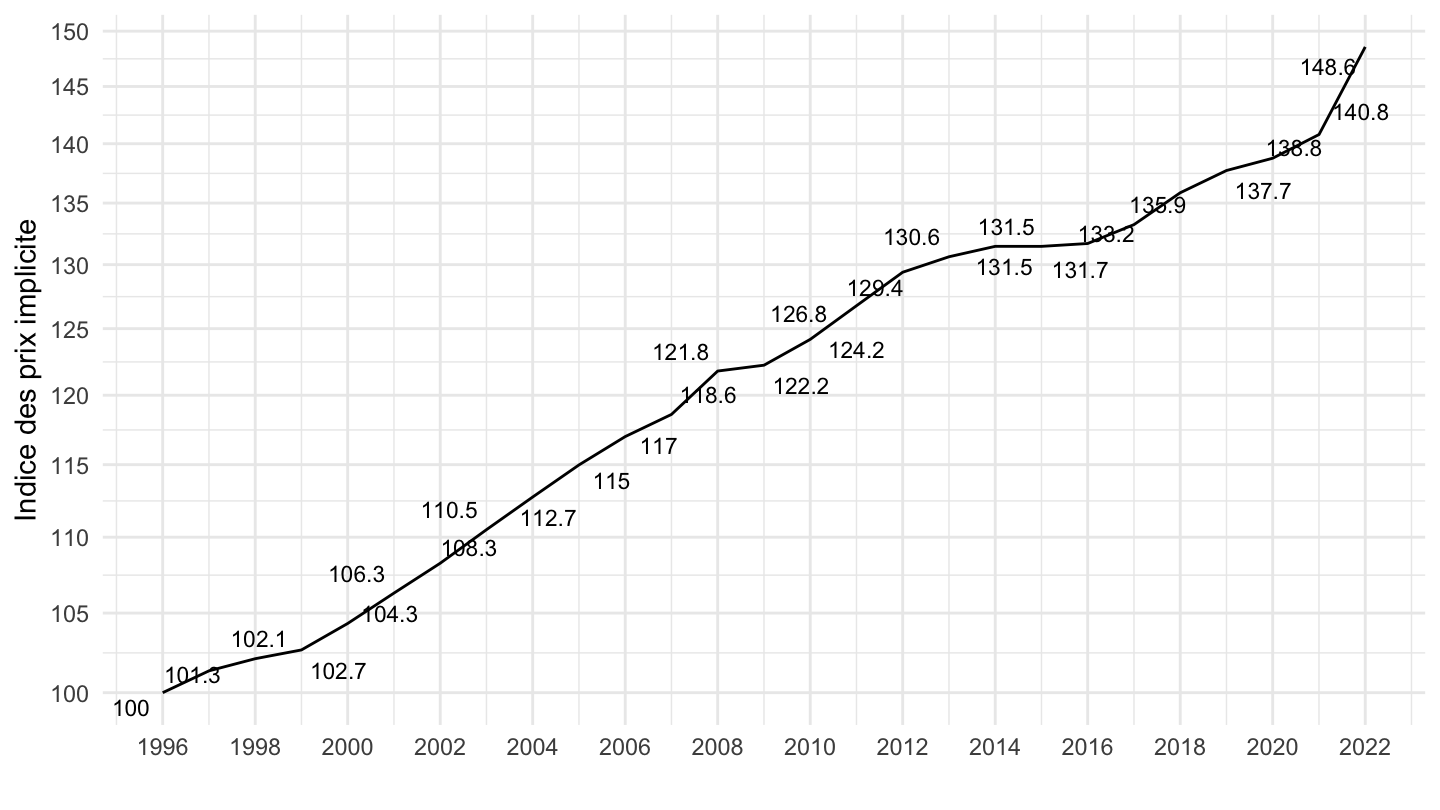
1999-
Code
`SALAIRES-ANNUELS` %>%
  filter(IDBANK %in% c("010752375", "010752366")) %>%
  year_to_date() %>%
  filter(date >= as.Date("1999-01-01")) %>%
  select(date, IDBANK, OBS_VALUE) %>%
  spread(IDBANK, OBS_VALUE) %>%
  mutate(OBS_VALUE = `010752366` / `010752375`) %>%
  na.omit %>%
  mutate(OBS_VALUE = 100*OBS_VALUE/OBS_VALUE[1]) %>%
  ggplot(.) + theme_minimal() +
  xlab("") + ylab("Indice des prix implicite") +
  geom_line(aes(x = date, y = OBS_VALUE)) +
  theme(legend.title = element_blank(),
        legend.position = c(0.6, 0.8)) +
  scale_x_date(breaks = seq(1920, 2100, 2) %>% paste0("-01-01") %>% as.Date(),
               labels = date_format("%Y")) +
  scale_y_log10(breaks = seq(100, 5000, 5))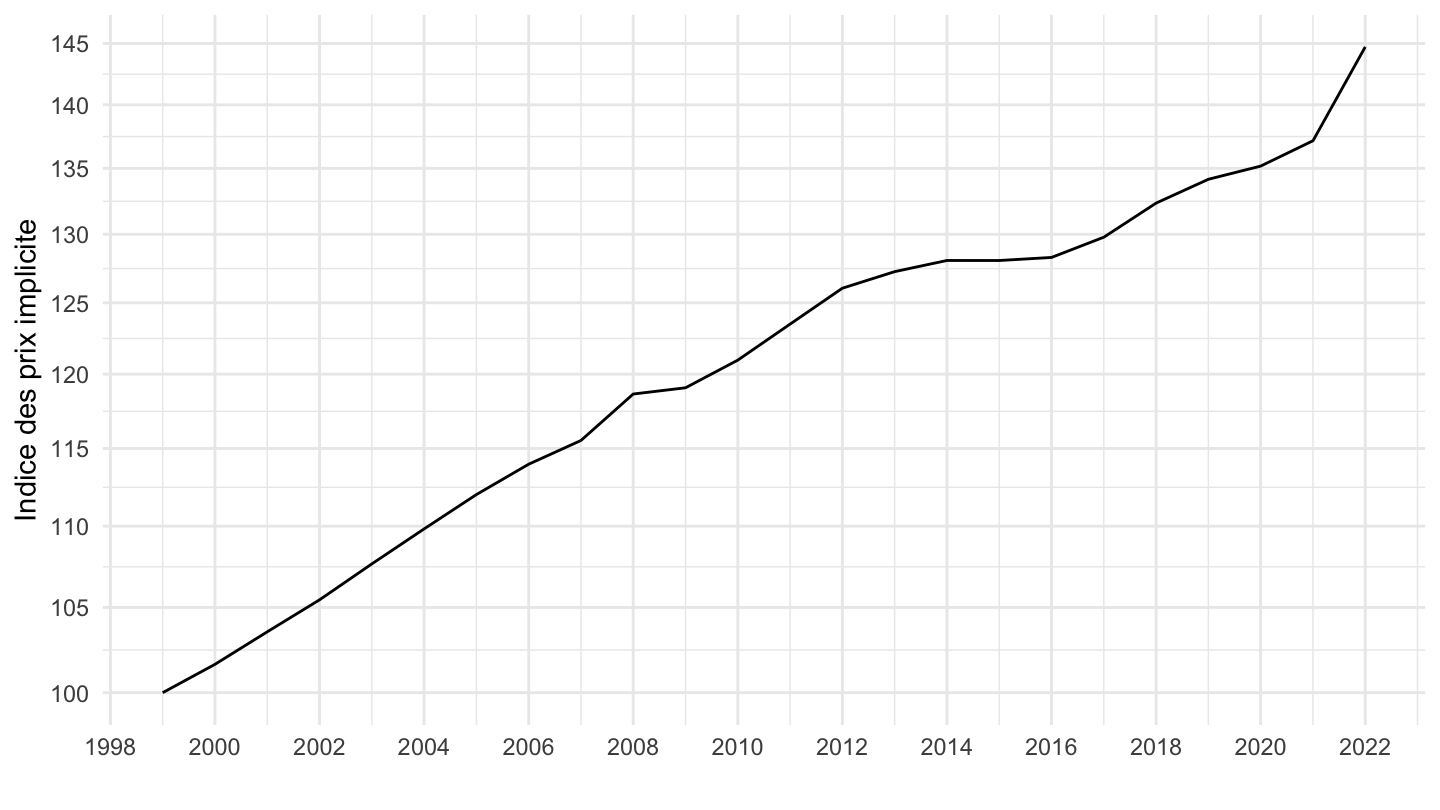
2017-
Code
`SALAIRES-ANNUELS` %>%
  filter(IDBANK %in% c("010752375", "010752366")) %>%
  year_to_date() %>%
  filter(date >= as.Date("2017-01-01")) %>%
  select(date, IDBANK, OBS_VALUE) %>%
  spread(IDBANK, OBS_VALUE) %>%
  mutate(OBS_VALUE = `010752366` / `010752375`) %>%
  na.omit %>%
  mutate(OBS_VALUE = 100*OBS_VALUE/OBS_VALUE[1]) %>%
  ggplot(.) + theme_minimal() +
  xlab("") + ylab("Indice des prix implicite") +
  geom_line(aes(x = date, y = OBS_VALUE)) +
  theme(legend.title = element_blank(),
        legend.position = c(0.6, 0.8)) +
  scale_x_date(breaks = seq(1920, 2100, 1) %>% paste0("-01-01") %>% as.Date(),
               labels = date_format("%Y")) +
  scale_y_log10(breaks = seq(100, 5000, 5))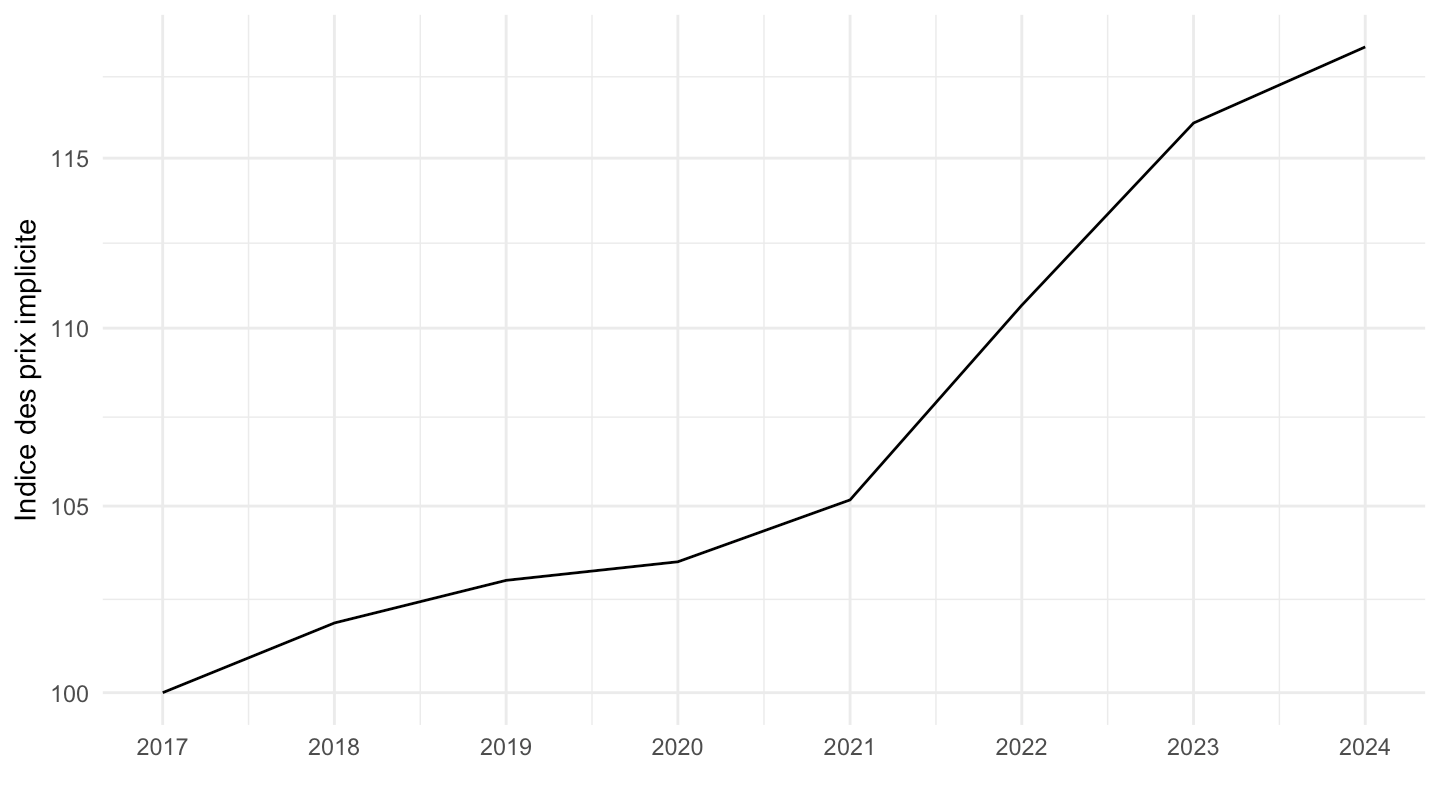
Indice du pouvoir d’achat du salaire net annuel moyen dans le secteur privé
Tous
Log
Code
plot_log <- `SALAIRES-ANNUELS` %>%
  filter(IDBANK == "010752375") %>%
  year_to_date() %>%
  ggplot(.) + theme_minimal() +
  xlab("") + ylab("") +
  geom_line(aes(x = date, y = OBS_VALUE)) +
  theme(legend.title = element_blank(),
        legend.position = c(0.7, 0.8)) +
  scale_x_date(breaks = seq(1920, 2100, 10) %>% paste0("-01-01") %>% as.Date(),
               labels = date_format("%Y")) +
  scale_y_log10(breaks = seq(100, 1000, 20))

plot_log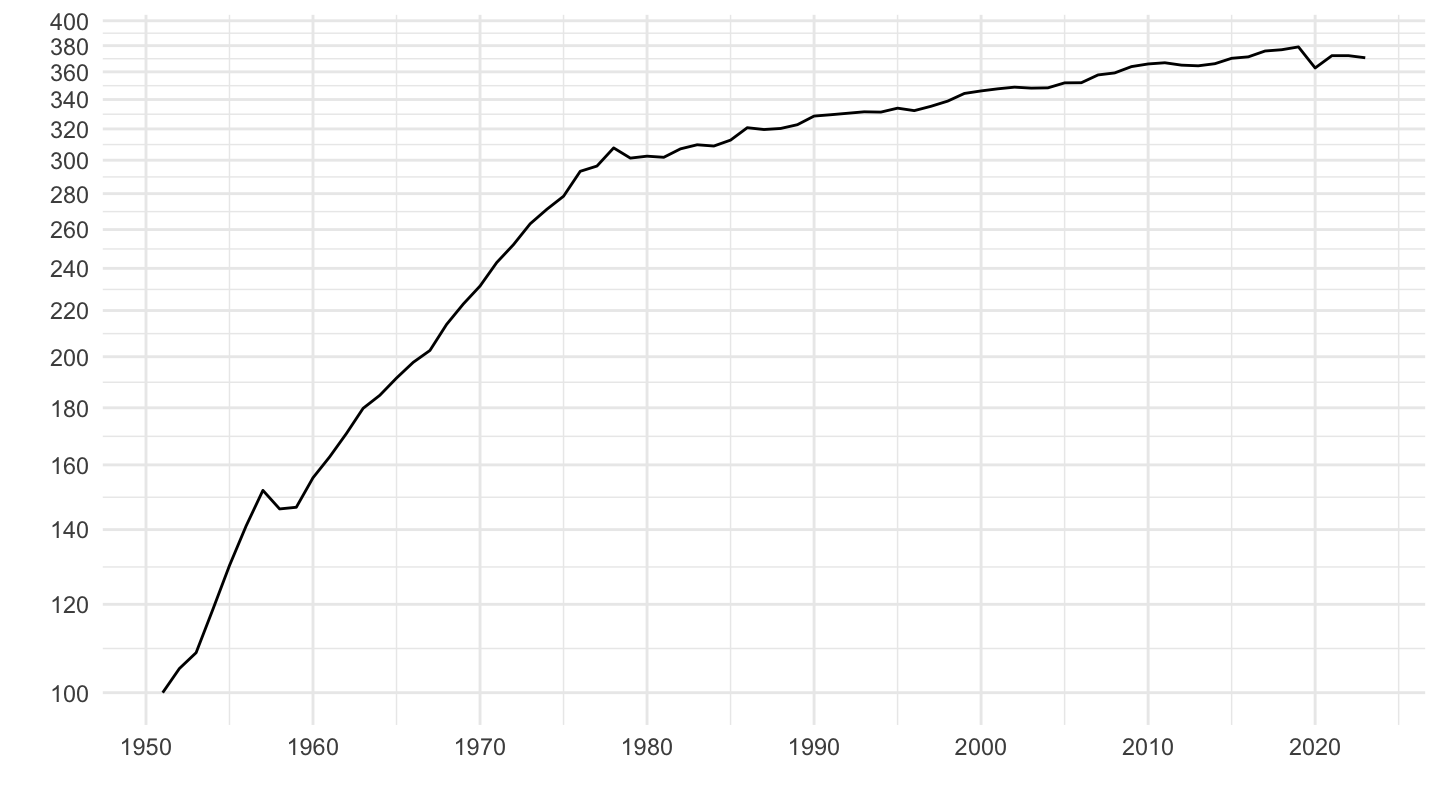
Linear
Code
plot_linear <- plot_log + ylab("Pouvoir d'achat du salaire net annuel moyen dans le privé") +
  scale_y_continuous(breaks = seq(100, 1000, 20))

plot_linear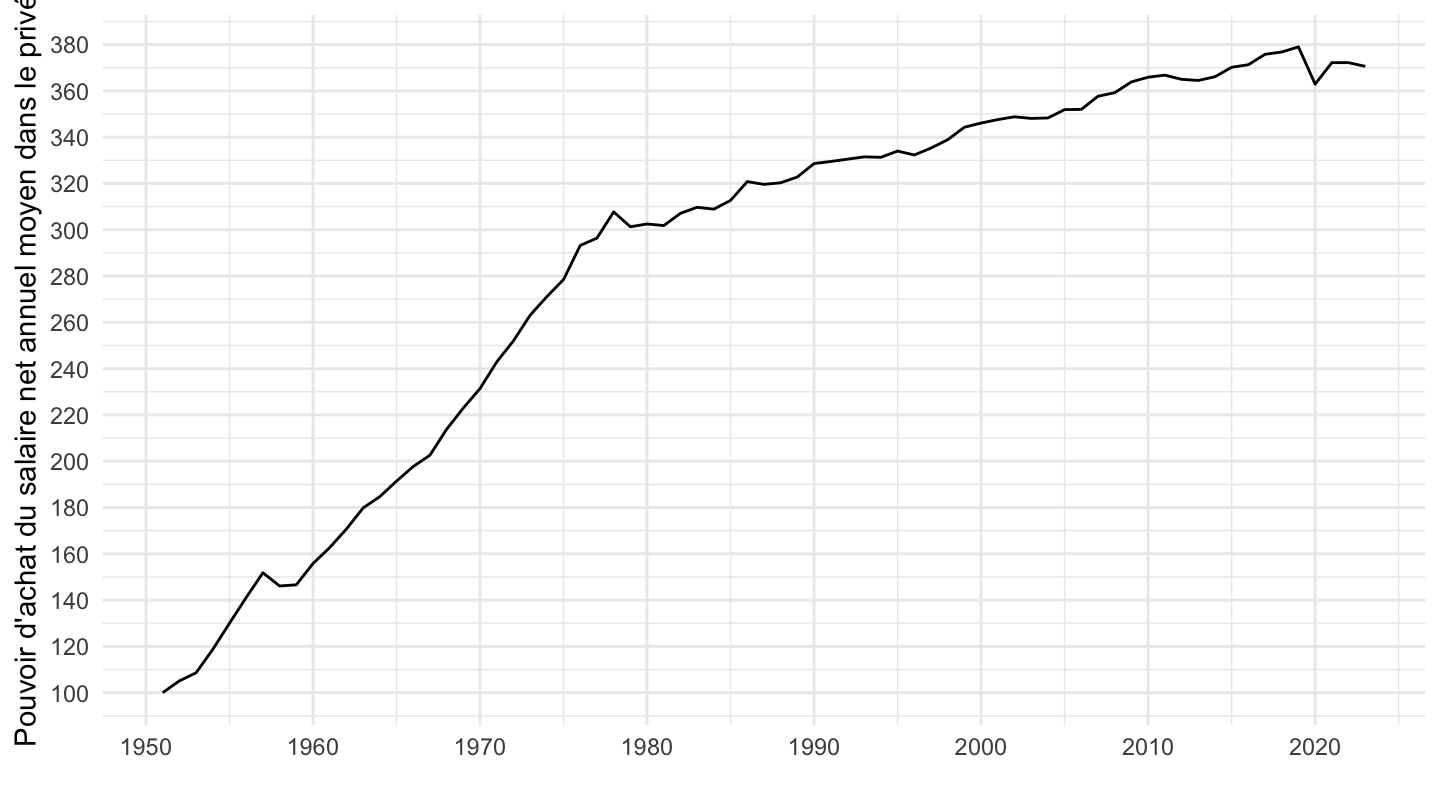
Both
Code
ggpubr::ggarrange(plot_linear + ggtitle("Linear plot"), plot_log + ggtitle("Log plot"))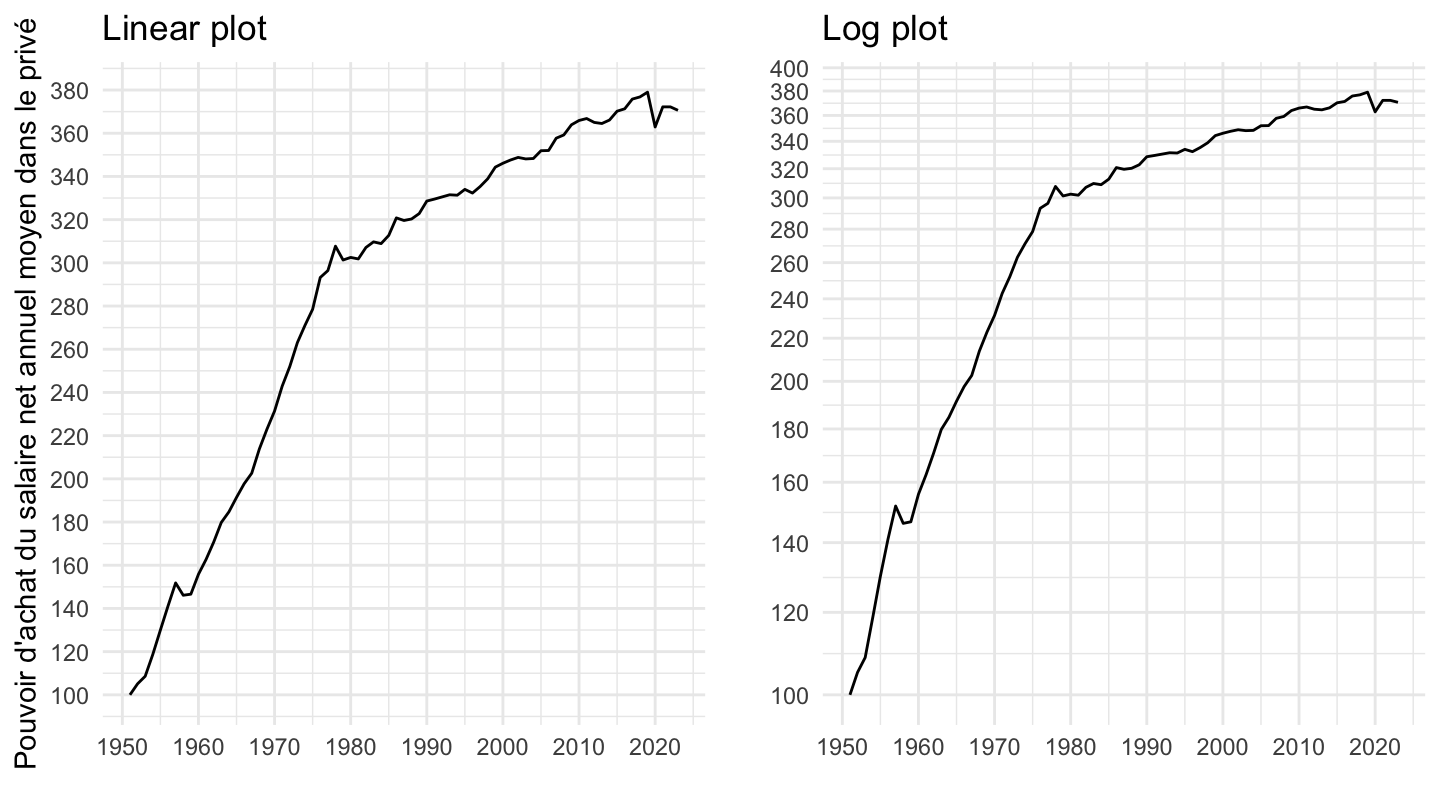
1965-
Code
`SALAIRES-ANNUELS` %>%
  filter(IDBANK == "010752375") %>%
  year_to_date() %>%
  filter(date >= as.Date("1965-01-01")) %>%
  mutate(OBS_VALUE = 100*OBS_VALUE/OBS_VALUE[date == as.Date("1965-01-01")]) %>%
  ggplot(.) + theme_minimal() +
  xlab("") + ylab("Pouvoir d'achat du salaire net annuel moyen dans le privé") +
  geom_line(aes(x = date, y = OBS_VALUE)) +
  theme(legend.title = element_blank(),
        legend.position = c(0.7, 0.8)) +
  scale_x_date(breaks = seq(1920, 2100, 5) %>% paste0("-01-01") %>% as.Date(),
               labels = date_format("%Y")) +
  scale_y_log10(breaks = seq(100, 1000, 10))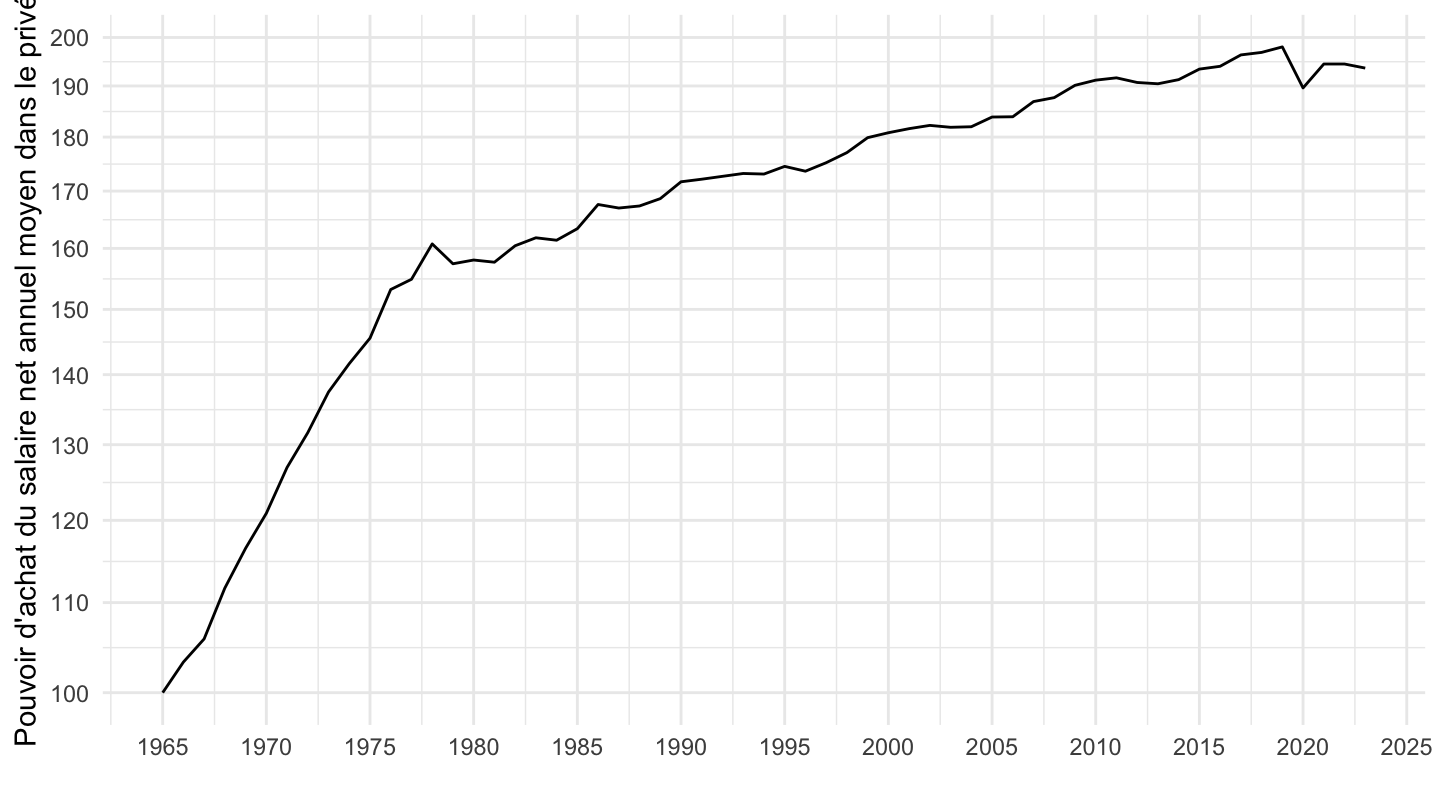
1975-
Code
`SALAIRES-ANNUELS` %>%
  filter(IDBANK == "010752375") %>%
  year_to_date() %>%
  filter(date >= as.Date("1975-01-01")) %>%
  mutate(OBS_VALUE = 100*OBS_VALUE/OBS_VALUE[date == as.Date("1975-01-01")]) %>%
  ggplot(.) + theme_minimal() +
  xlab("") + ylab("Pouvoir d'achat du salaire net annuel moyen dans le privé") +
  geom_line(aes(x = date, y = OBS_VALUE)) +
  theme(legend.title = element_blank(),
        legend.position = c(0.7, 0.8)) +
  scale_x_date(breaks = seq(1920, 2100, 5) %>% paste0("-01-01") %>% as.Date(),
               labels = date_format("%Y")) +
  scale_y_log10(breaks = seq(100, 1000, 2))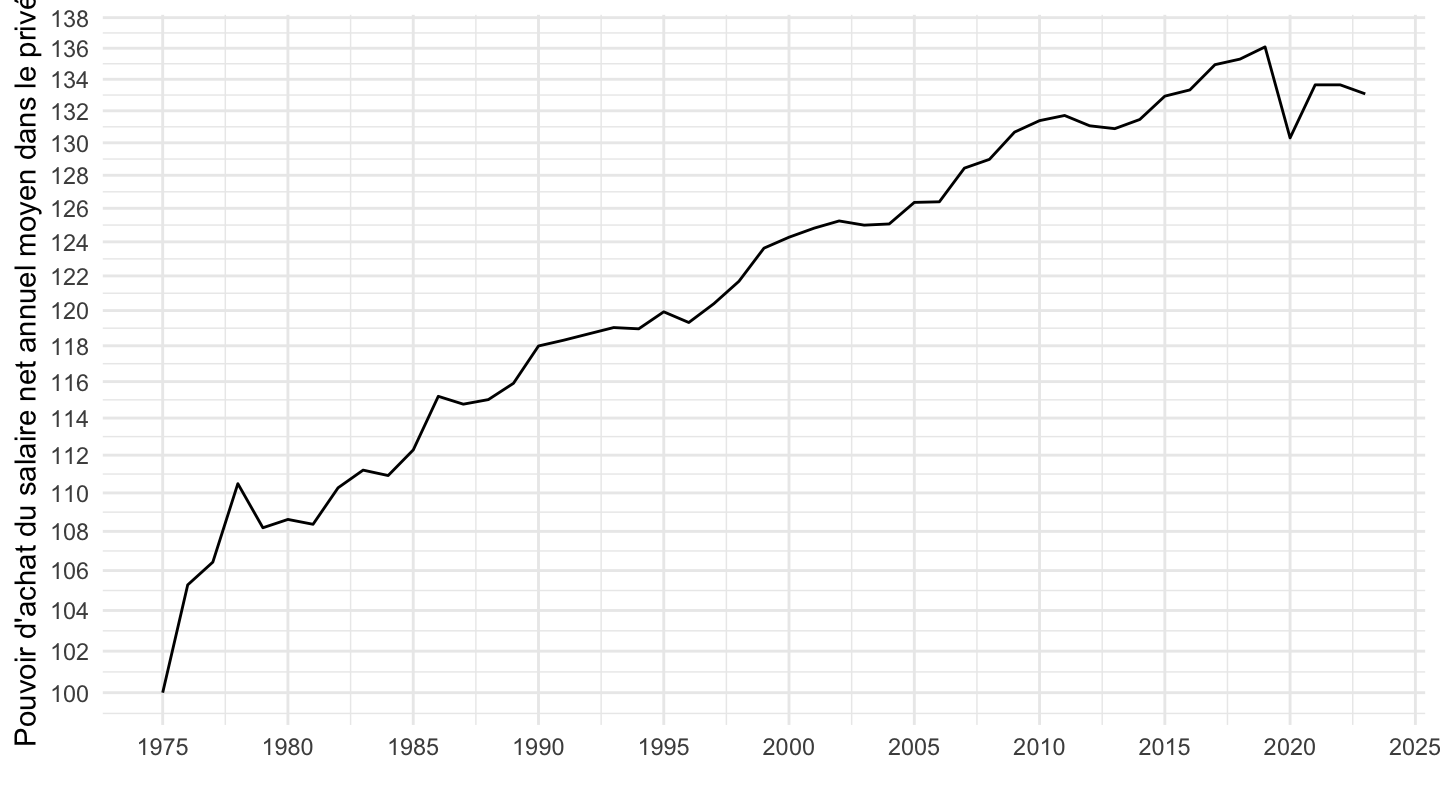
1984-
Code
`SALAIRES-ANNUELS` %>%
  filter(IDBANK == "010752375") %>%
  year_to_date() %>%
  filter(date >= as.Date("1984-01-01")) %>%
  mutate(OBS_VALUE = 100*OBS_VALUE/OBS_VALUE[date == as.Date("1984-01-01")]) %>%
  ggplot(.) + theme_minimal() +
  xlab("") + ylab("Pouvoir d'achat du salaire net annuel moyen dans le privé") +
  geom_line(aes(x = date, y = OBS_VALUE)) +
  theme(legend.title = element_blank(),
        legend.position = c(0.7, 0.8)) +
  scale_x_date(breaks = seq(1920, 2100, 5) %>% paste0("-01-01") %>% as.Date(),
               labels = date_format("%Y")) +
  scale_y_log10(breaks = seq(100, 1000, 2))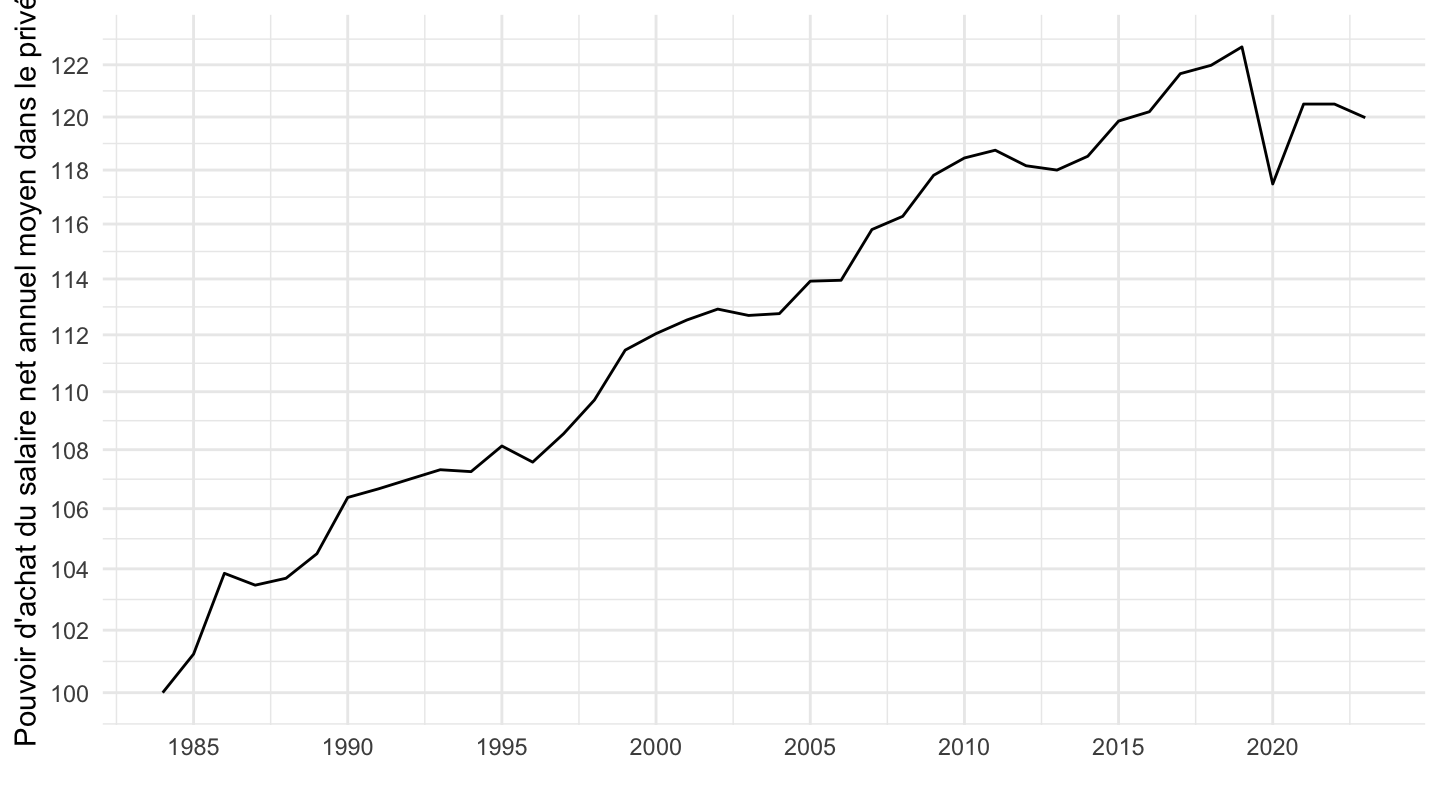
1990-
Code
`SALAIRES-ANNUELS` %>%
  filter(IDBANK == "010752375") %>%
  year_to_date() %>%
  filter(date >= as.Date("1990-01-01")) %>%
  mutate(OBS_VALUE = 100*OBS_VALUE/OBS_VALUE[date == as.Date("1990-01-01")]) %>%
  ggplot(.) + theme_minimal() +
  xlab("") + ylab("Pouvoir d'achat du salaire net annuel moyen dans le privé") +
  geom_line(aes(x = date, y = OBS_VALUE)) +
  theme(legend.title = element_blank(),
        legend.position = c(0.7, 0.8)) +
  scale_x_date(breaks = seq(1920, 2100, 5) %>% paste0("-01-01") %>% as.Date(),
               labels = date_format("%Y")) +
  scale_y_log10(breaks = seq(100, 1000, 2)) +
  geom_text_repel(aes(x = date, y = OBS_VALUE, label = round(OBS_VALUE, 1)),
                  fontface ="plain", color = "black", size = 3)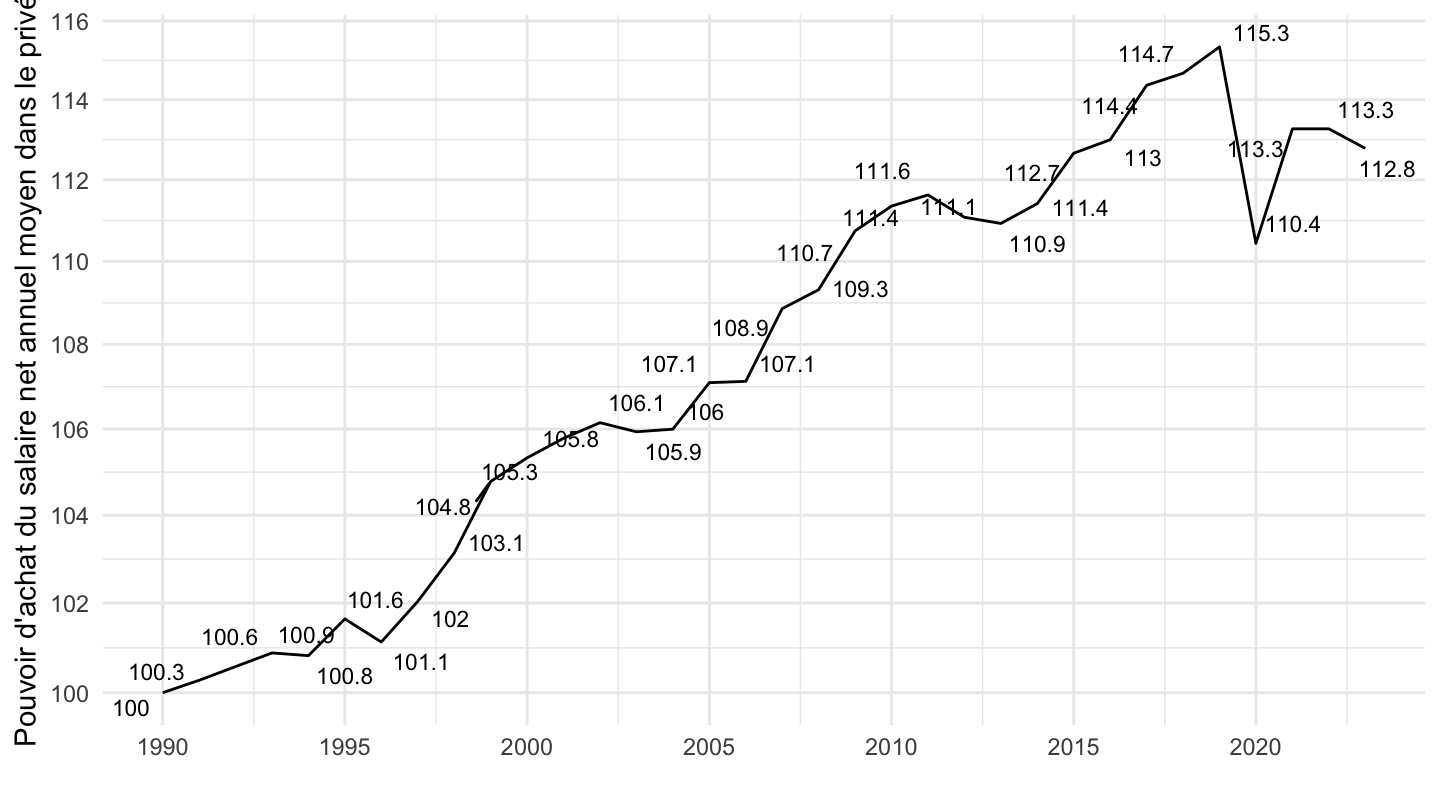
1993-
Code
`SALAIRES-ANNUELS` %>%
  filter(IDBANK == "010752375") %>%
  year_to_date() %>%
  filter(date >= as.Date("1993-01-01")) %>%
  mutate(OBS_VALUE = 100*OBS_VALUE/OBS_VALUE[date == as.Date("1993-01-01")]) %>%
  ggplot(.) + theme_minimal() +
  xlab("") + ylab("Pouvoir d'achat du salaire net annuel moyen dans le privé") +
  geom_line(aes(x = date, y = OBS_VALUE)) +
  theme(legend.title = element_blank(),
        legend.position = c(0.7, 0.8)) +
  scale_x_date(breaks = seq(1993, 2100, 5) %>% paste0("-01-01") %>% as.Date(),
               labels = date_format("%Y")) +
  scale_y_log10(breaks = seq(100, 1000, 2)) +
  geom_text_repel(aes(x = date, y = OBS_VALUE, label = round(OBS_VALUE, 1)),
                  fontface ="plain", color = "black", size = 3)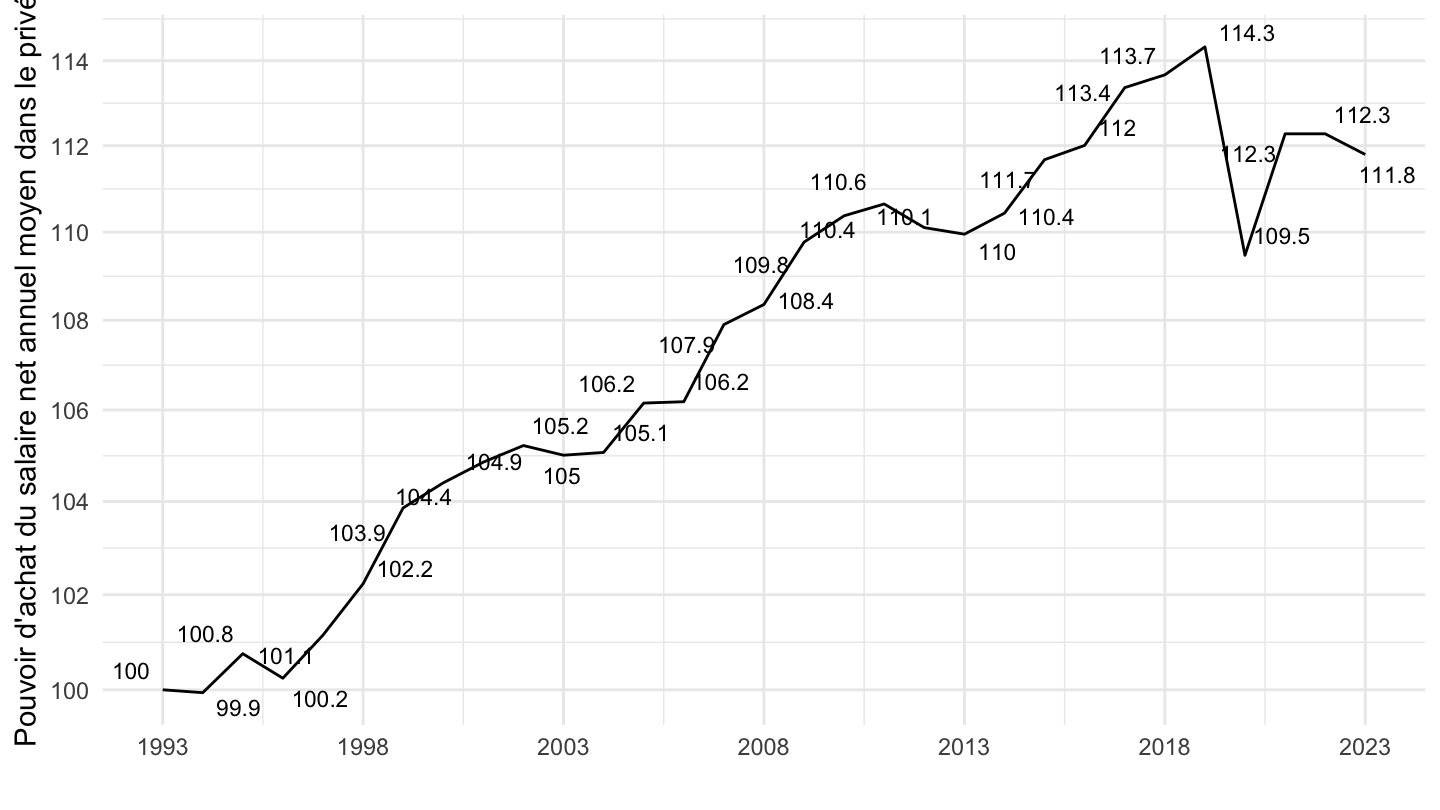
1996-
Salaire net moyen= + 10%
Salaire net moyen en EQTP =
Code
`SALAIRES-ANNUELS` %>%
  filter(IDBANK == "010752375") %>%
  year_to_date() %>%
  filter(date >= as.Date("1996-01-01")) %>%
  mutate(OBS_VALUE = 100*OBS_VALUE/OBS_VALUE[date == as.Date("1996-01-01")]) %>%
  ggplot(.) + theme_minimal() +
  xlab("") + ylab("Pouvoir d'achat du salaire net annuel moyen dans le privé") +
  geom_line(aes(x = date, y = OBS_VALUE)) +
  theme(legend.title = element_blank(),
        legend.position = c(0.7, 0.8)) +
  scale_x_date(breaks = seq(1920, 2100, 2) %>% paste0("-01-01") %>% as.Date(),
               labels = date_format("%Y")) +
  scale_y_log10(breaks = seq(100, 1000, 2)) +
  geom_text_repel(aes(x = date, y = OBS_VALUE, label = round(OBS_VALUE, 1)),
                  fontface ="plain", color = "black", size = 3)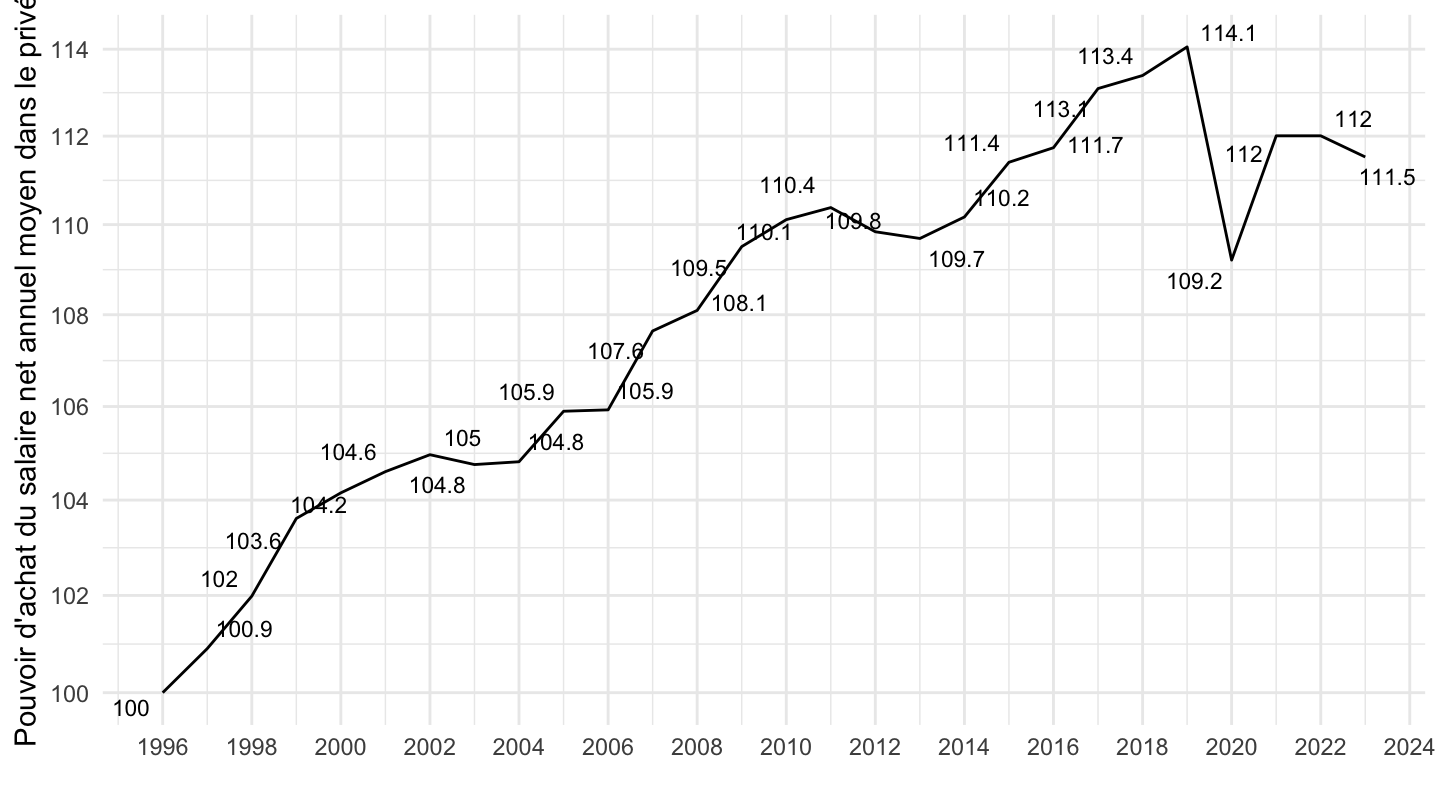
1999-
Code
`SALAIRES-ANNUELS` %>%
  filter(IDBANK == "010752375") %>%
  year_to_date() %>%
  filter(date >= as.Date("1999-01-01")) %>%
  arrange(date) %>%
  mutate(OBS_VALUE = 100*OBS_VALUE/OBS_VALUE[1]) %>%
  ggplot(.) + theme_minimal() +
  xlab("") + ylab("Pouvoir d'achat du salaire net annuel moyen dans le privé") +
  geom_line(aes(x = date, y = OBS_VALUE)) +
  theme(legend.title = element_blank(),
        legend.position = c(0.7, 0.8)) +
  scale_x_date(breaks = seq(1920, 2100, 2) %>% paste0("-01-01") %>% as.Date(),
               labels = date_format("%Y")) +
  scale_y_log10(breaks = seq(100, 1000, 2)) +
  geom_text_repel(aes(x = date, y = OBS_VALUE, label = round(OBS_VALUE, 1)),
                  fontface ="plain", color = "black", size = 3)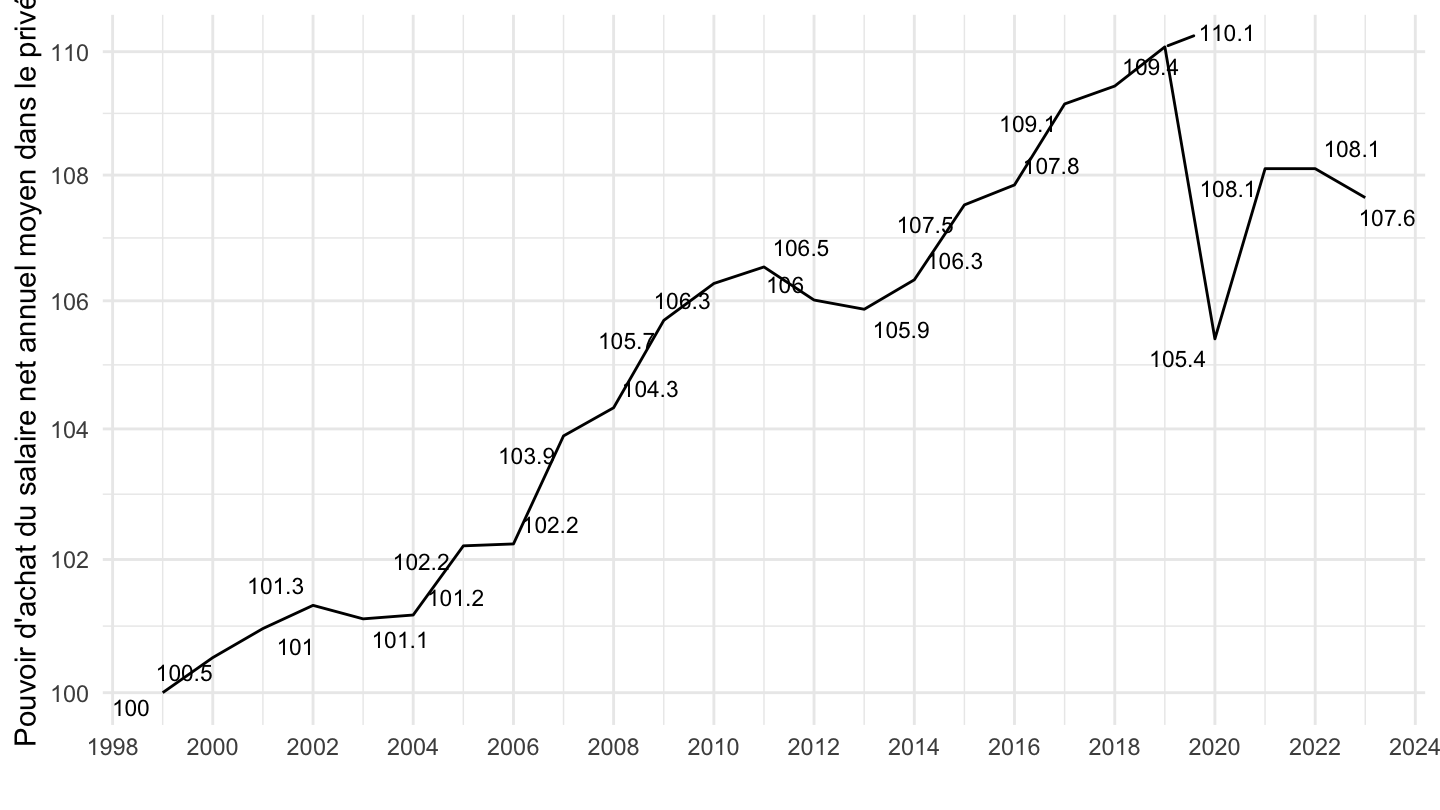
2008- (15 ans)
Code
`SALAIRES-ANNUELS` %>%
  filter(IDBANK == "010752375") %>%
  year_to_date() %>%
  filter(date >= as.Date("2008-01-01")) %>%
  arrange(date) %>%
  mutate(OBS_VALUE = 100*OBS_VALUE/OBS_VALUE[1]) %>%
  ggplot(.) + theme_minimal() +
  xlab("") + ylab("Pouvoir d'achat du salaire net annuel moyen dans le privé") +
  geom_line(aes(x = date, y = OBS_VALUE)) +
  theme(legend.title = element_blank(),
        legend.position = c(0.7, 0.8)) +
  scale_x_date(breaks = seq(1920, 2100, 1) %>% paste0("-01-01") %>% as.Date(),
               labels = date_format("%Y")) +
  scale_y_log10(breaks = seq(100, 1000, 1)) +
  geom_text_repel(aes(x = date, y = OBS_VALUE, label = round(OBS_VALUE, 1)),
                  fontface ="plain", color = "black", size = 3)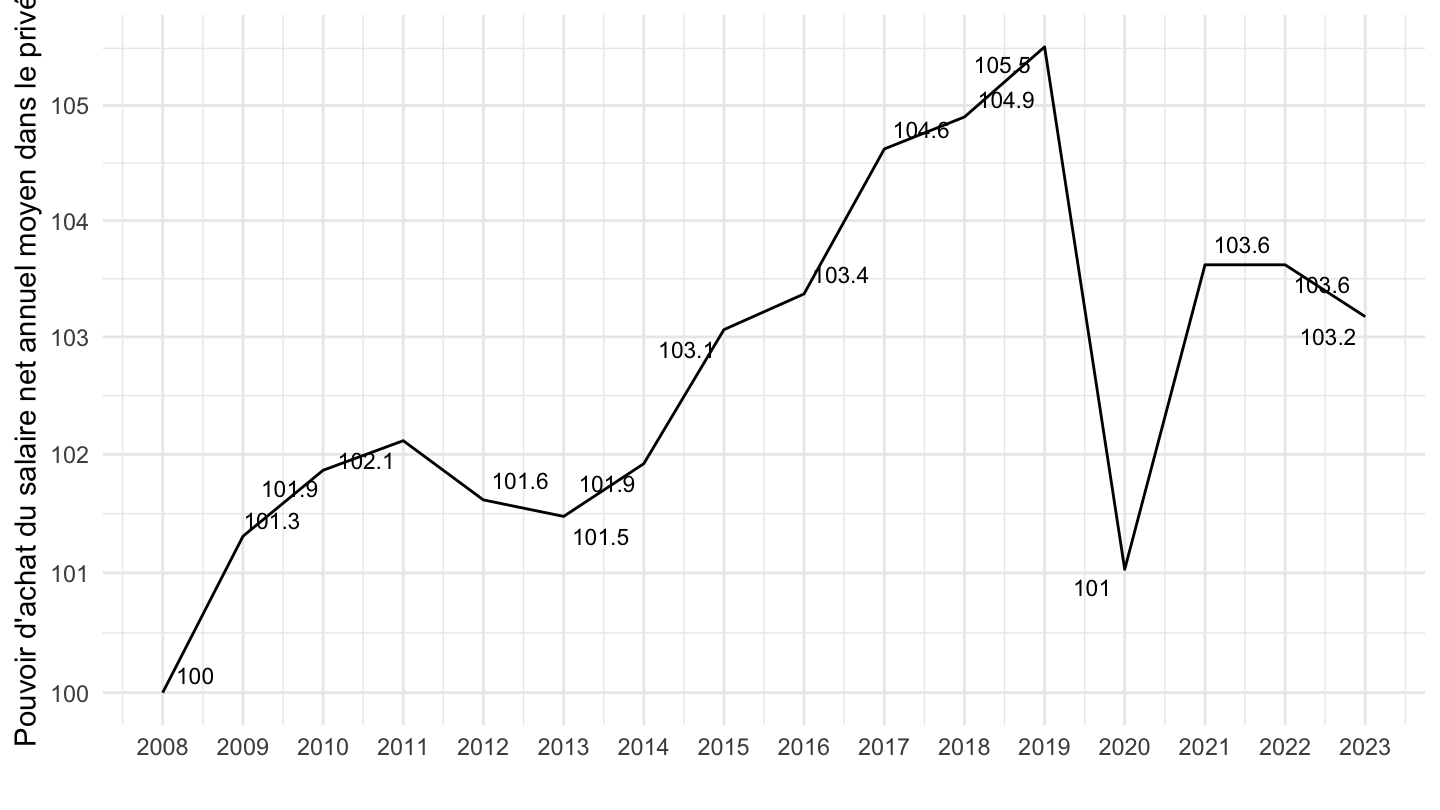
2017- (15 ans)
Code
`SALAIRES-ANNUELS` %>%
  filter(IDBANK == "010752375") %>%
  year_to_date() %>%
  filter(date >= as.Date("2017-01-01")) %>%
  arrange(date) %>%
  mutate(OBS_VALUE = 100*OBS_VALUE/OBS_VALUE[1]) %>%
  ggplot(.) + theme_minimal() +
  xlab("") + ylab("Pouvoir d'achat du salaire net annuel moyen dans le privé") +
  geom_line(aes(x = date, y = OBS_VALUE)) +
  theme(legend.title = element_blank(),
        legend.position = c(0.7, 0.8)) +
  scale_x_date(breaks = seq(1920, 2100, 1) %>% paste0("-01-01") %>% as.Date(),
               labels = date_format("%Y")) +
  scale_y_log10(breaks = seq(100, 1000, 1)) +
  geom_text_repel(aes(x = date, y = OBS_VALUE, label = round(OBS_VALUE, 1)),
                  fontface ="plain", color = "black", size = 3)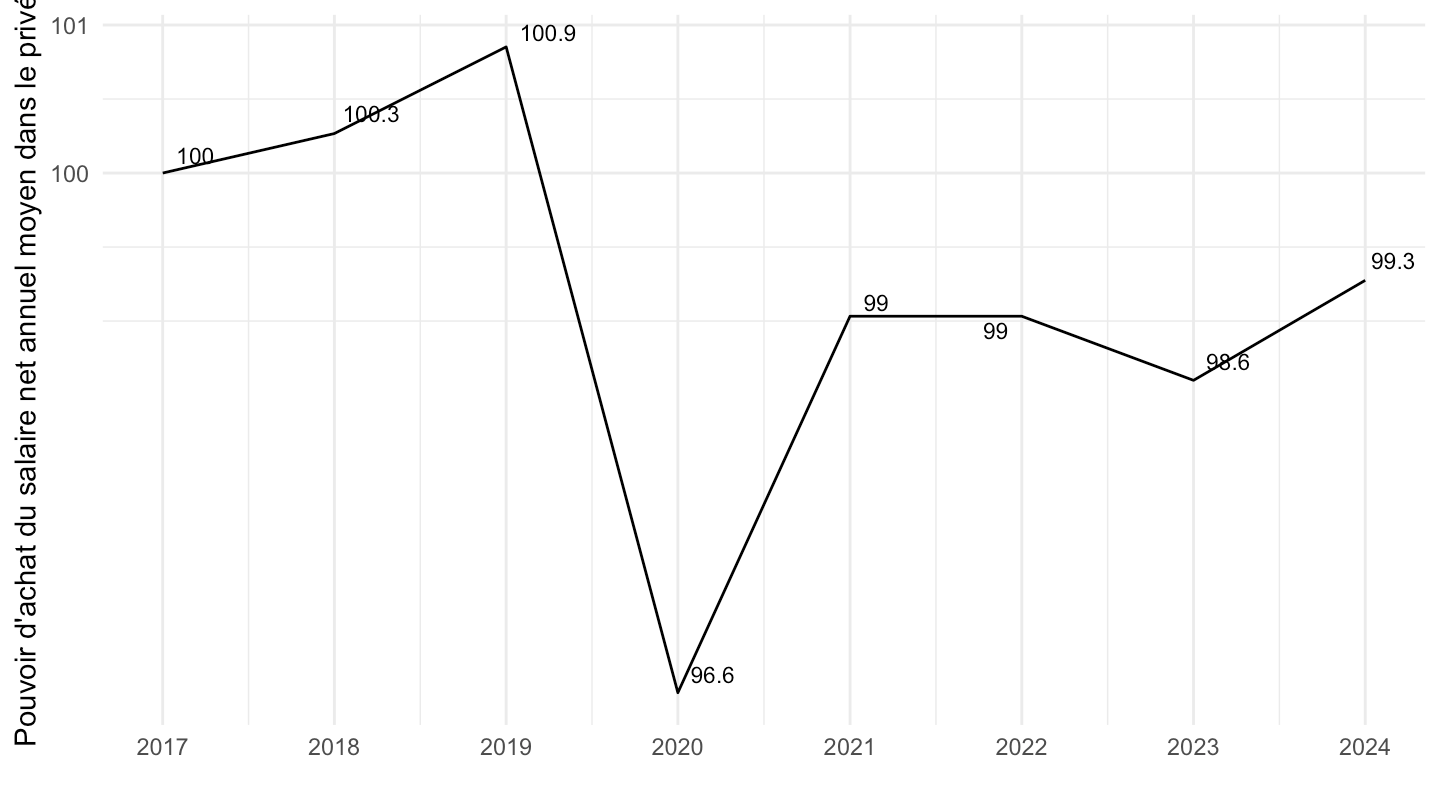
Différences de concepts
Moyen vs. Médian
EQTP:
010752333: Salaire net annuel moyen en équivalent temps plein dans le secteur privé - Ensemble des salariés
010752342: Médiane (D5) du salaire net annuel en équivalent temps plein dans le secteur privé - Ensemble des salariés
Temps complets:
010752366: Salaire net annuel moyen des postes à temps complet dans le secteur privé - Ensemble des salariés
010752396: Médiane (D5) du salaire net annuel des postes à temps complet dans le secteur privé - Ensemble des salariés
EQTP
Tous
Code
`SALAIRES-ANNUELS` %>%
  filter(IDBANK %in% c("010752333", "010752342")) %>%
  year_to_date() %>%
  left_join(INDICATEUR, by = "INDICATEUR") %>%
  group_by(Indicateur) %>%
  arrange(date) %>%
  mutate(OBS_VALUE = 100*OBS_VALUE/OBS_VALUE[1]) %>%
  ggplot(.) + theme_minimal() +
  xlab("") + ylab("Pouvoir d'achat du salaire net annuel moyen dans le privé") +
  geom_line(aes(x = date, y = OBS_VALUE, color = Indicateur)) +
  theme(legend.title = element_blank(),
        legend.position = c(0.2, 0.8)) +
  scale_x_date(breaks = seq(1996, 2100, 2) %>% paste0("-01-01") %>% as.Date(),
               labels = date_format("%Y")) +
  scale_y_log10(breaks = seq(100, 1000, 10))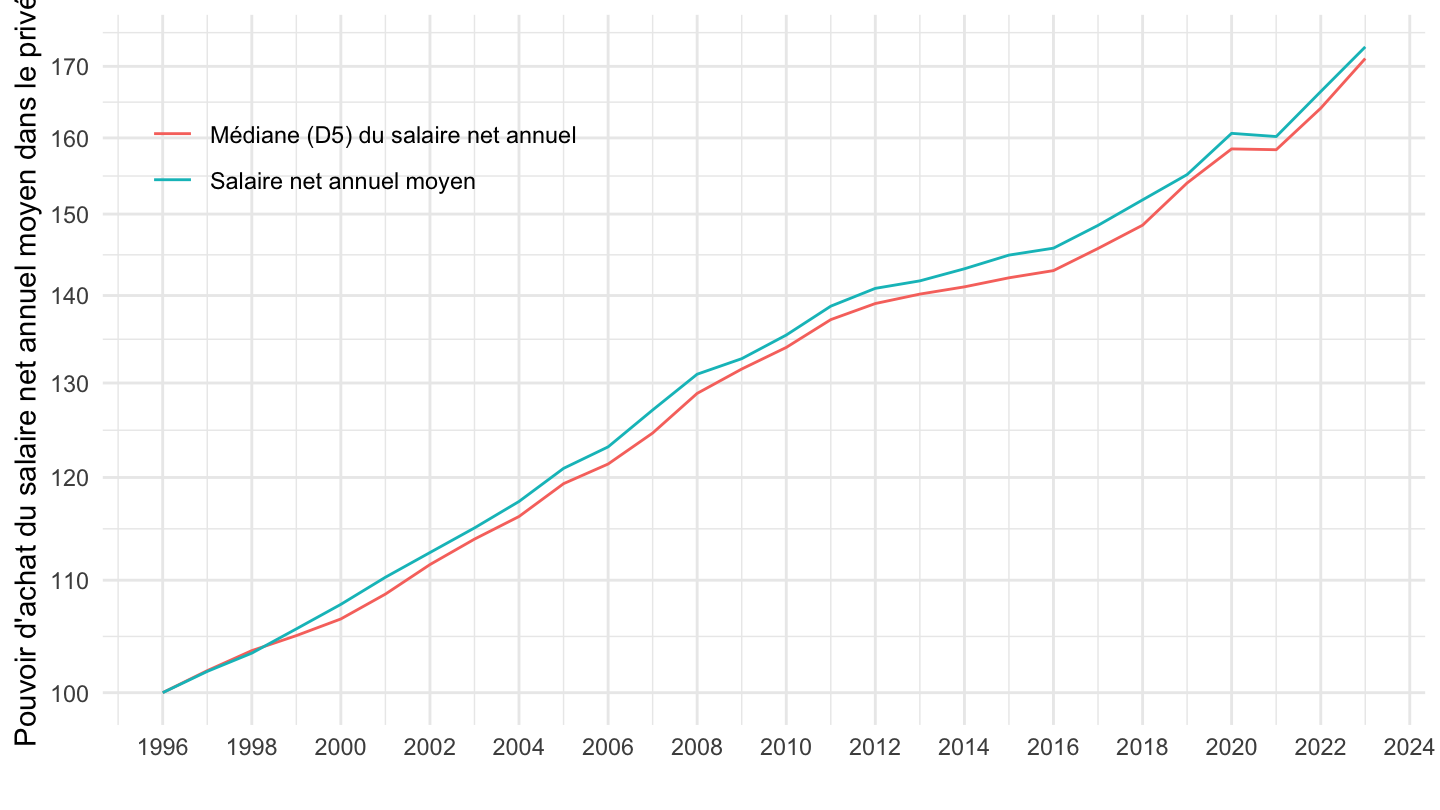
2008-
Code
`SALAIRES-ANNUELS` %>%
  filter(IDBANK %in% c("010752333", "010752342")) %>%
  year_to_date() %>%
  left_join(INDICATEUR, by = "INDICATEUR") %>%
  group_by(Indicateur) %>%
  arrange(date) %>%
  filter(date >= as.Date("2008-01-01")) %>%
  mutate(OBS_VALUE = 100*OBS_VALUE/OBS_VALUE[1]) %>%
  ggplot(.) + theme_minimal() +
  xlab("") + ylab("Pouvoir d'achat du salaire net annuel moyen dans le privé") +
  geom_line(aes(x = date, y = OBS_VALUE, color = Indicateur)) +
  theme(legend.title = element_blank(),
        legend.position = c(0.2, 0.8)) +
  scale_x_date(breaks = seq(1996, 2100, 2) %>% paste0("-01-01") %>% as.Date(),
               labels = date_format("%Y")) +
  scale_y_log10(breaks = seq(100, 1000, 2))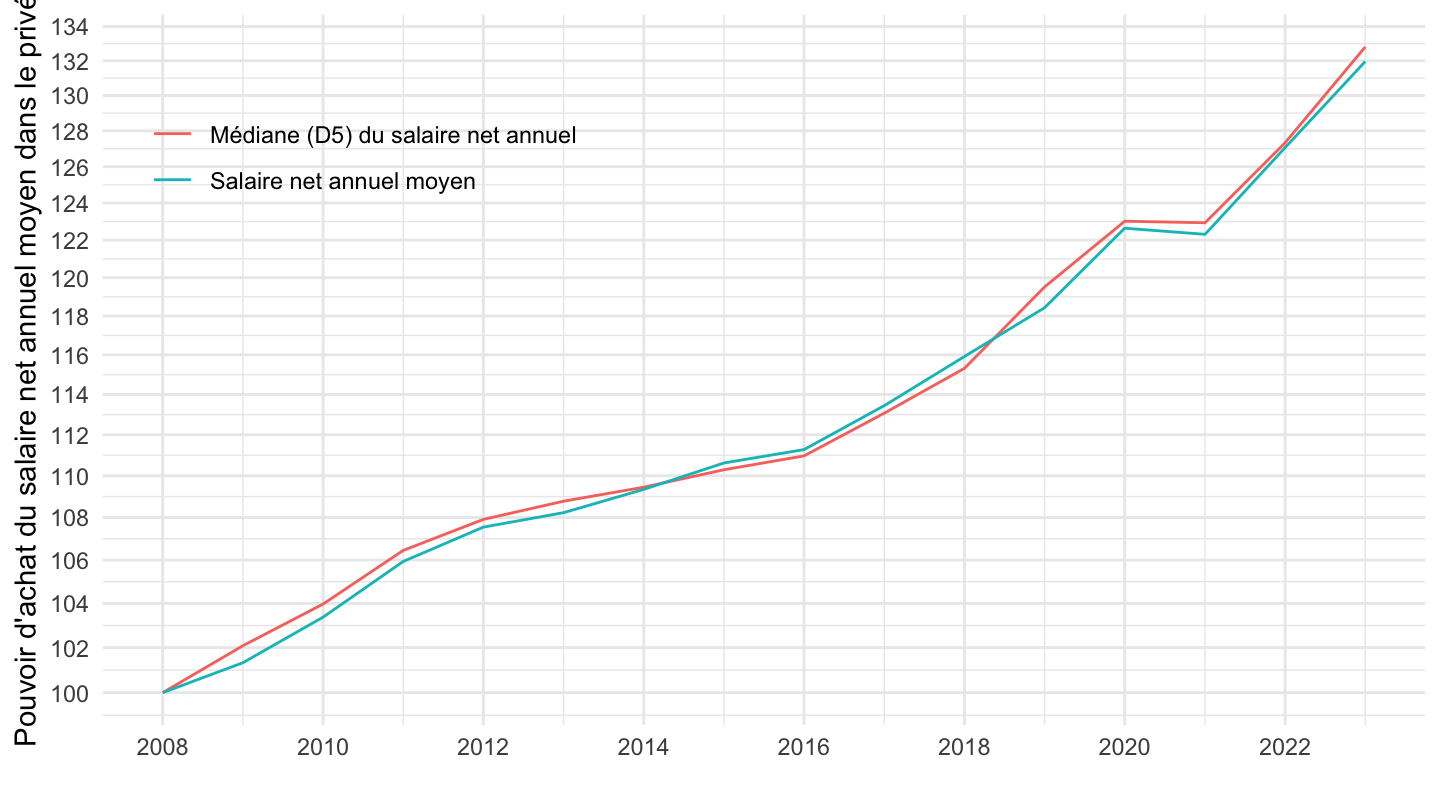
Temps complets
Tous
Code
`SALAIRES-ANNUELS` %>%
  filter(IDBANK %in% c("010752366", "010752396")) %>%
  year_to_date() %>%
  left_join(INDICATEUR, by = "INDICATEUR") %>%
  group_by(Indicateur) %>%
  arrange(date) %>%
  mutate(OBS_VALUE = 100*OBS_VALUE/OBS_VALUE[1]) %>%
  ggplot(.) + theme_minimal() +
  xlab("") + ylab("") +
  geom_line(aes(x = date, y = OBS_VALUE, color = Indicateur)) +
  theme(legend.title = element_blank(),
        legend.position = c(0.2, 0.8)) +
  scale_x_date(breaks = seq(1920, 2100, 5) %>% paste0("-01-01") %>% as.Date(),
               labels = date_format("%Y")) +
  scale_y_log10(breaks = seq(100, 1000, 10))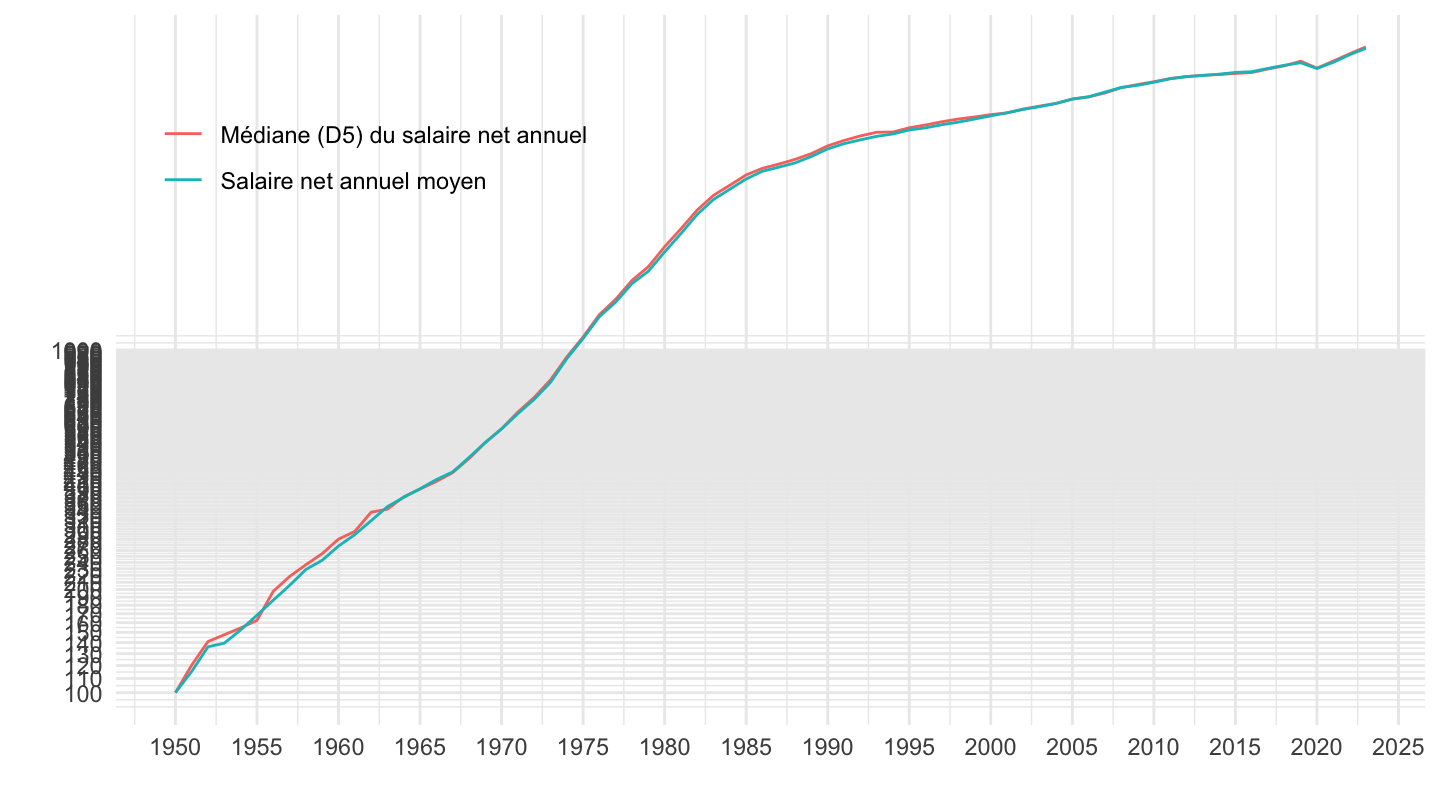
1996-
Code
`SALAIRES-ANNUELS` %>%
  filter(IDBANK %in% c("010752366", "010752396")) %>%
  year_to_date() %>%
  left_join(INDICATEUR, by = "INDICATEUR") %>%
  group_by(Indicateur) %>%
  arrange(date) %>%
  filter(date >= as.Date("1996-01-01")) %>%
  mutate(OBS_VALUE = 100*OBS_VALUE/OBS_VALUE[1]) %>%
  ggplot(.) + theme_minimal() +
  xlab("") + ylab("") +
  geom_line(aes(x = date, y = OBS_VALUE, color = Indicateur)) +
  theme(legend.title = element_blank(),
        legend.position = c(0.2, 0.8)) +
  scale_x_date(breaks = seq(1996, 2100, 2) %>% paste0("-01-01") %>% as.Date(),
               labels = date_format("%Y")) +
  scale_y_log10(breaks = seq(100, 1000, 10))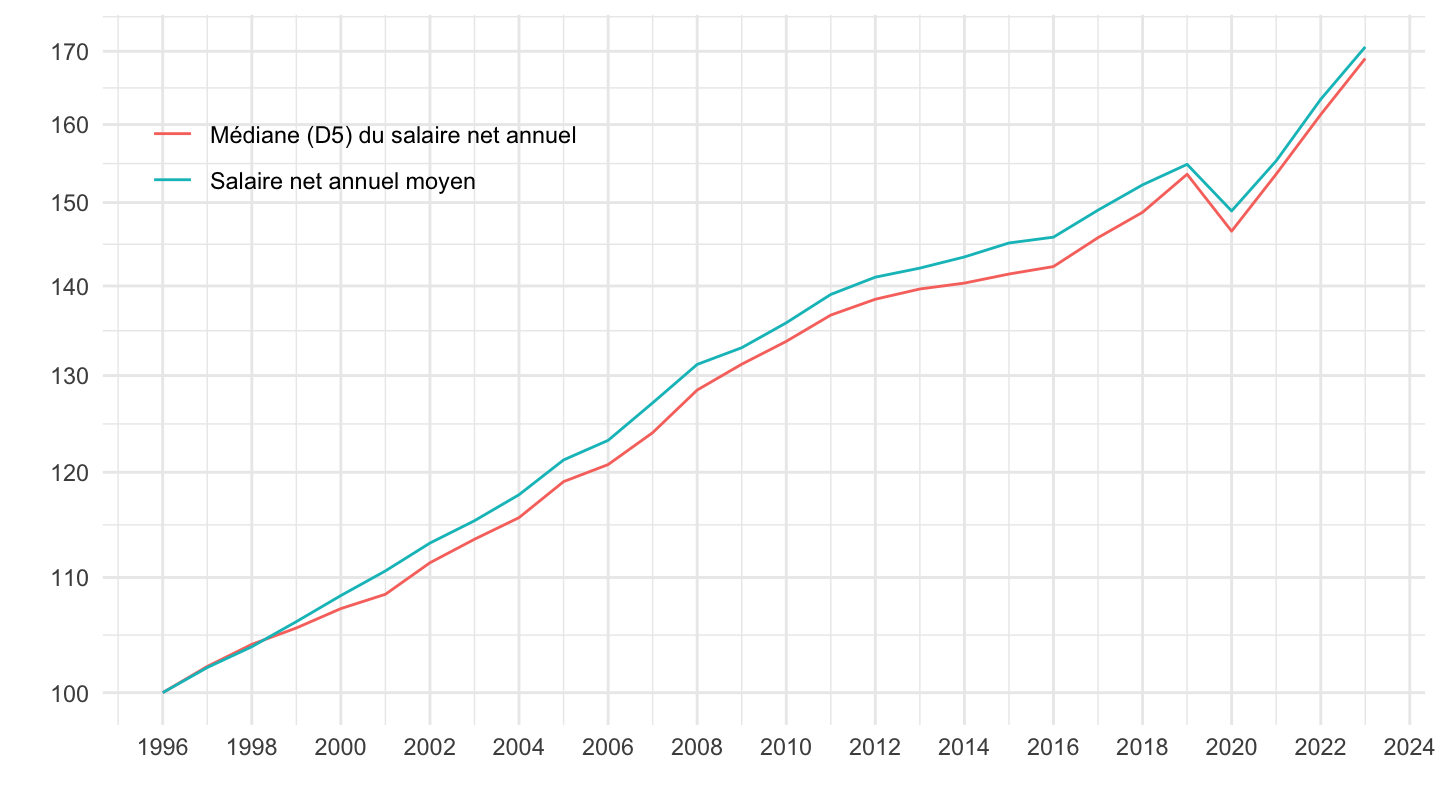
2008-
Code
`SALAIRES-ANNUELS` %>%
  filter(IDBANK %in% c("010752366", "010752396")) %>%
  year_to_date() %>%
  left_join(INDICATEUR, by = "INDICATEUR") %>%
  group_by(Indicateur) %>%
  arrange(date) %>%
  filter(date >= as.Date("2008-01-01")) %>%
  mutate(OBS_VALUE = 100*OBS_VALUE/OBS_VALUE[1]) %>%
  ggplot(.) + theme_minimal() +
  xlab("") + ylab("") +
  geom_line(aes(x = date, y = OBS_VALUE, color = Indicateur)) +
  theme(legend.title = element_blank(),
        legend.position = c(0.2, 0.8)) +
  scale_x_date(breaks = seq(1920, 2100, 2) %>% paste0("-01-01") %>% as.Date(),
               labels = date_format("%Y")) +
  scale_y_log10(breaks = seq(100, 1000, 2))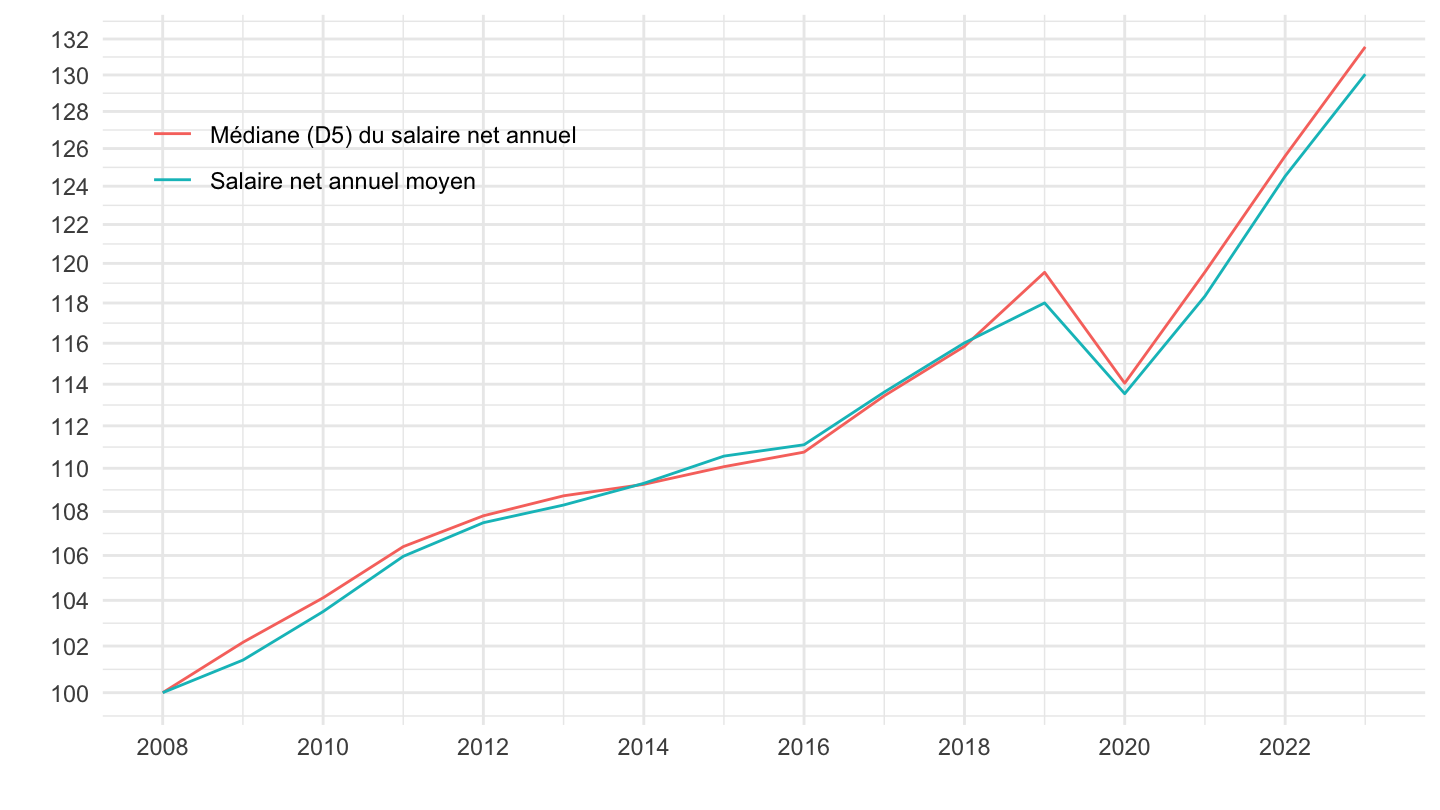
EQTP vs. temps complets
Preuve que temps plein existait avant
Tous
Code
`SALAIRES-ANNUELS` %>%
  filter(IDBANK %in% c("010752333", "010752366")) %>%
  year_to_date() %>%
  left_join(`QUOTITE-TRAV`, by = "QUOTITE-TRAV") %>%
  group_by(`Quotite-Trav`) %>%
  arrange(date) %>%
  mutate(OBS_VALUE = 100*OBS_VALUE/OBS_VALUE[1]) %>%
  ggplot(.) + theme_minimal() +
  xlab("") + ylab("") +
  geom_line(aes(x = date, y = OBS_VALUE, color = `Quotite-Trav`)) +
  theme(legend.title = element_blank(),
        legend.position = c(0.2, 0.8)) +
  scale_x_date(breaks = seq(1920, 2100, 5) %>% paste0("-01-01") %>% as.Date(),
               labels = date_format("%Y")) +
  scale_y_log10(breaks = seq(100, 1000, 10))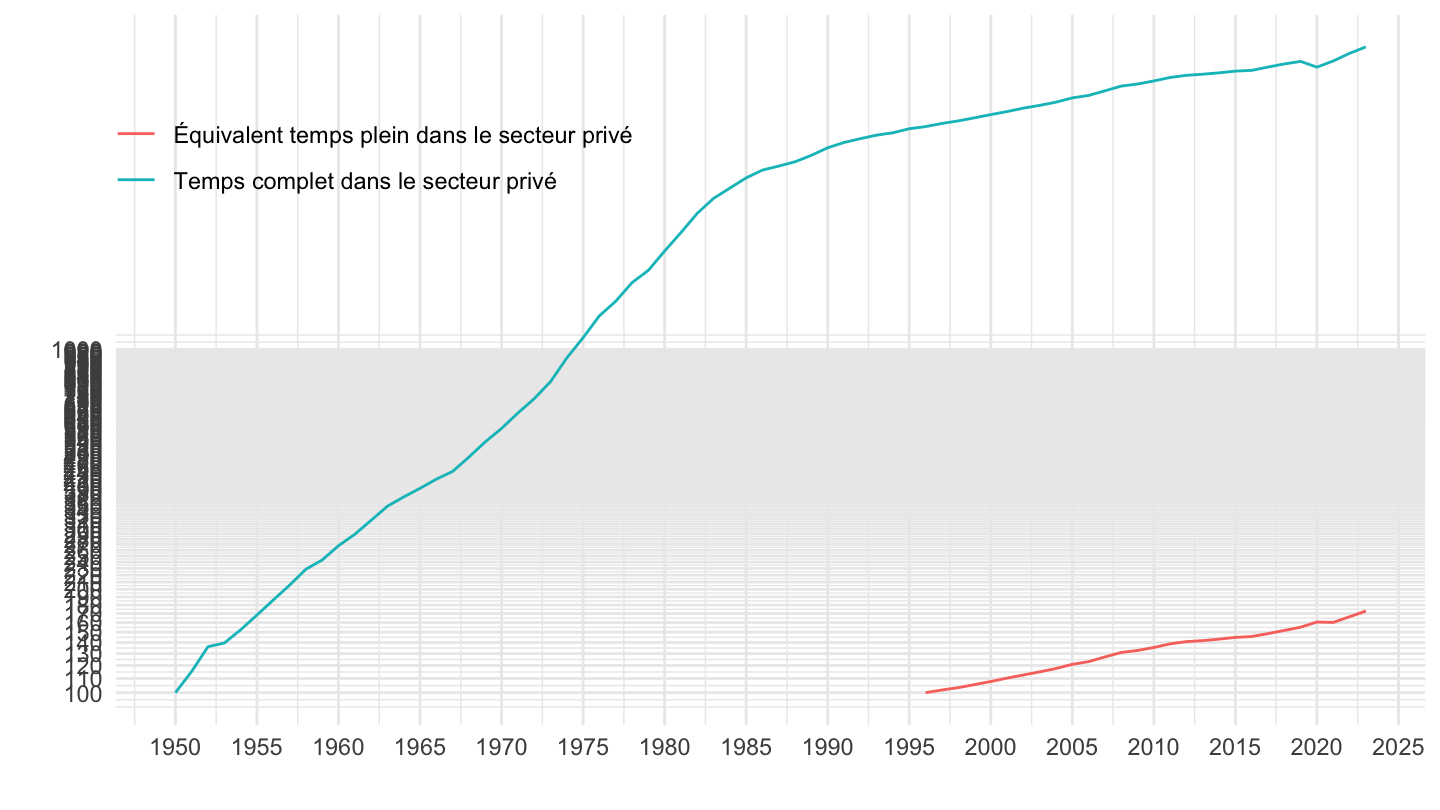
1996-
Code
`SALAIRES-ANNUELS` %>%
  filter(IDBANK %in% c("010752333", "010752366")) %>%
  year_to_date() %>%
  filter(date >= as.Date("1996-01-01")) %>%
  left_join(`QUOTITE-TRAV`, by = "QUOTITE-TRAV") %>%
  group_by(`Quotite-Trav`) %>%
  arrange(date) %>%
  mutate(OBS_VALUE = 100*OBS_VALUE/OBS_VALUE[1]) %>%
  ggplot(.) + theme_minimal() +
  xlab("") + ylab("") +
  geom_line(aes(x = date, y = OBS_VALUE, color = `Quotite-Trav`)) +
  theme(legend.title = element_blank(),
        legend.position = c(0.2, 0.8)) +
  scale_x_date(breaks = seq(1920, 2100, 2) %>% paste0("-01-01") %>% as.Date(),
               labels = date_format("%Y")) +
  scale_y_log10(breaks = seq(100, 1000, 10)) +
  geom_label(data = . %>% filter(date == max(date)), aes(x = date, y = OBS_VALUE, label = round(OBS_VALUE, 1), color = `Quotite-Trav`))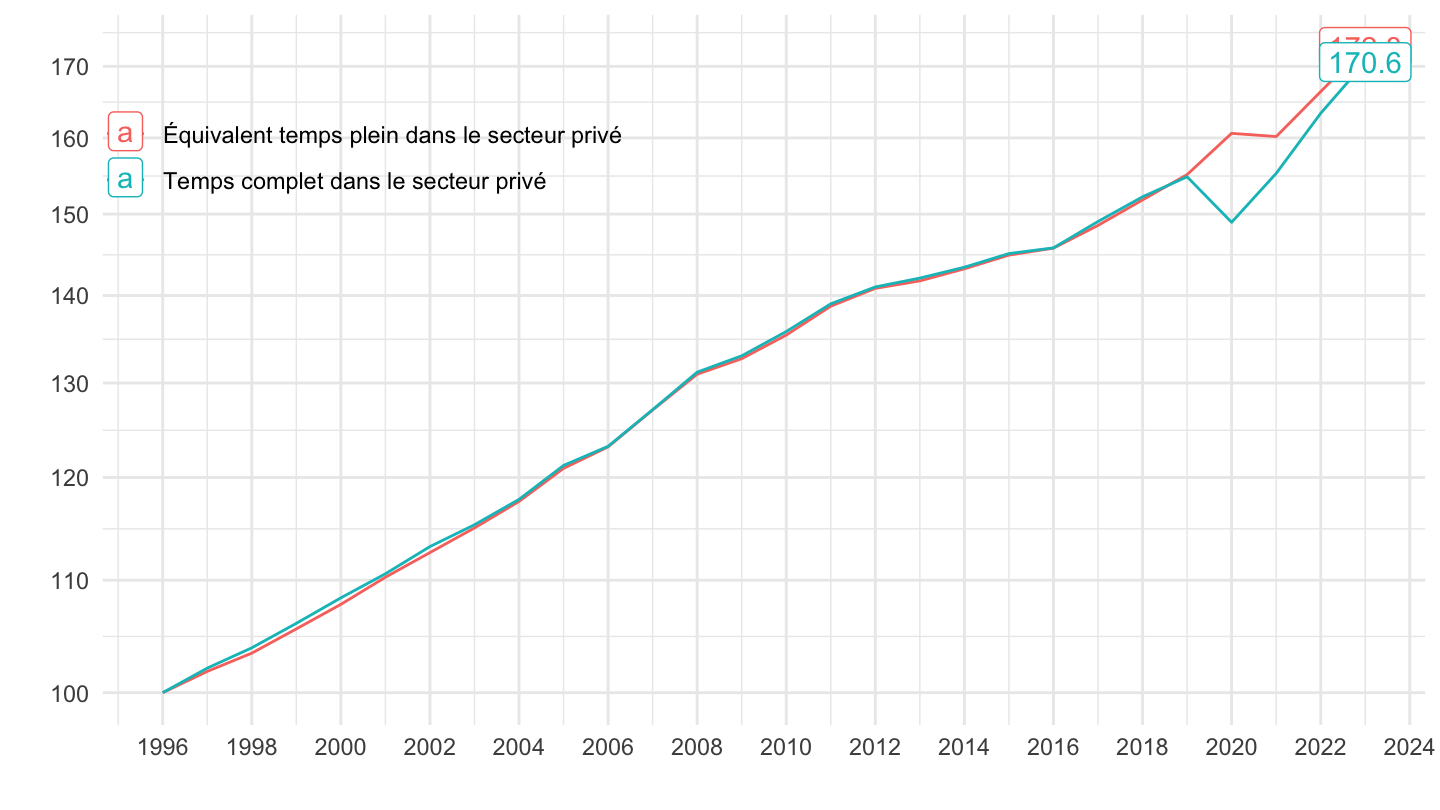
2008-
Code
`SALAIRES-ANNUELS` %>%
  filter(IDBANK %in% c("010752333", "010752366")) %>%
  year_to_date() %>%
  filter(date >= as.Date("2008-01-01")) %>%
  left_join(`QUOTITE-TRAV`, by = "QUOTITE-TRAV") %>%
  group_by(`Quotite-Trav`) %>%
  arrange(date) %>%
  mutate(OBS_VALUE = 100*OBS_VALUE/OBS_VALUE[1]) %>%
  ggplot(.) + theme_minimal() +
  xlab("") + ylab("") +
  geom_line(aes(x = date, y = OBS_VALUE, color = `Quotite-Trav`)) +
  theme(legend.title = element_blank(),
        legend.position = c(0.2, 0.8)) +
  scale_x_date(breaks = seq(1920, 2100, 1) %>% paste0("-01-01") %>% as.Date(),
               labels = date_format("%Y")) +
  scale_y_log10(breaks = seq(100, 1000, 2)) +
  geom_label(data = . %>% filter(date == max(date)), aes(x = date, y = OBS_VALUE, label = round(OBS_VALUE, 1), color = `Quotite-Trav`))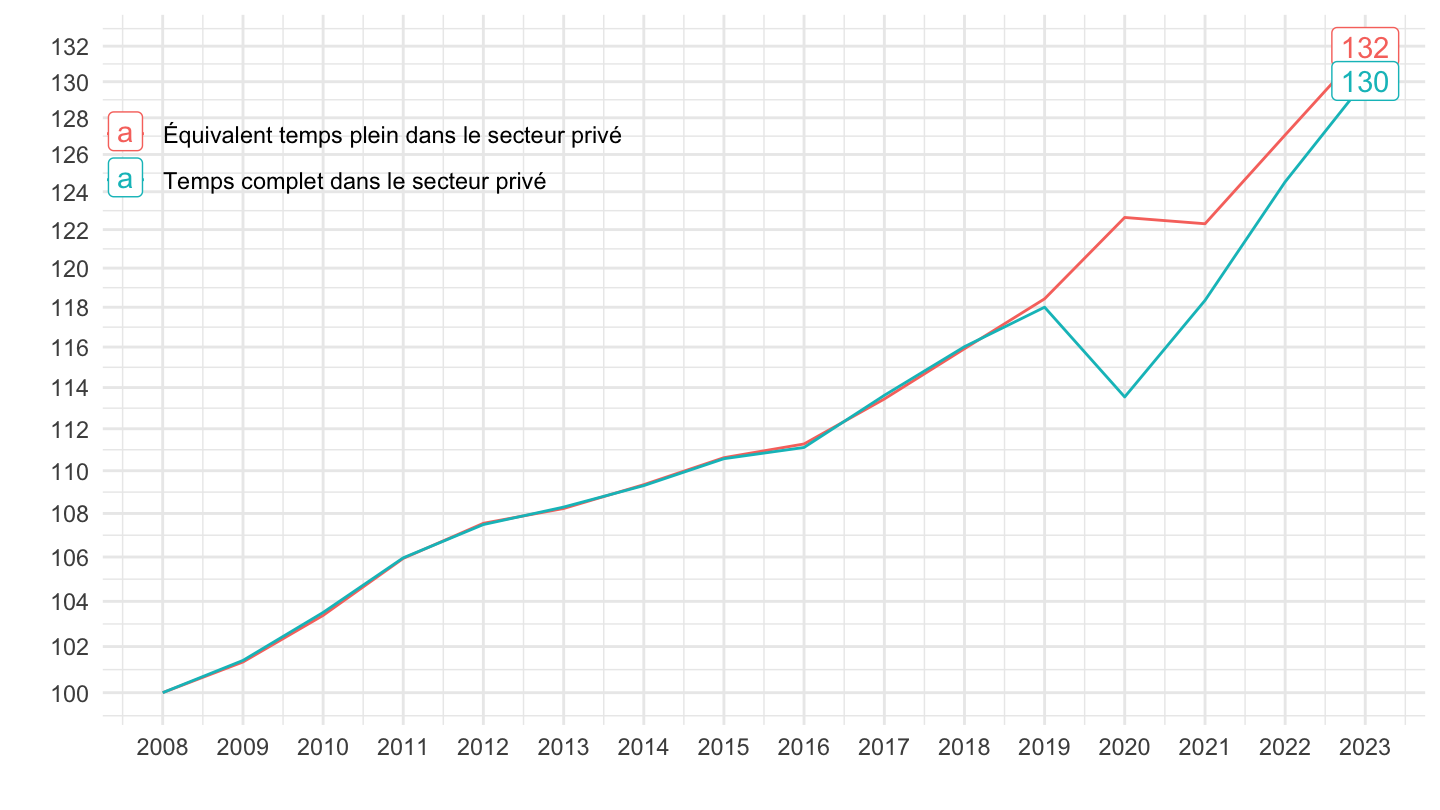
2008-2021
Code
`SALAIRES-ANNUELS` %>%
  filter(IDBANK %in% c("010752333", "010752366")) %>%
  year_to_date() %>%
  filter(date >= as.Date("2008-01-01"),
         date <= as.Date("2021-01-01")) %>%
  left_join(`QUOTITE-TRAV`, by = "QUOTITE-TRAV") %>%
  group_by(`Quotite-Trav`) %>%
  arrange(date) %>%
  mutate(OBS_VALUE = 100*OBS_VALUE/OBS_VALUE[1]) %>%
  ggplot(.) + theme_minimal() +
  xlab("") + ylab("") +
  geom_line(aes(x = date, y = OBS_VALUE, color = `Quotite-Trav`)) +
  theme(legend.title = element_blank(),
        legend.position = c(0.2, 0.8)) +
  scale_x_date(breaks = seq(1920, 2100, 1) %>% paste0("-01-01") %>% as.Date(),
               labels = date_format("%Y")) +
  scale_y_log10(breaks = seq(100, 1000, 2)) +
  geom_label(data = . %>% filter(date == max(date)), aes(x = date, y = OBS_VALUE, label = round(OBS_VALUE, 1), color = `Quotite-Trav`))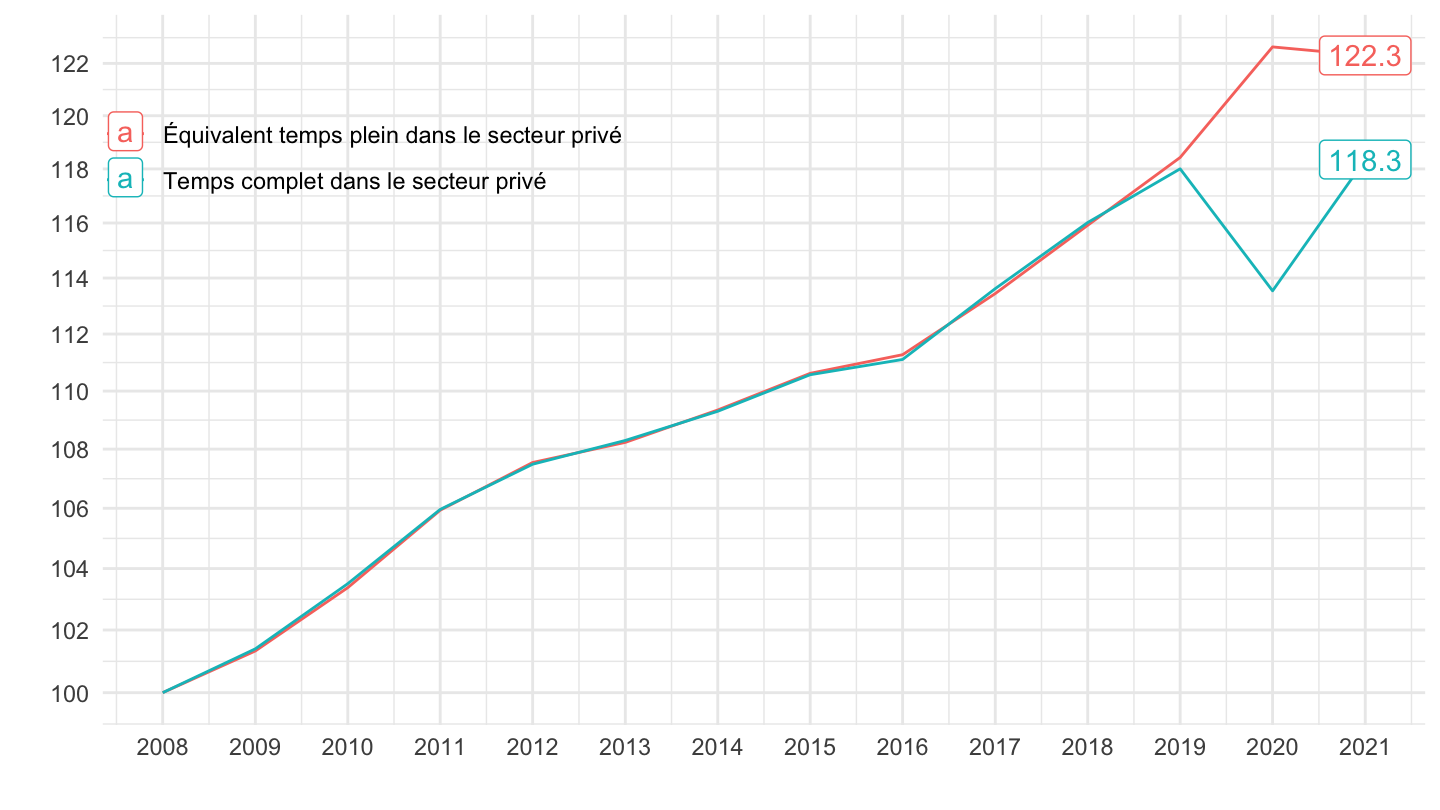
2009-2021
Code
`SALAIRES-ANNUELS` %>%
  filter(IDBANK %in% c("010752333", "010752366")) %>%
  year_to_date() %>%
  filter(date >= as.Date("2009-01-01"),
         date <= as.Date("2021-01-01")) %>%
  left_join(`QUOTITE-TRAV`, by = "QUOTITE-TRAV") %>%
  group_by(`Quotite-Trav`) %>%
  arrange(date) %>%
  mutate(OBS_VALUE = 100*OBS_VALUE/OBS_VALUE[1]) %>%
  ggplot(.) + theme_minimal() +
  xlab("") + ylab("") +
  geom_line(aes(x = date, y = OBS_VALUE, color = `Quotite-Trav`)) +
  theme(legend.title = element_blank(),
        legend.position = c(0.2, 0.8)) +
  scale_x_date(breaks = seq(1920, 2100, 1) %>% paste0("-01-01") %>% as.Date(),
               labels = date_format("%Y")) +
  scale_y_log10(breaks = seq(100, 1000, 2)) +
  geom_label(data = . %>% filter(date == max(date)), aes(x = date, y = OBS_VALUE, label = round(OBS_VALUE, 2), color = `Quotite-Trav`))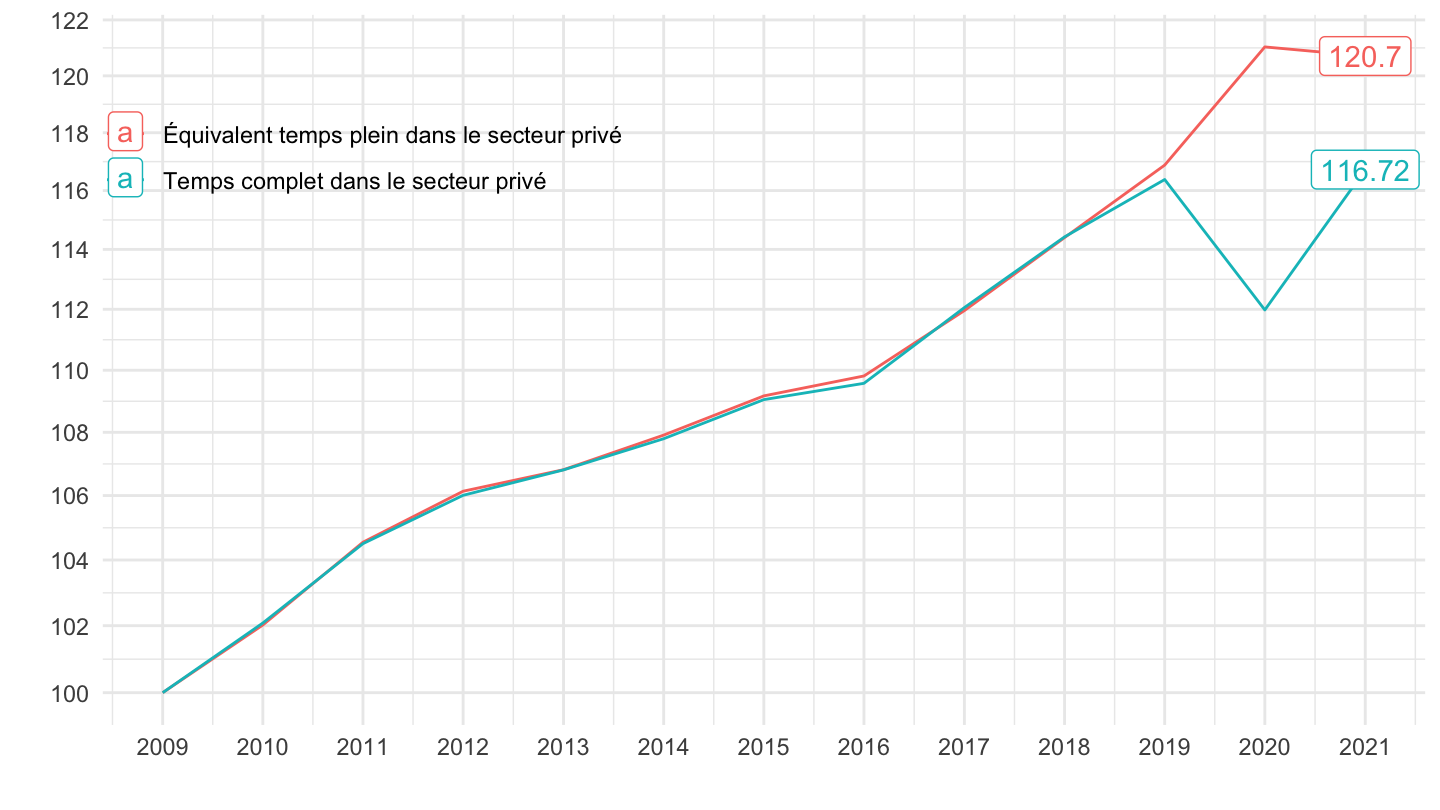
Secteur privé vs. Tous
Tous
Code
`SALAIRES-ANNUELS` %>%
  filter(IDBANK %in% c("001665161", "010752375")) %>%
  year_to_date() %>%
  left_join(`QUOTITE-TRAV`, by = "QUOTITE-TRAV") %>%
  group_by(`Quotite-Trav`) %>%
  arrange(date) %>%
  mutate(OBS_VALUE = 100*OBS_VALUE/OBS_VALUE[1]) %>%
  ggplot(.) + theme_minimal() +
  xlab("") + ylab("Pouvoir d'achat du salaire net annuel moyen dans le privé") +
  geom_line(aes(x = date, y = OBS_VALUE, color = `Quotite-Trav`)) +
  theme(legend.title = element_blank(),
        legend.position = c(0.2, 0.8)) +
  scale_x_date(breaks = seq(1920, 2100, 5) %>% paste0("-01-01") %>% as.Date(),
               labels = date_format("%Y")) +
  scale_y_log10(breaks = seq(100, 1000, 10))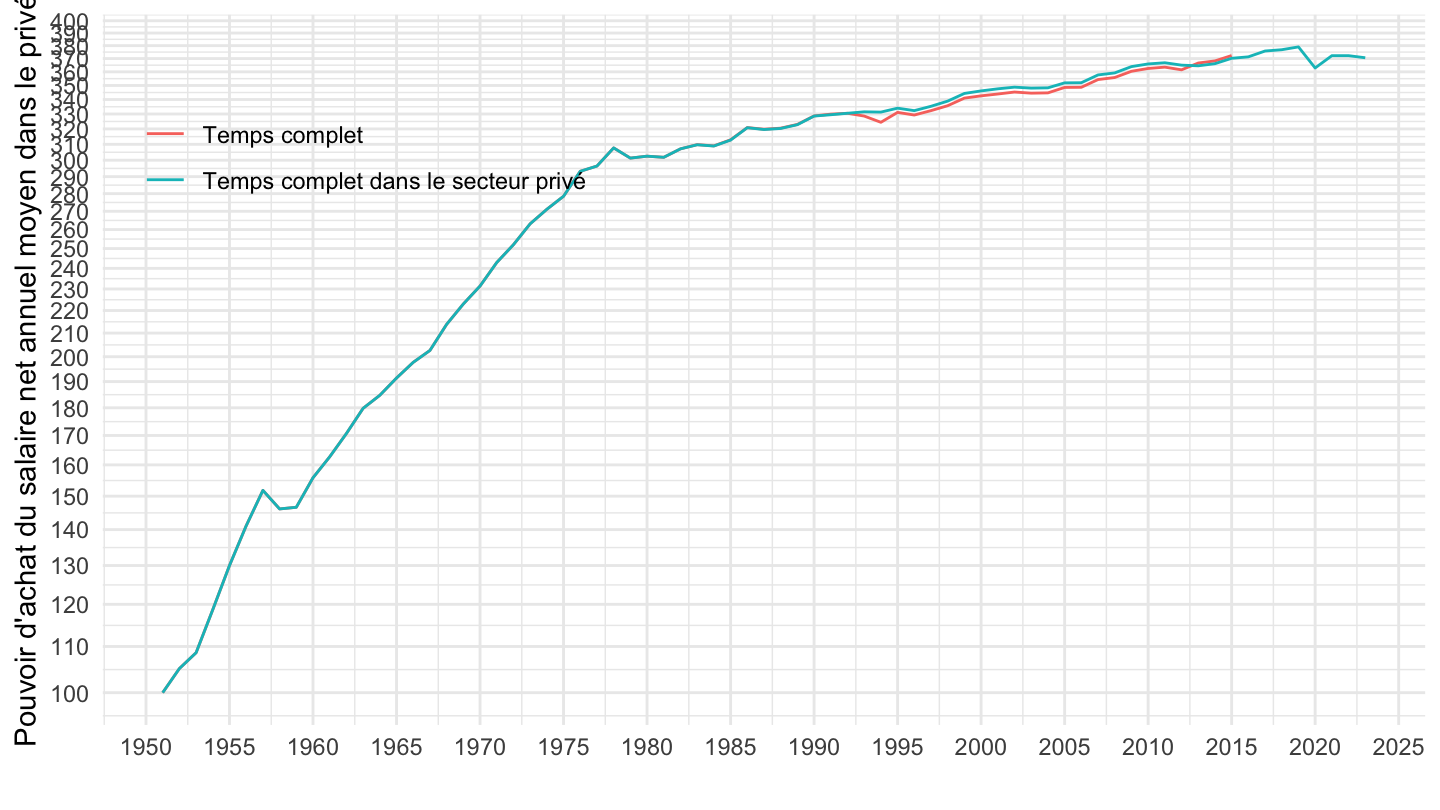
1990-
Code
`SALAIRES-ANNUELS` %>%
  filter(IDBANK %in% c("001665161", "010752375")) %>%
  year_to_date() %>%
  left_join(`QUOTITE-TRAV`, by = "QUOTITE-TRAV") %>%
  filter(date >= as.Date("1990-01-01")) %>%
  group_by(`Quotite-Trav`) %>%
  arrange(date) %>%
  mutate(OBS_VALUE = 100*OBS_VALUE/OBS_VALUE[1]) %>%
  ggplot(.) + theme_minimal() +
  xlab("") + ylab("Pouvoir d'achat du salaire net annuel moyen dans le privé") +
  geom_line(aes(x = date, y = OBS_VALUE, color = `Quotite-Trav`)) +
  theme(legend.title = element_blank(),
        legend.position = c(0.2, 0.8)) +
  scale_x_date(breaks = seq(1920, 2100, 5) %>% paste0("-01-01") %>% as.Date(),
               labels = date_format("%Y")) +
  scale_y_log10(breaks = seq(10, 1000, 2))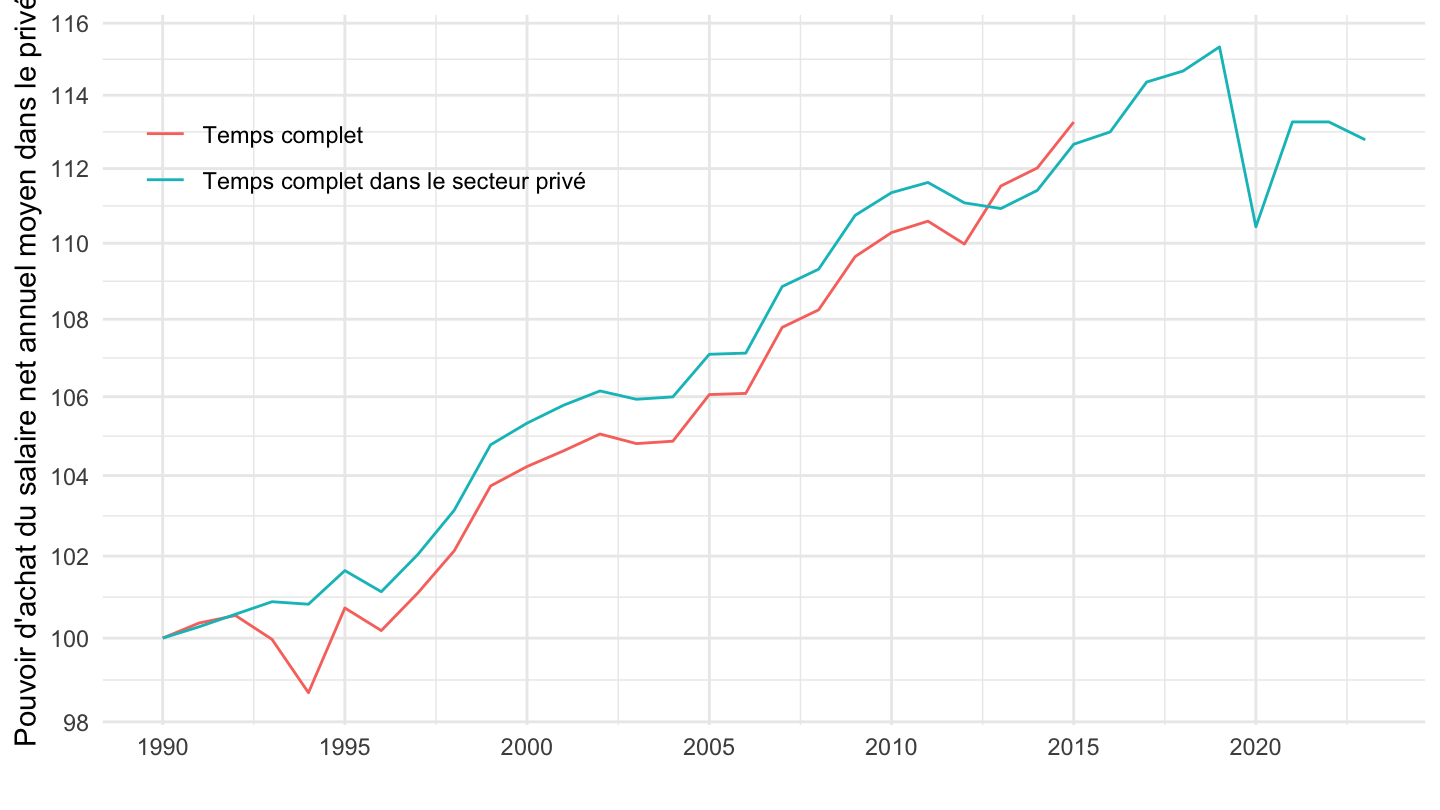
1999-
Code
`SALAIRES-ANNUELS` %>%
  filter(IDBANK %in% c("001665161", "010752375")) %>%
  year_to_date() %>%
  left_join(`QUOTITE-TRAV`, by = "QUOTITE-TRAV") %>%
  filter(date >= as.Date("1999-01-01")) %>%
  group_by(`Quotite-Trav`) %>%
  arrange(date) %>%
  mutate(OBS_VALUE = 100*OBS_VALUE/OBS_VALUE[1]) %>%
  ggplot(.) + theme_minimal() +
  xlab("") + ylab("Pouvoir d'achat du salaire net annuel moyen dans le privé") +
  geom_line(aes(x = date, y = OBS_VALUE, color = `Quotite-Trav`)) +
  theme(legend.title = element_blank(),
        legend.position = c(0.2, 0.8)) +
  scale_x_date(breaks = seq(1999, 2100, 2) %>% paste0("-01-01") %>% as.Date(),
               labels = date_format("%Y")) +
  scale_y_log10(breaks = seq(100, 1000, 1))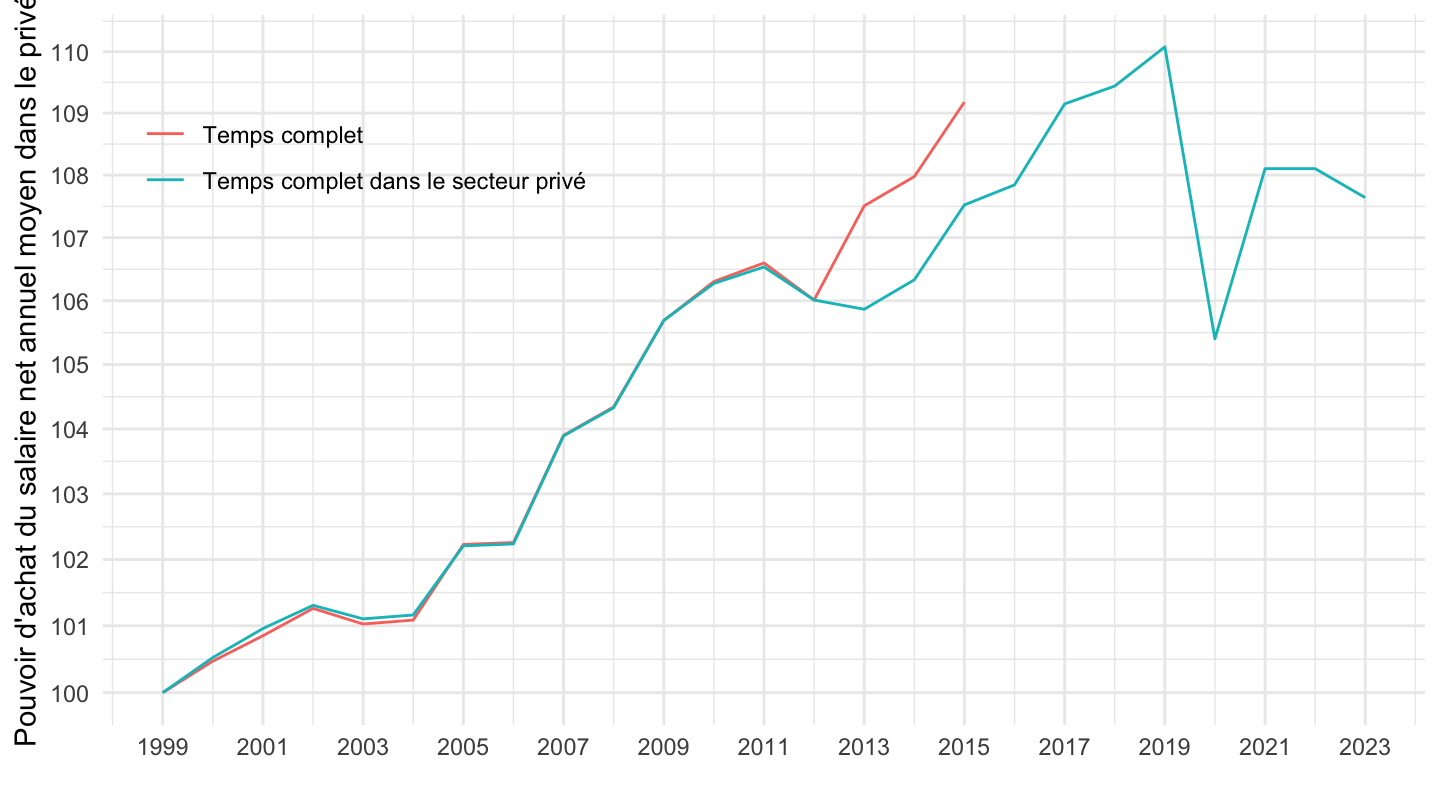
2017-
Code
`SALAIRES-ANNUELS` %>%
  filter(IDBANK %in% c("001665161", "010752375")) %>%
  year_to_date() %>%
  left_join(`QUOTITE-TRAV`, by = "QUOTITE-TRAV") %>%
  filter(date >= as.Date("2017-01-01")) %>%
  group_by(`Quotite-Trav`) %>%
  arrange(date) %>%
  mutate(OBS_VALUE = 100*OBS_VALUE/OBS_VALUE[1]) %>%
  ggplot(.) + theme_minimal() +
  xlab("") + ylab("Pouvoir d'achat du salaire net annuel moyen dans le privé") +
  geom_line(aes(x = date, y = OBS_VALUE, color = `Quotite-Trav`)) +
  theme(legend.title = element_blank(),
        legend.position = c(0.2, 0.8)) +
  scale_x_date(breaks = seq(1999, 2100, 1) %>% paste0("-01-01") %>% as.Date(),
               labels = date_format("%Y")) +
  scale_y_log10(breaks = seq(100, 1000, 1))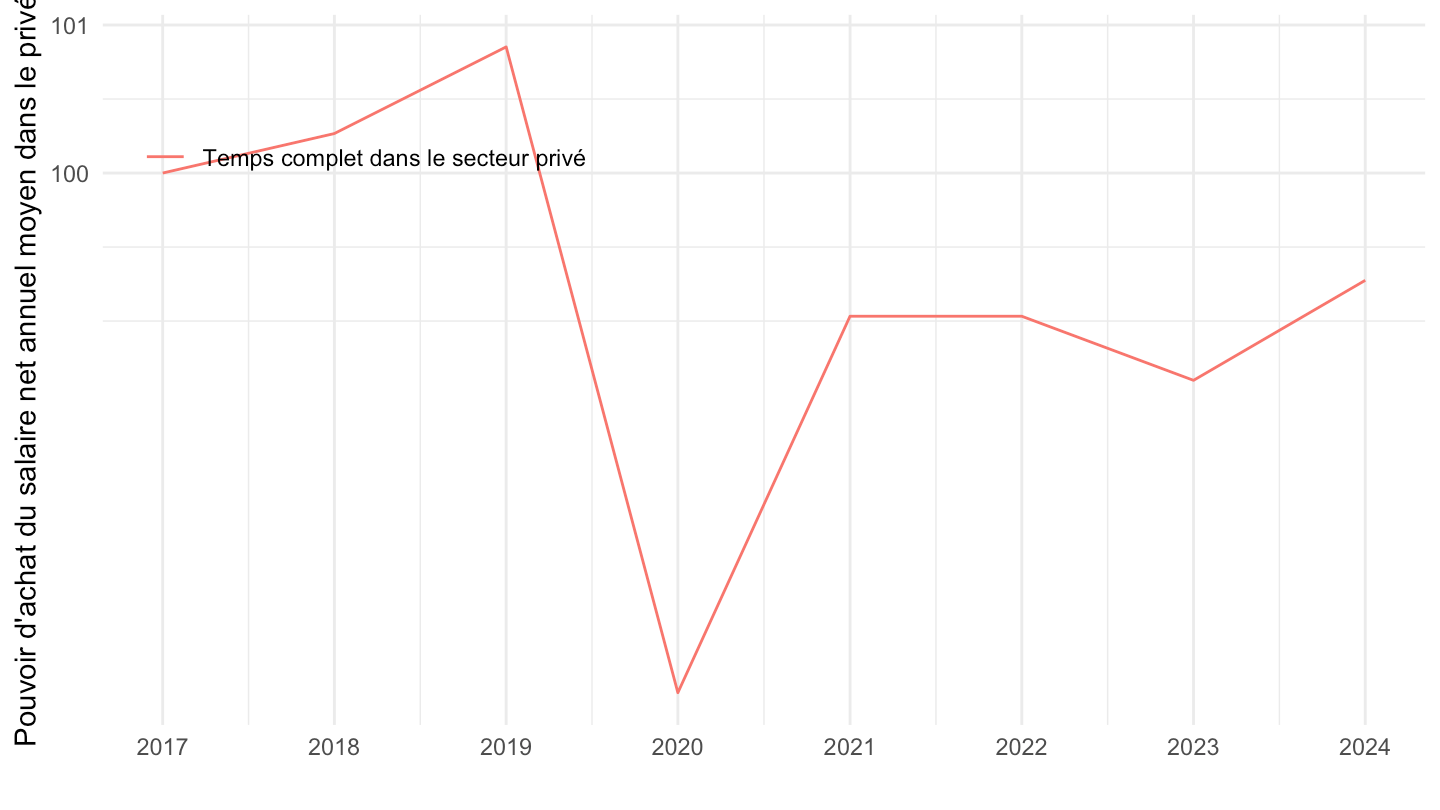
Hommes, Femmes, Tous
Tous
Code
`SALAIRES-ANNUELS` %>%
  filter(IDBANK %in% c("010752375", "010752373", "010752374")) %>%
  year_to_date() %>%
  left_join(SEXE, by = "SEXE") %>%
  group_by(SEXE) %>%
  arrange(date) %>%
  mutate(OBS_VALUE = 100*OBS_VALUE/OBS_VALUE[1]) %>%
  ggplot(.) + theme_minimal() +
  xlab("") + ylab("Pouvoir d'achat du salaire net annuel moyen dans le privé") +
  geom_line(aes(x = date, y = OBS_VALUE, color = Sexe)) +
  theme(legend.title = element_blank(),
        legend.position = c(0.2, 0.8)) +
  scale_x_date(breaks = seq(1920, 2100, 5) %>% paste0("-01-01") %>% as.Date(),
               labels = date_format("%Y")) +
  scale_y_log10(breaks = seq(100, 1000, 10))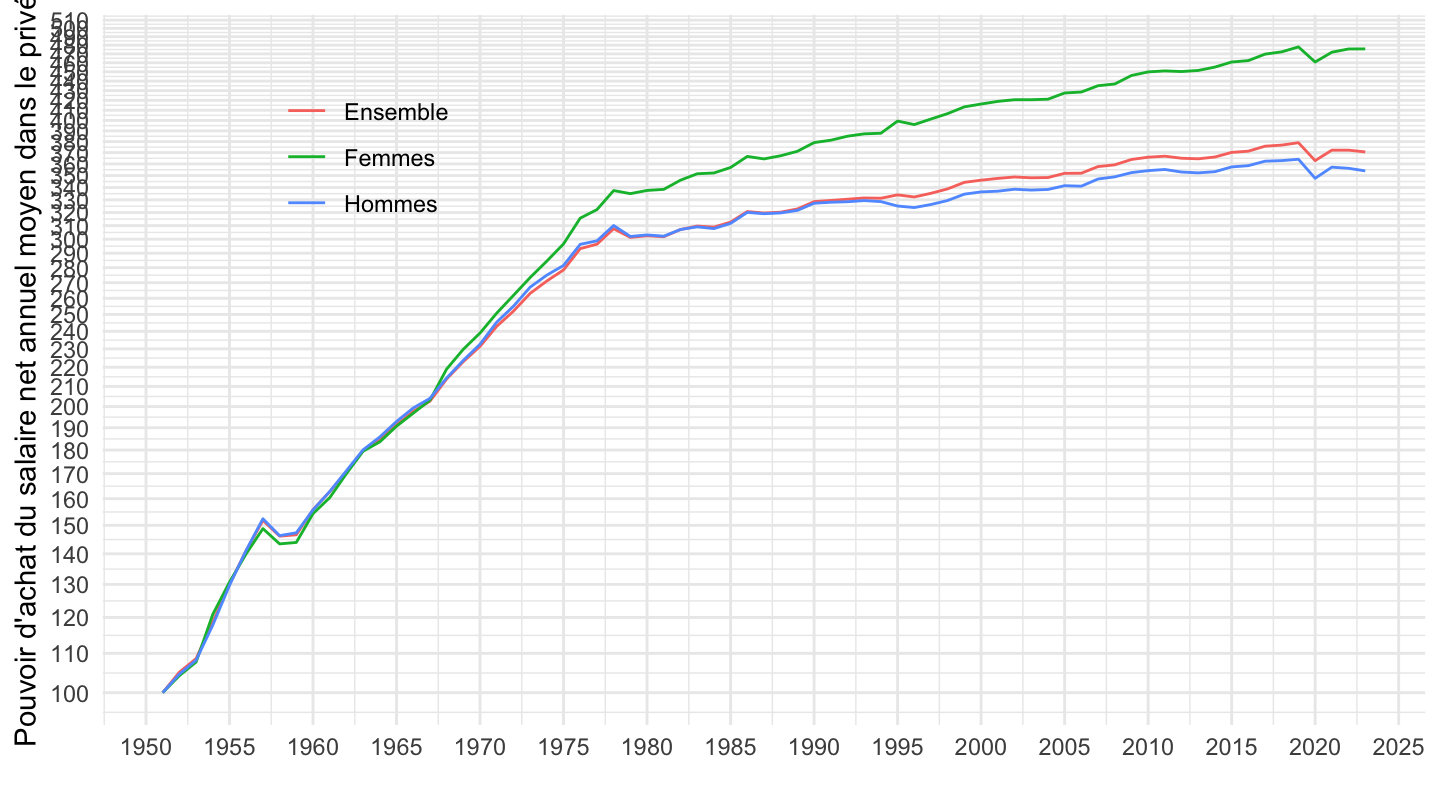
1965-
Code
`SALAIRES-ANNUELS` %>%
  filter(IDBANK %in% c("010752375", "010752373", "010752374")) %>%
  year_to_date() %>%
  filter(date >= as.Date("1965-01-01")) %>%
  left_join(SEXE, by = "SEXE") %>%
  group_by(SEXE) %>%
  arrange(date) %>%
  mutate(OBS_VALUE = 100*OBS_VALUE/OBS_VALUE[date == as.Date("1965-01-01")]) %>%
  ggplot(.) + theme_minimal() +
  xlab("") + ylab("Pouvoir d'achat du salaire net annuel moyen dans le privé") +
  geom_line(aes(x = date, y = OBS_VALUE, color = Sexe)) +
  theme(legend.title = element_blank(),
        legend.position = c(0.2, 0.8)) +
  scale_x_date(breaks = seq(1920, 2100, 5) %>% paste0("-01-01") %>% as.Date(),
               labels = date_format("%Y")) +
  scale_y_log10(breaks = seq(100, 1000, 10))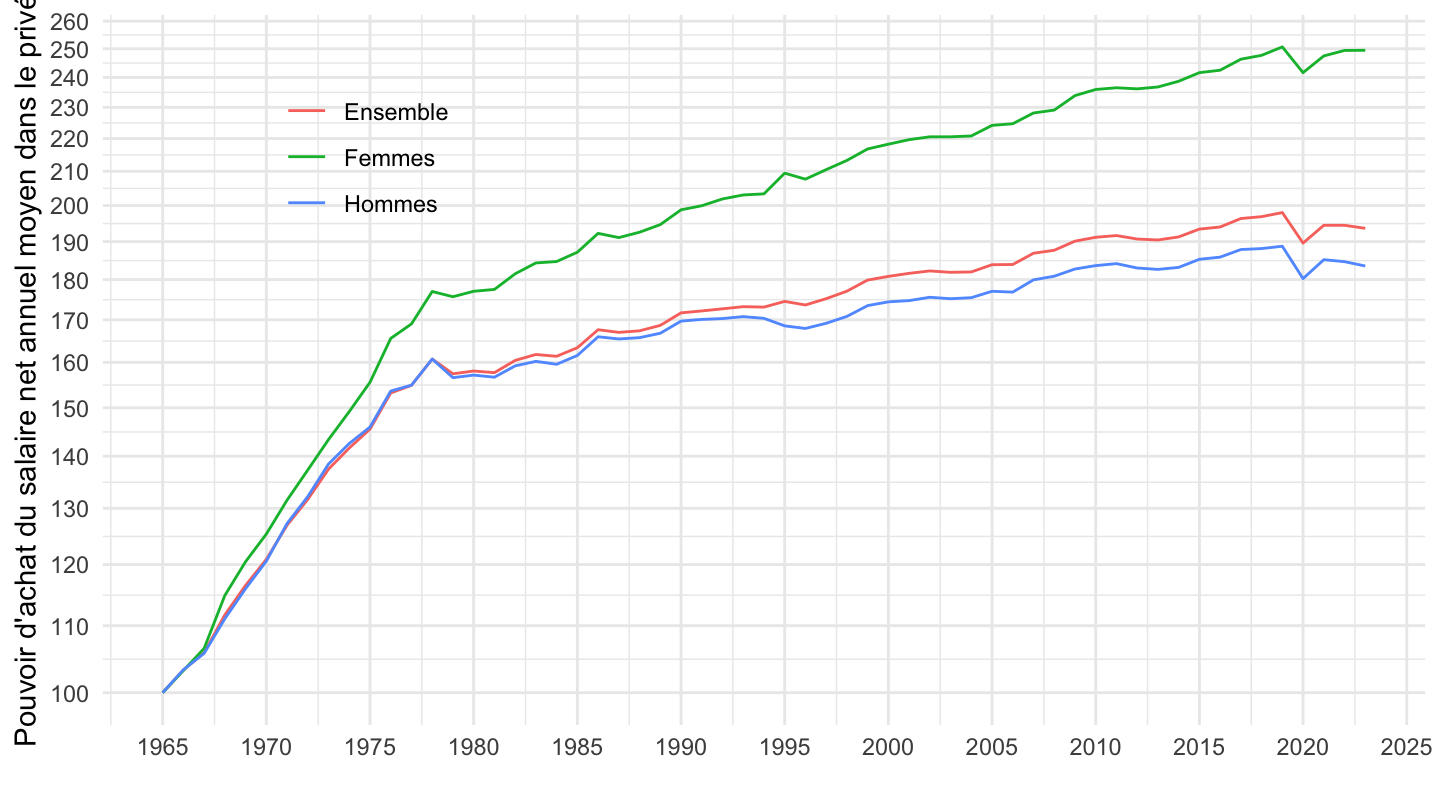
1975-
Code
`SALAIRES-ANNUELS` %>%
  filter(IDBANK %in% c("010752375", "010752373", "010752374")) %>%
  year_to_date() %>%
  filter(date >= as.Date("1975-01-01")) %>%
  left_join(SEXE, by = "SEXE") %>%
  group_by(SEXE) %>%
  arrange(date) %>%
  mutate(OBS_VALUE = 100*OBS_VALUE/OBS_VALUE[date == as.Date("1975-01-01")]) %>%
  ggplot(.) + theme_minimal() +
  xlab("") + ylab("Pouvoir d'achat du salaire net annuel moyen dans le privé") +
  geom_line(aes(x = date, y = OBS_VALUE, color = Sexe)) +
  theme(legend.title = element_blank(),
        legend.position = c(0.2, 0.8)) +
  scale_x_date(breaks = seq(1920, 2100, 5) %>% paste0("-01-01") %>% as.Date(),
               labels = date_format("%Y")) +
  scale_y_log10(breaks = seq(100, 1000, 10))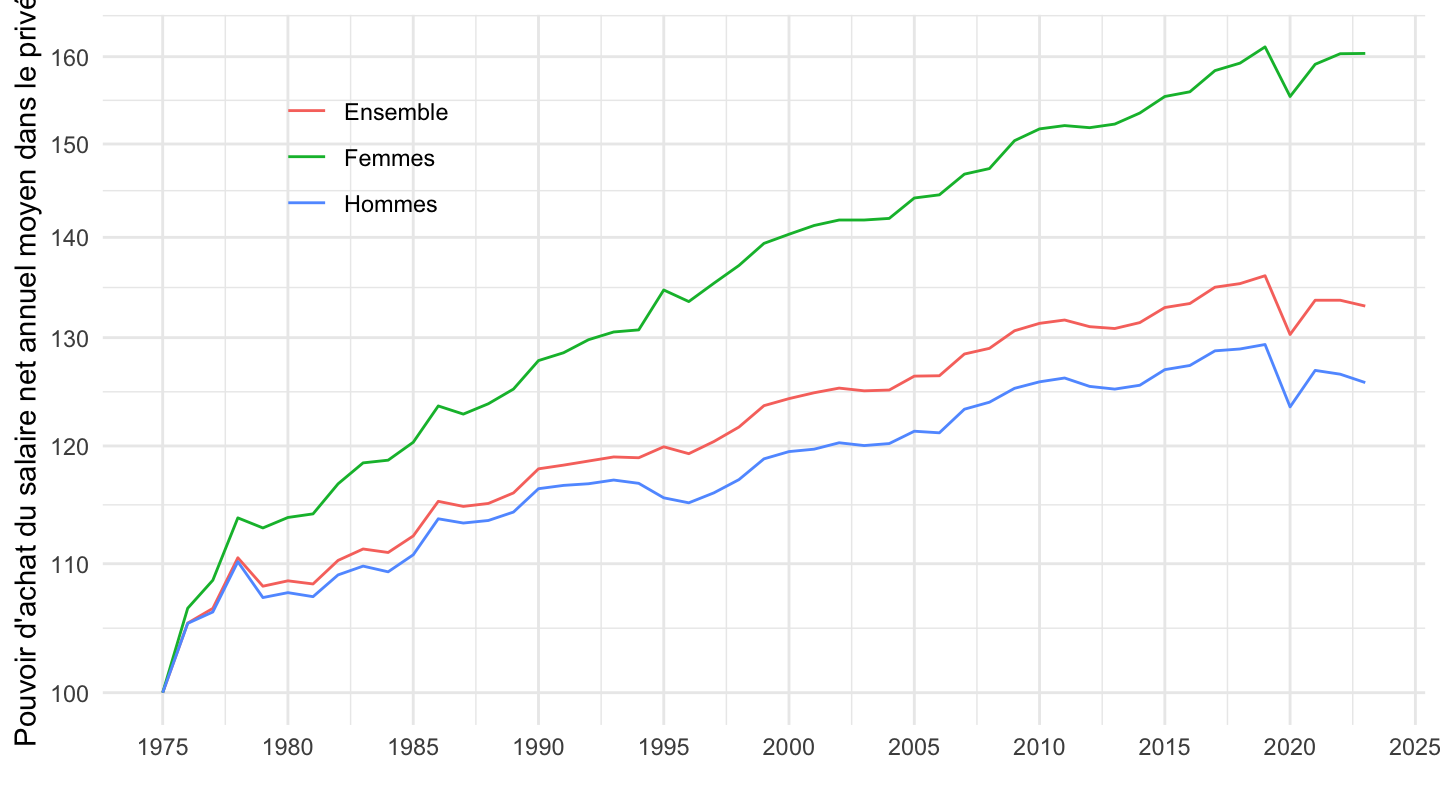
1996-
Code
`SALAIRES-ANNUELS` %>%
  filter(IDBANK %in% c("010752375", "010752373", "010752374")) %>%
  year_to_date() %>%
  filter(date >= as.Date("1996-01-01")) %>%
  left_join(SEXE, by = "SEXE") %>%
  group_by(SEXE) %>%
  arrange(date) %>%
  mutate(OBS_VALUE = 100*OBS_VALUE/OBS_VALUE[date == as.Date("1996-01-01")]) %>%
  ggplot(.) + theme_minimal() +
  xlab("") + ylab("Pouvoir d'achat du salaire net annuel moyen dans le privé") +
  geom_line(aes(x = date, y = OBS_VALUE, color = Sexe)) +
  theme(legend.title = element_blank(),
        legend.position = c(0.2, 0.8)) +
  scale_x_date(breaks = seq(1920, 2100, 5) %>% paste0("-01-01") %>% as.Date(),
               labels = date_format("%Y")) +
  scale_y_log10(breaks = seq(100, 1000, 2))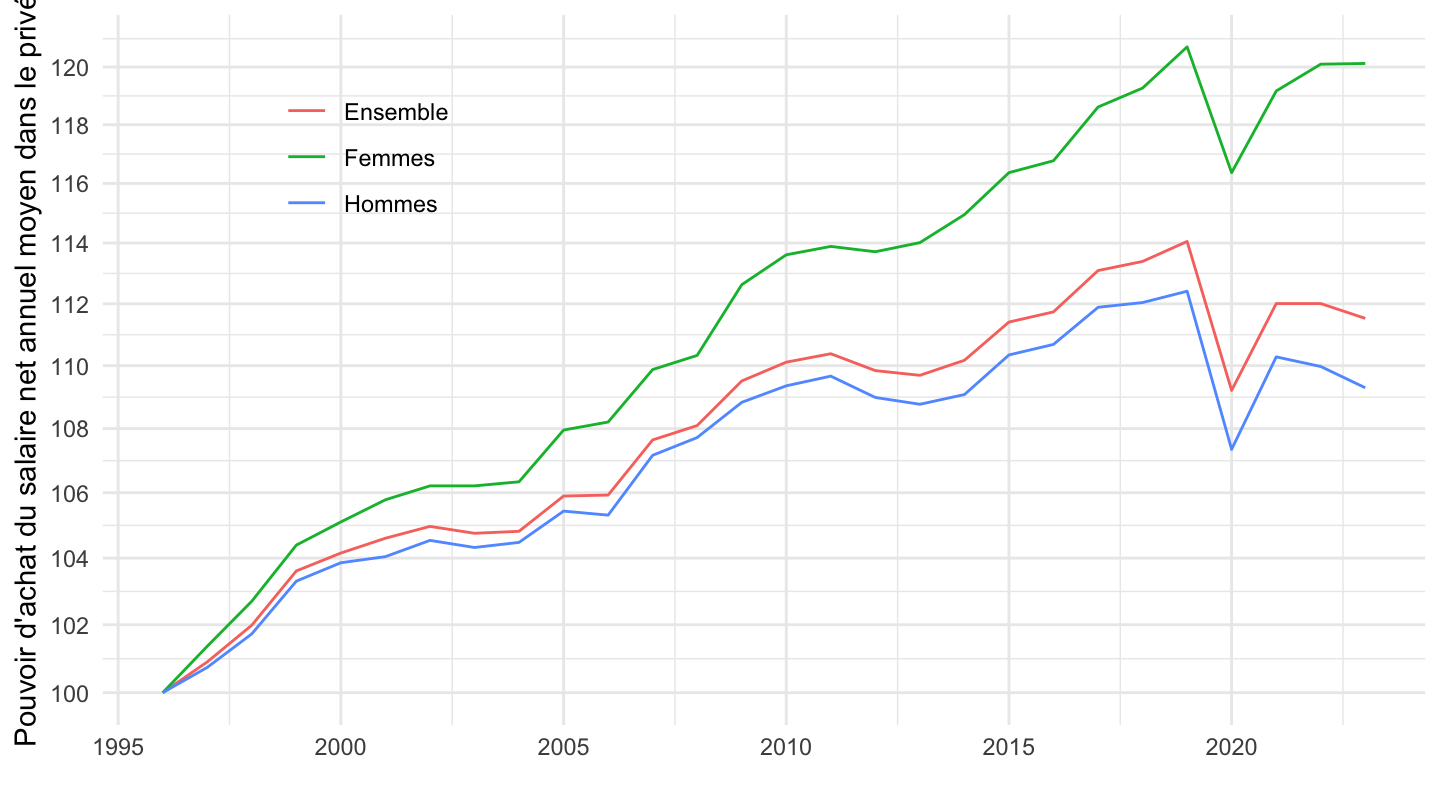
2008-
Tous
Code
`SALAIRES-ANNUELS` %>%
  filter(IDBANK %in% c("010752375", "010752373", "010752374")) %>%
  year_to_date() %>%
  filter(date >= as.Date("2008-01-01")) %>%
  left_join(SEXE, by = "SEXE") %>%
  group_by(SEXE) %>%
  arrange(date) %>%
  mutate(OBS_VALUE = 100*OBS_VALUE/OBS_VALUE[date == as.Date("2008-01-01")]) %>%
  ggplot(.) + theme_minimal() +
  xlab("") + ylab("Pouvoir d'achat du salaire net annuel moyen dans le privé") +
  geom_line(aes(x = date, y = OBS_VALUE, color = Sexe)) +
  theme(legend.title = element_blank(),
        legend.position = c(0.2, 0.8)) +
  scale_x_date(breaks = seq(1920, 2100, 1) %>% paste0("-01-01") %>% as.Date(),
               labels = date_format("%Y")) +
  scale_y_log10(breaks = seq(100, 1000, 2))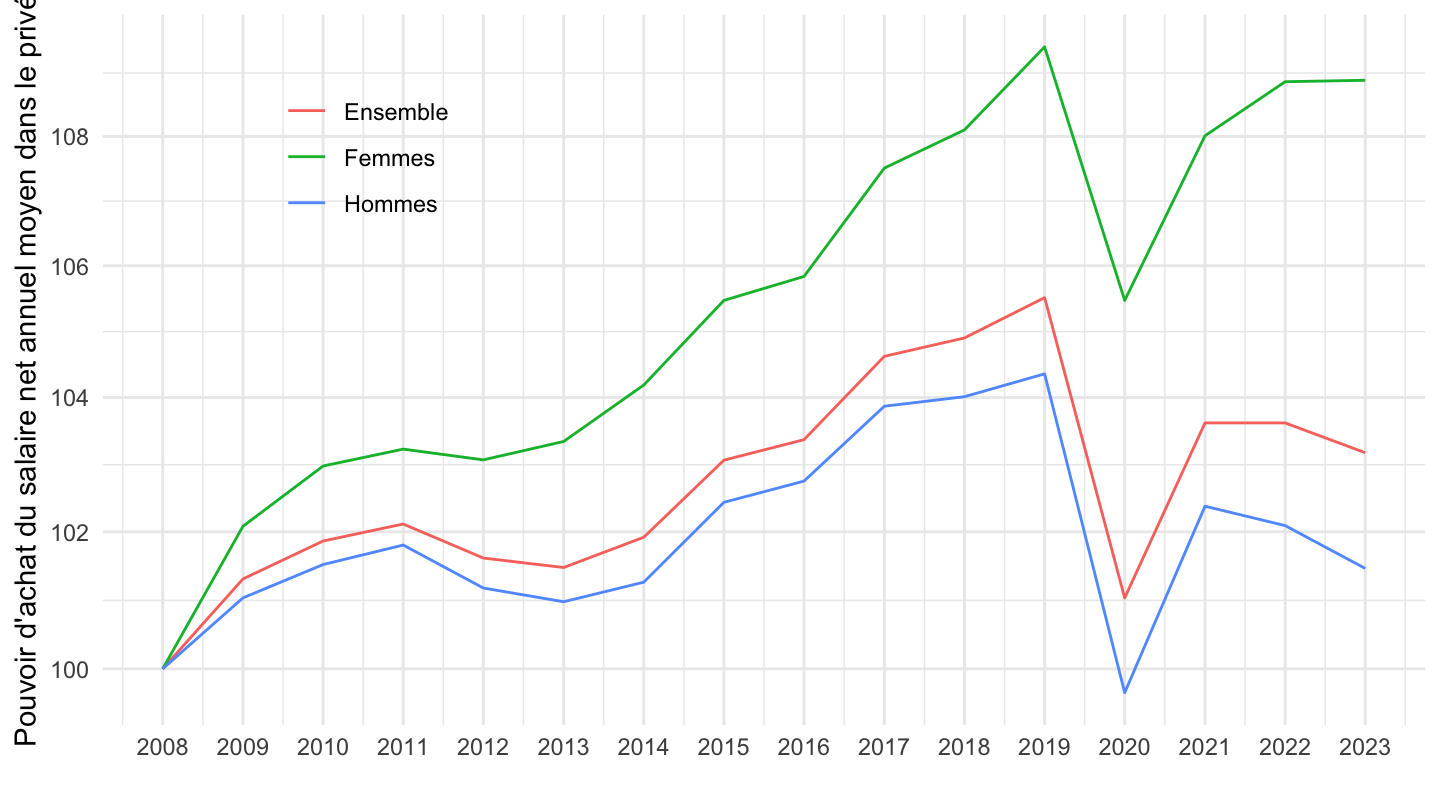
IPC, IPCH
Code
`SALAIRES-ANNUELS` %>%
  filter(IDBANK %in% c("010752375", "010752373", "010752374")) %>%
  year_to_date() %>%
  filter(date >= as.Date("2008-01-01")) %>%
  left_join(SEXE, by = "SEXE") %>%
  group_by(Sexe) %>%
  arrange(date) %>%
  mutate(OBS_VALUE = 100*OBS_VALUE/OBS_VALUE[1]) %>%
  left_join(`inflation-A`, by = "date") %>%
  arrange(date) %>%
  mutate(IPC = IPC/IPC[1],
         IPCH = IPCH/IPCH[1]) %>%
  transmute(date, `Pouvoir d'achat du salaire, IPC` = OBS_VALUE, `Pouvoir d'achat du salaire, IPCH` = OBS_VALUE*IPC/IPCH, Sexe) %>%
  gather(variable, value, -date, -Sexe) %>%
  ggplot(.) + theme_minimal() +
  xlab("") + ylab("Pouvoir d'achat du salaire net annuel moyen dans le privé") +
  geom_line(aes(x = date, y = value, color = Sexe, linetype = variable)) +
  theme(legend.title = element_blank(),
        legend.position = c(0.2, 0.8)) +
  scale_x_date(breaks = seq(1920, 2100, 1) %>% paste0("-01-01") %>% as.Date(),
               labels = date_format("%Y")) +
  scale_y_log10(breaks = seq(90, 1000, 2))