Code
i_g("bib/insee/if230/definition-courants.png")
Data - INSEE
i_g("bib/insee/if230/definition-courants.png")
if230 %>%
  filter(sheet == "Figure 1a") %>%
  ggplot(.) + theme_minimal() + ylab("") + xlab("") +
  geom_line(aes(x = date, y = value, color = Variable)) +
  theme(legend.title = element_blank(),
        legend.position = c(0.3, 0.8)) +
  scale_x_date(breaks = seq(1950, 2022, 2) %>% paste0("-01-01") %>% as.Date,
               labels = date_format("%y")) +
  scale_color_manual(values = viridis(4)[1:3]) +
  scale_y_log10(breaks = seq(0, 400, 5))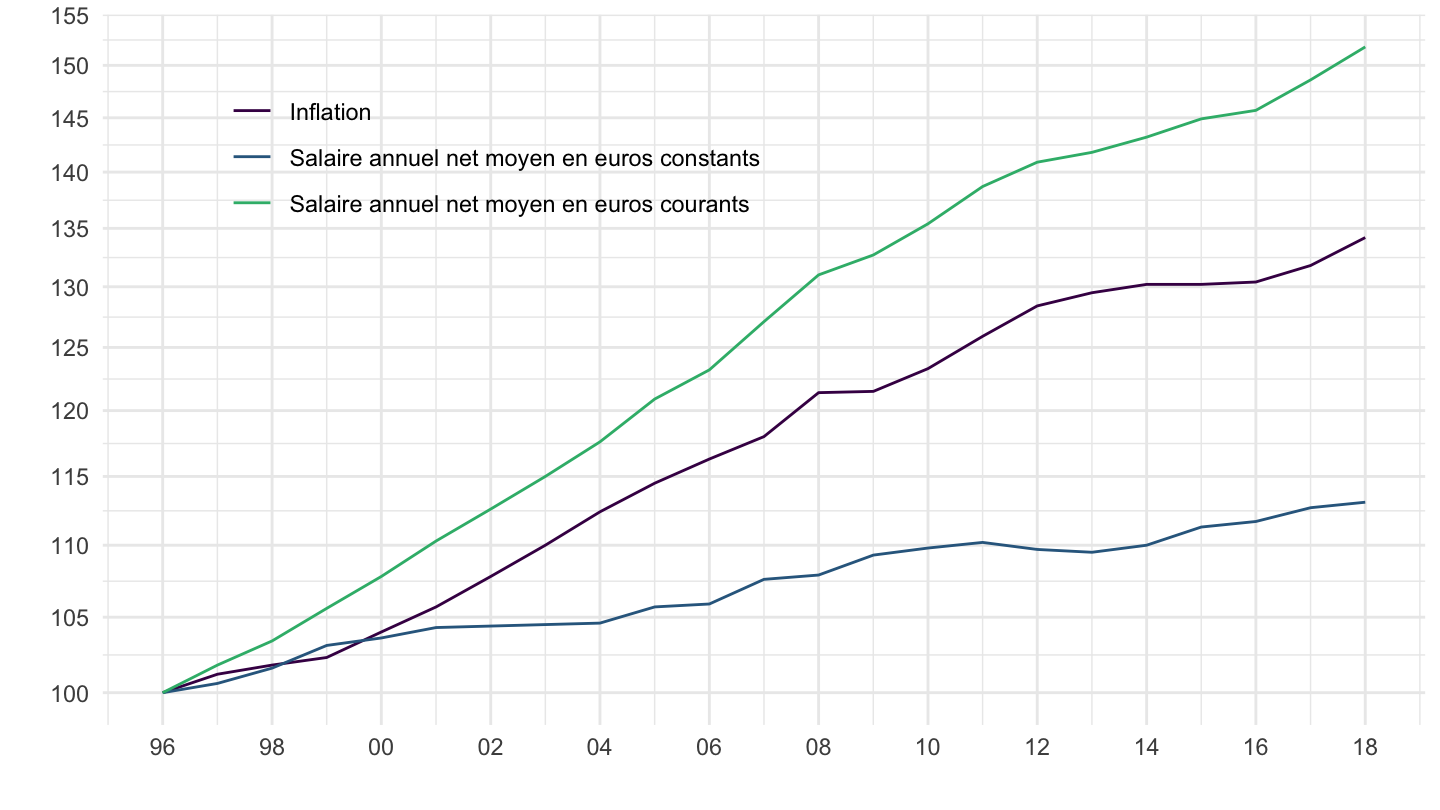
i_g("bib/insee/if230/figure1a.png")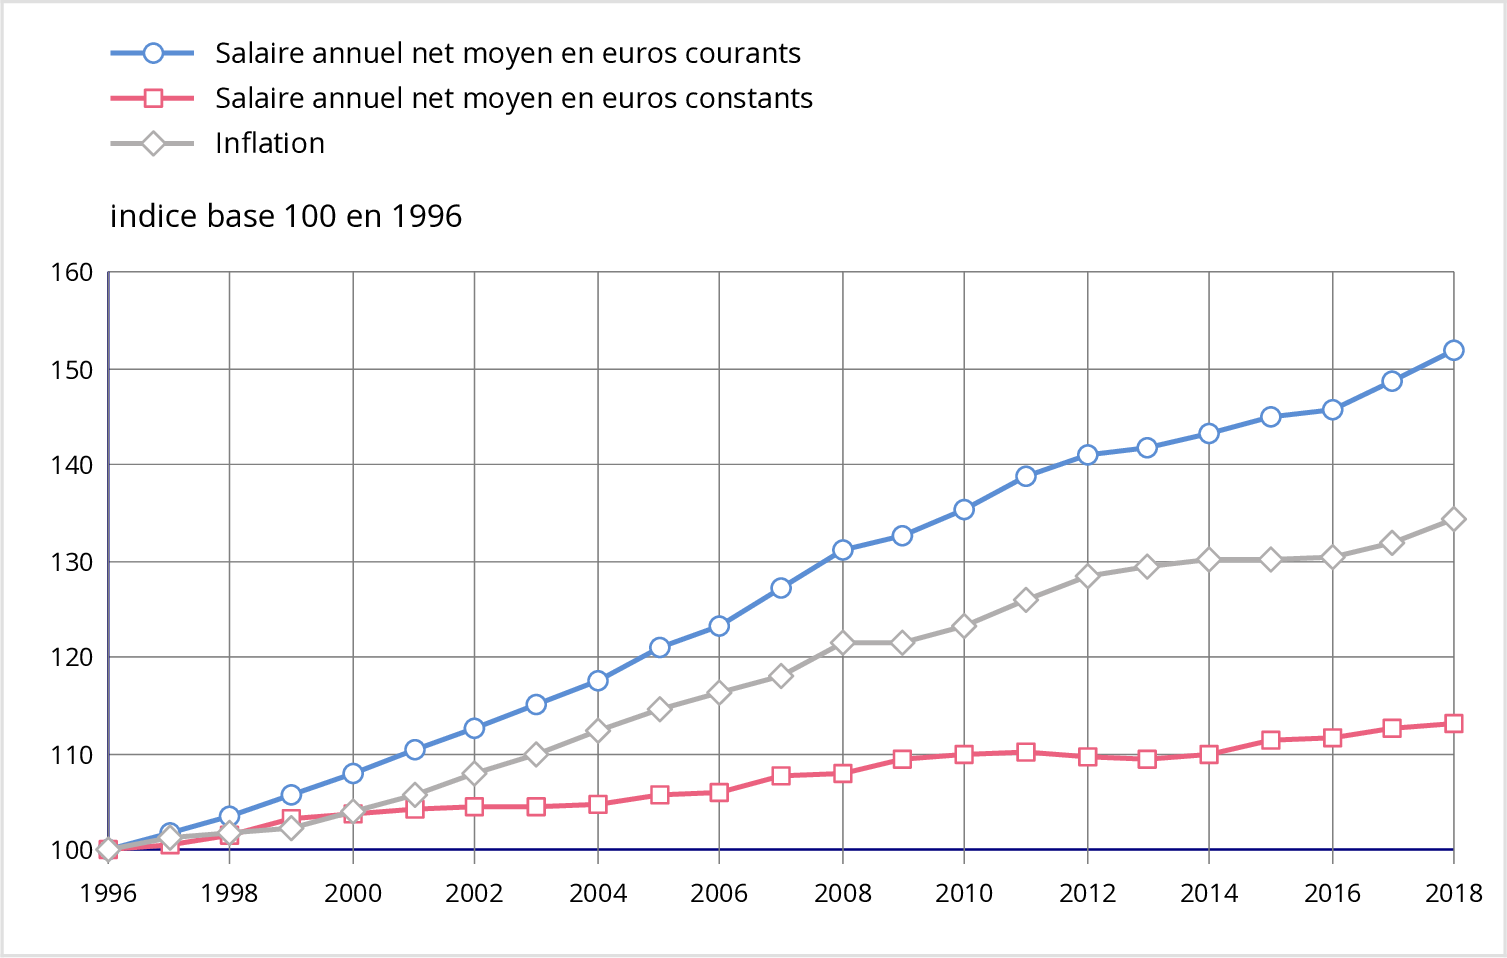
`IPCH-IPC-2015-ensemble` %>%
  filter(date <= as.Date("2018-01-01")) %>%
  ggplot() + ylab("Indice des prix, Ensemble") + xlab("") + theme_minimal() +
  geom_line(aes(x = date, y = OBS_VALUE, color = Indicateur)) +
  scale_color_manual(values = viridis(3)[1:2]) +
  scale_x_date(breaks = seq(1920, 2025, 2) %>% paste0("-01-01") %>% as.Date,
               labels = date_format("%y")) +
  theme(legend.position = c(0.7, 0.2),
        legend.title = element_blank()) +
  scale_y_log10(breaks = seq(10, 300, 5),
                     labels = dollar_format(accuracy = 1, prefix = ""))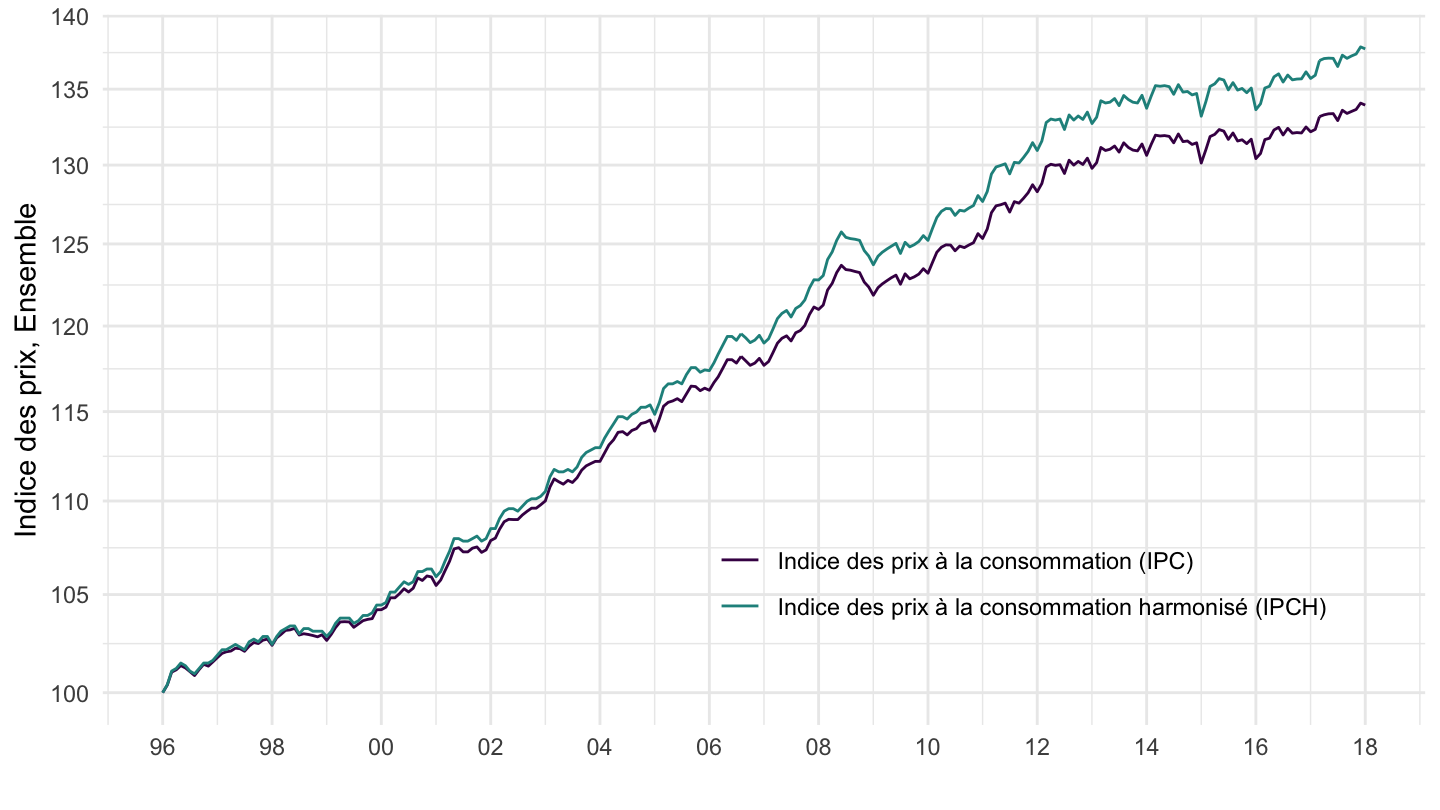
`IPCH-IPC-2015-ratio` <- `IPCH-IPC-2015-ensemble` %>%
  group_by(date) %>%
  summarise(OBS_VALUE = 100*OBS_VALUE[INDICATEUR == "IPCH"]/OBS_VALUE[INDICATEUR == "IPC"])

`IPCH-IPC-2015-ratio` %>%
  filter(date <= as.Date("2018-01-01")) %>%
  ggplot() + ylab("") + xlab("") + theme_minimal() +
  geom_line(aes(x = date, y = OBS_VALUE)) +
  scale_color_manual(values = viridis(3)[1:2]) +
  scale_x_date(breaks = seq(1920, 2025, 2) %>% paste0("-01-01") %>% as.Date,
               labels = date_format("%y")) +
  theme(legend.position = c(0.7, 0.2),
        legend.title = element_blank()) +
  scale_y_log10(breaks = seq(10, 300, 0.5),
                     labels = dollar_format(accuracy = .1, prefix = ""))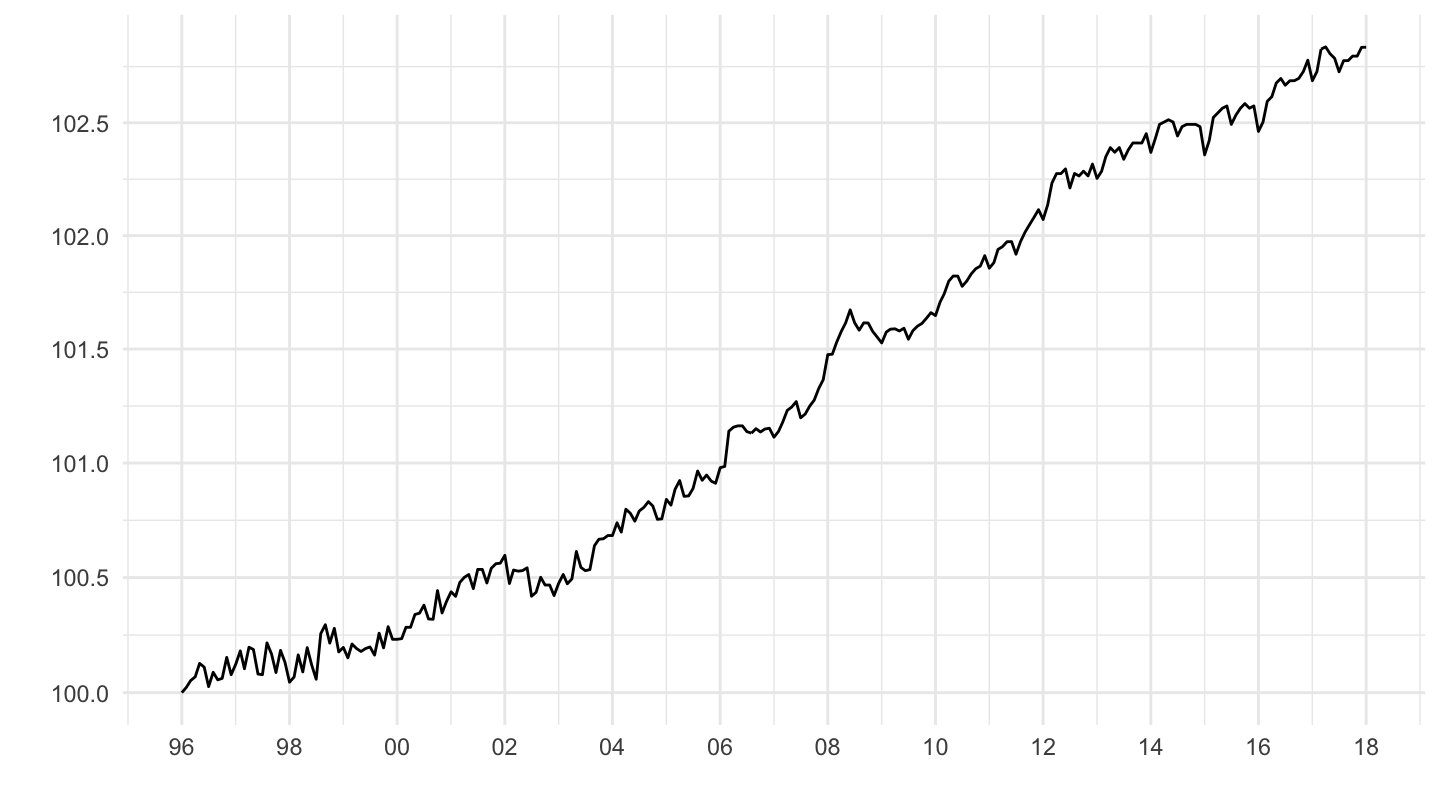
`IPCH-IPC-2015-ratio` %>%
  ggplot() + ylab("") + xlab("") + theme_minimal() +
  geom_line(aes(x = date, y = OBS_VALUE)) +
  scale_color_manual(values = viridis(3)[1:2]) +
  scale_x_date(breaks = seq(1920, 2025, 2) %>% paste0("-01-01") %>% as.Date,
               labels = date_format("%y")) +
  theme(legend.position = c(0.7, 0.2),
        legend.title = element_blank()) +
  scale_y_log10(breaks = seq(10, 300, 0.5),
                     labels = dollar_format(accuracy = .1, prefix = ""))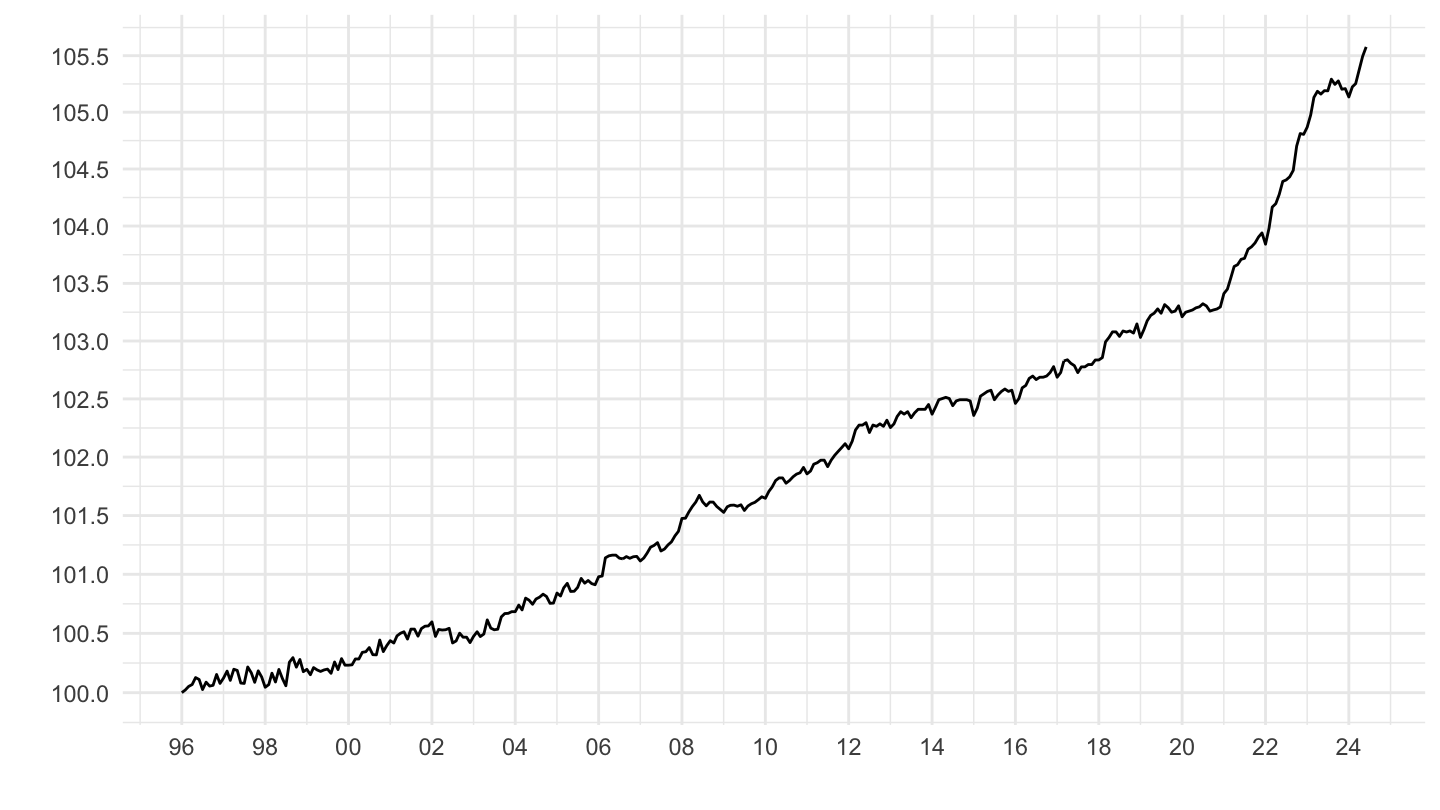
`IPCH-IPC-2015-ensemble` %>%
  filter(date <= as.Date("2018-01-01")) %>%
  group_by(INDICATEUR) %>%
  summarise(OBS_VALUE = last(OBS_VALUE),
            date = last(date)) %>%
print_table_conditional()| INDICATEUR | OBS_VALUE | date |
|---|---|---|
| IPC | 133.9344 | 2018-01-01 |
| IPCH | 137.7328 | 2018-01-01 |
if230 %>%
  filter(sheet == "Figure 1b") %>%
  ggplot(.) + theme_minimal() + ylab("") + xlab("") +
  geom_line(aes(x = date, y = value, color = Variable)) +
  theme(legend.title = element_blank(),
        legend.position = c(0.7, 0.2)) +
  scale_x_date(breaks = seq(1950, 2022, 5) %>% paste0("-01-01") %>% as.Date,
               labels = date_format("%y")) +
  scale_color_manual(values = viridis(3)[1:2]) +
  scale_y_log10(breaks = seq(0, 400, 50))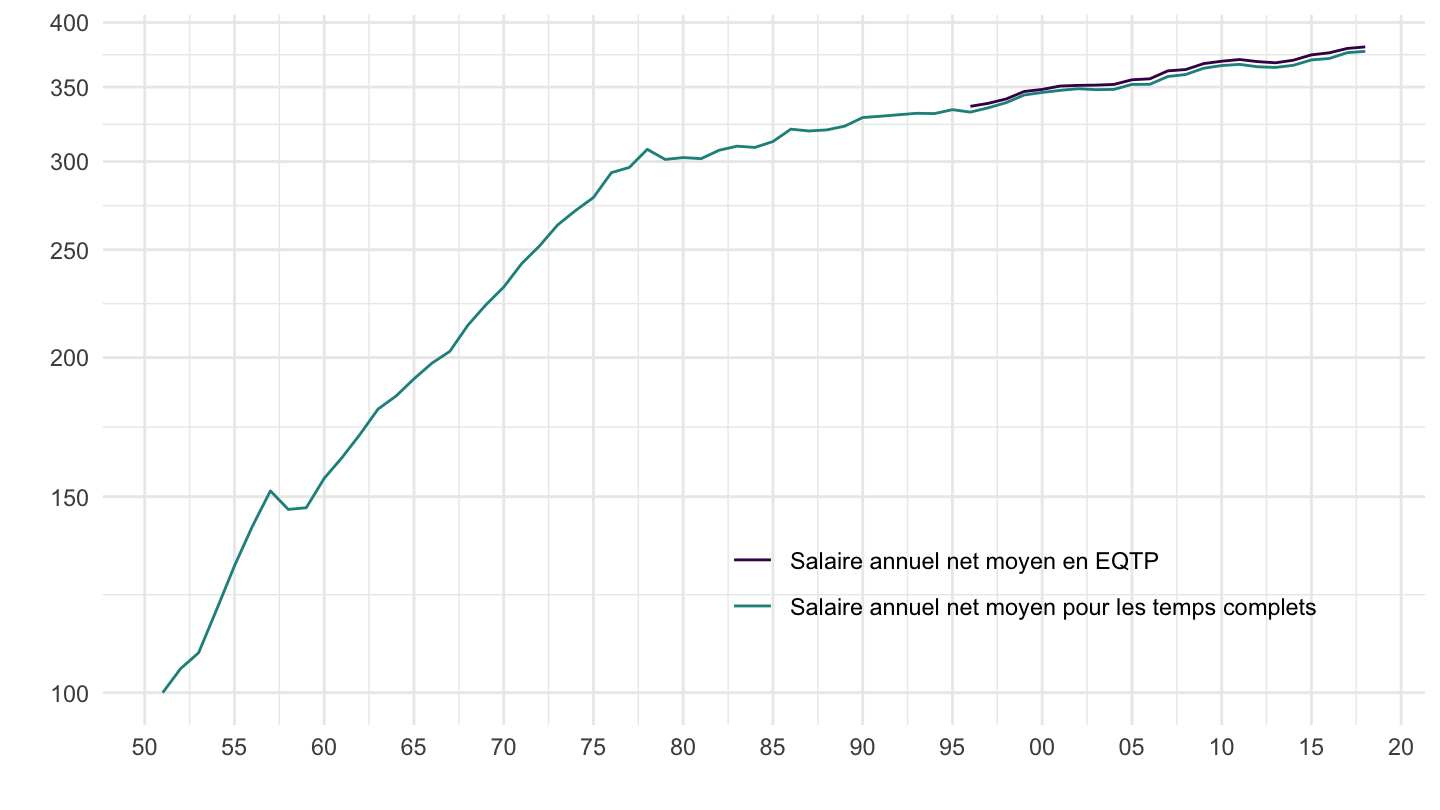
if230 %>%
  filter(sheet == "Figure 3") %>%
  ggplot(.) + theme_minimal() + ylab("") + xlab("") +
  geom_line(aes(x = date, y = value, color = Variable)) +
  theme(legend.title = element_blank(),
        legend.position = c(0.2, 0.8)) +
  scale_x_date(breaks = seq(1950, 2022, 2) %>% paste0("-01-01") %>% as.Date,
               labels = date_format("%y")) +
  #scale_color_manual(values = viridis(6)[1:5]) +
  scale_y_log10(breaks = seq(0, 200, 1))
IPC_IPCH_adjustment <- `IPCH-IPC-2015-ensemble` %>%
  group_by(date) %>%
  summarise(OBS_VALUE = 100*OBS_VALUE[INDICATEUR == "IPCH"]/OBS_VALUE[INDICATEUR == "IPC"]) %>%
  filter(month(date) == 1,
         date <= as.Date("2018-01-01")) %>%
  select(date, IPC_IPCH_adjustment = OBS_VALUE)

if230 %>%
  left_join(IPC_IPCH_adjustment, by = "date") %>%
  filter(sheet == "Figure 3") %>%
  ggplot(.) + theme_minimal() + ylab("") + xlab("") +
  geom_line(aes(x = date, y = 100*value/IPC_IPCH_adjustment, color = Variable)) +
  theme(legend.title = element_blank(),
        legend.position = c(0.2, 0.8)) +
  scale_x_date(breaks = seq(1950, 2022, 2) %>% paste0("-01-01") %>% as.Date,
               labels = date_format("%y")) +
  #scale_color_manual(values = viridis(6)[1:5]) +
  scale_y_log10(breaks = seq(0, 200, 1))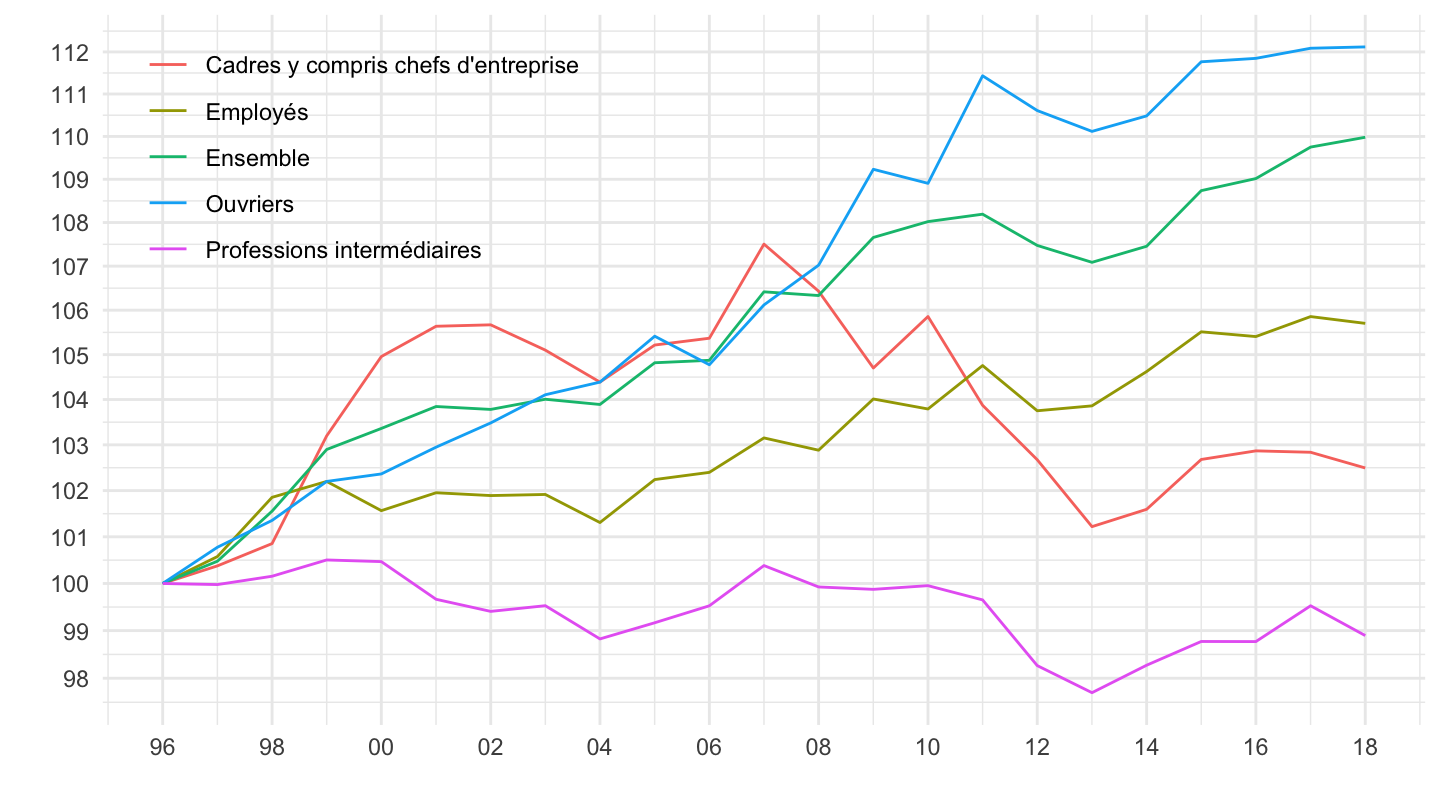
i_g("bib/insee/if230/figure3.png")
if230 %>%
  filter(sheet == "Figure 4") %>%
  ggplot(.) + theme_minimal() + ylab("") + xlab("") +
  geom_line(aes(x = date, y = value, color = Variable)) +
  theme(legend.title = element_blank(),
        legend.position = c(0.2, 0.8)) +
  scale_x_date(breaks = seq(1950, 2022, 2) %>% paste0("-01-01") %>% as.Date,
               labels = date_format("%y")) +
  #scale_color_manual(values = viridis(6)[1:5]) +
  scale_y_log10(breaks = seq(0, 200, 2))
IPC_IPCH_adjustment <- `IPCH-IPC-2015-ensemble` %>%
  group_by(date) %>%
  summarise(OBS_VALUE = 100*OBS_VALUE[INDICATEUR == "IPCH"]/OBS_VALUE[INDICATEUR == "IPC"]) %>%
  filter(month(date) == 1,
         date <= as.Date("2018-01-01")) %>%
  select(date, IPC_IPCH_adjustment = OBS_VALUE)

if230 %>%
  left_join(IPC_IPCH_adjustment, by = "date") %>%
  filter(sheet == "Figure 4") %>%
  ggplot(.) + theme_minimal() + ylab("") + xlab("") +
  geom_line(aes(x = date, y = 100*value/IPC_IPCH_adjustment, color = Variable)) +
  theme(legend.title = element_blank(),
        legend.position = c(0.2, 0.8)) +
  scale_x_date(breaks = seq(1950, 2022, 2) %>% paste0("-01-01") %>% as.Date,
               labels = date_format("%y")) +
  #scale_color_manual(values = viridis(6)[1:5]) +
  scale_y_log10(breaks = seq(0, 200, 1))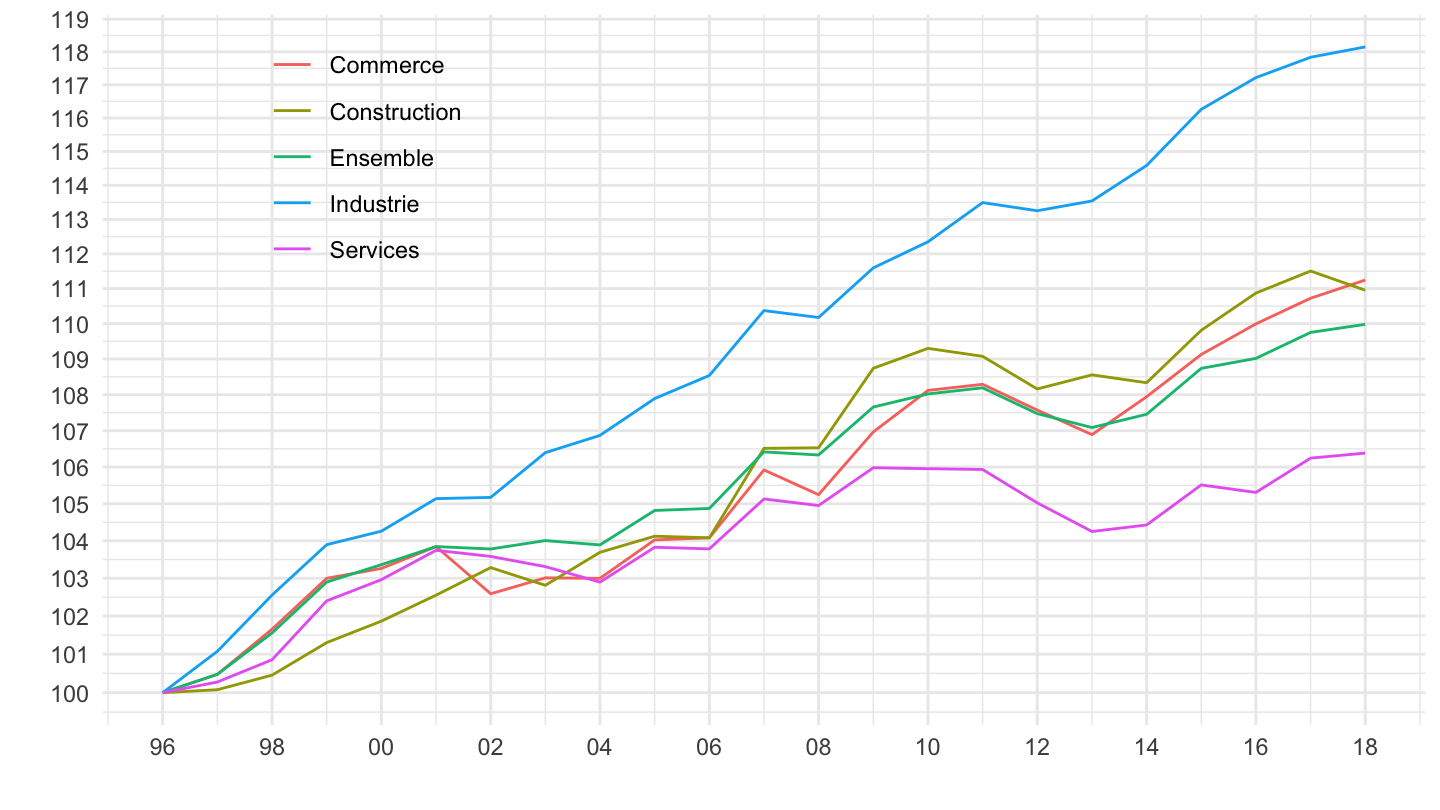
i_g("bib/insee/if230/figure4.png")