
Last observation: août 2026 (N = 2) · 2025 (N = 826)
First observation: 1901 (N = 4) · janv. 1946 (N = 1)
Last data update: 15 oct. 2026, 23:45
Last compile: 16 oct. 2026, 01:59
`NAISSANCES-FECONDITE` |>
  group_by(IDBANK, TITLE_FR) |>
  summarise(Nobs = n()) |>
  arrange(-Nobs) |>
print_table_conditional()`NAISSANCES-FECONDITE` |>
filter(IDBANK == "000436391") |>
month_to_date() |>
arrange(date) |>
mutate(OBS_VALUE = rollsum(x = OBS_VALUE, 12, align = "right", fill = NA)) |>
ggplot() + geom_line(aes(x = date, y = OBS_VALUE)) +
scale_x_date(breaks = seq(1880, 2100, 5) |> paste0("-01-01") |> as.Date(),
labels = date_format("%Y")) +
scale_y_continuous(breaks = seq(0, 1000000, 20000),
labels = dollar_format(pre = "")) +
theme_minimal() + xlab("") + ylab("Nombre de naissances sur les 12 derniers mois")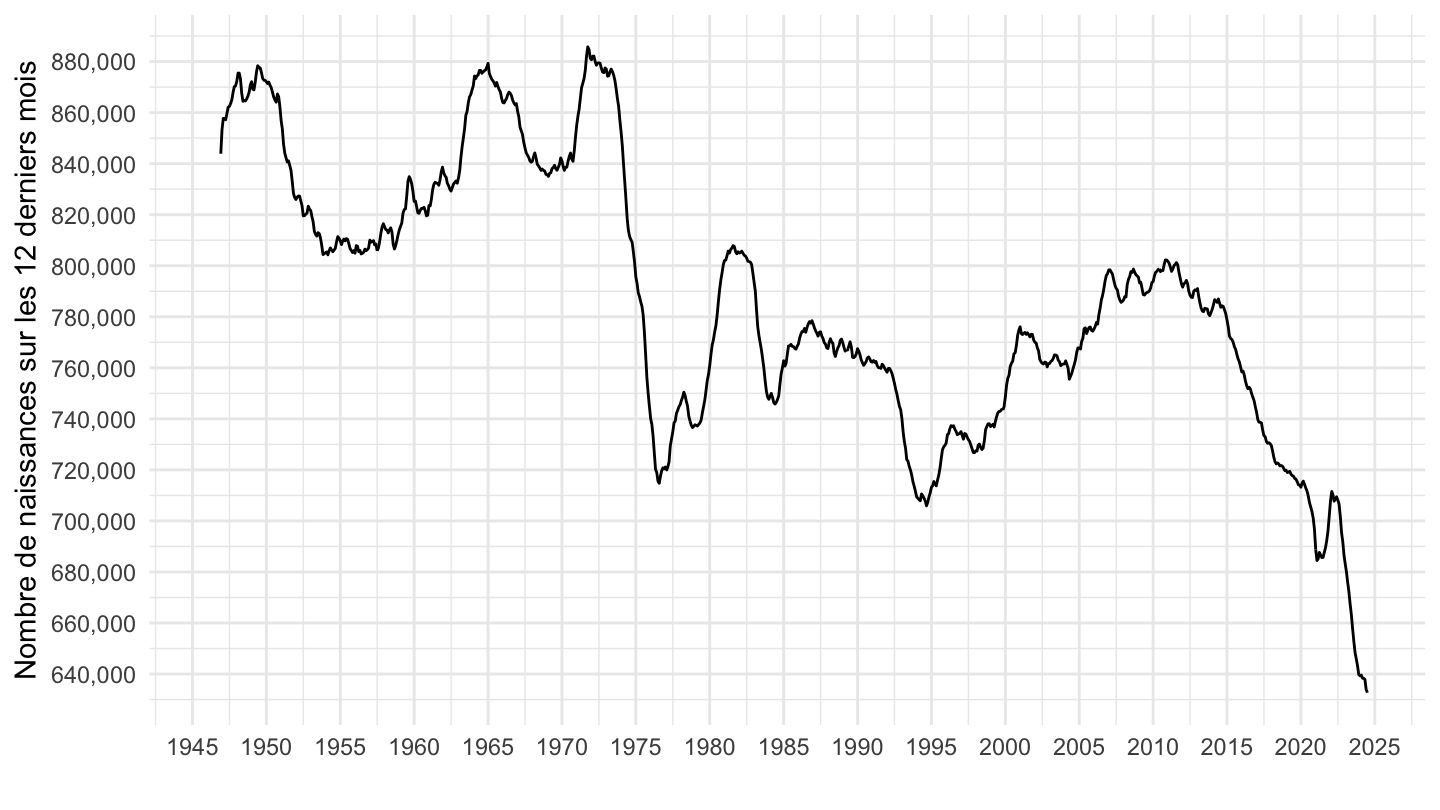
`NAISSANCES-FECONDITE` |>
  filter(IDBANK == "000436391") |>
  month_to_date() |>
  arrange(date) |>
  mutate(OBS_VALUE = rollsum(x = OBS_VALUE, 12, align = "right", fill = NA)) |>
  filter(date >= as.Date("1990-01-01")) |>
  ggplot() + geom_line(aes(x = date, y = OBS_VALUE)) +
  scale_x_date(breaks = seq(1880, 2100, 5) |> paste0("-01-01") |> as.Date(),
               labels = date_format("%Y")) +
  scale_y_continuous(breaks = seq(0, 1000000, 20000),
                     labels = dollar_format(pre = "")) +
  theme_minimal() + xlab("") + ylab("Nombre de naissances sur les 12 derniers mois")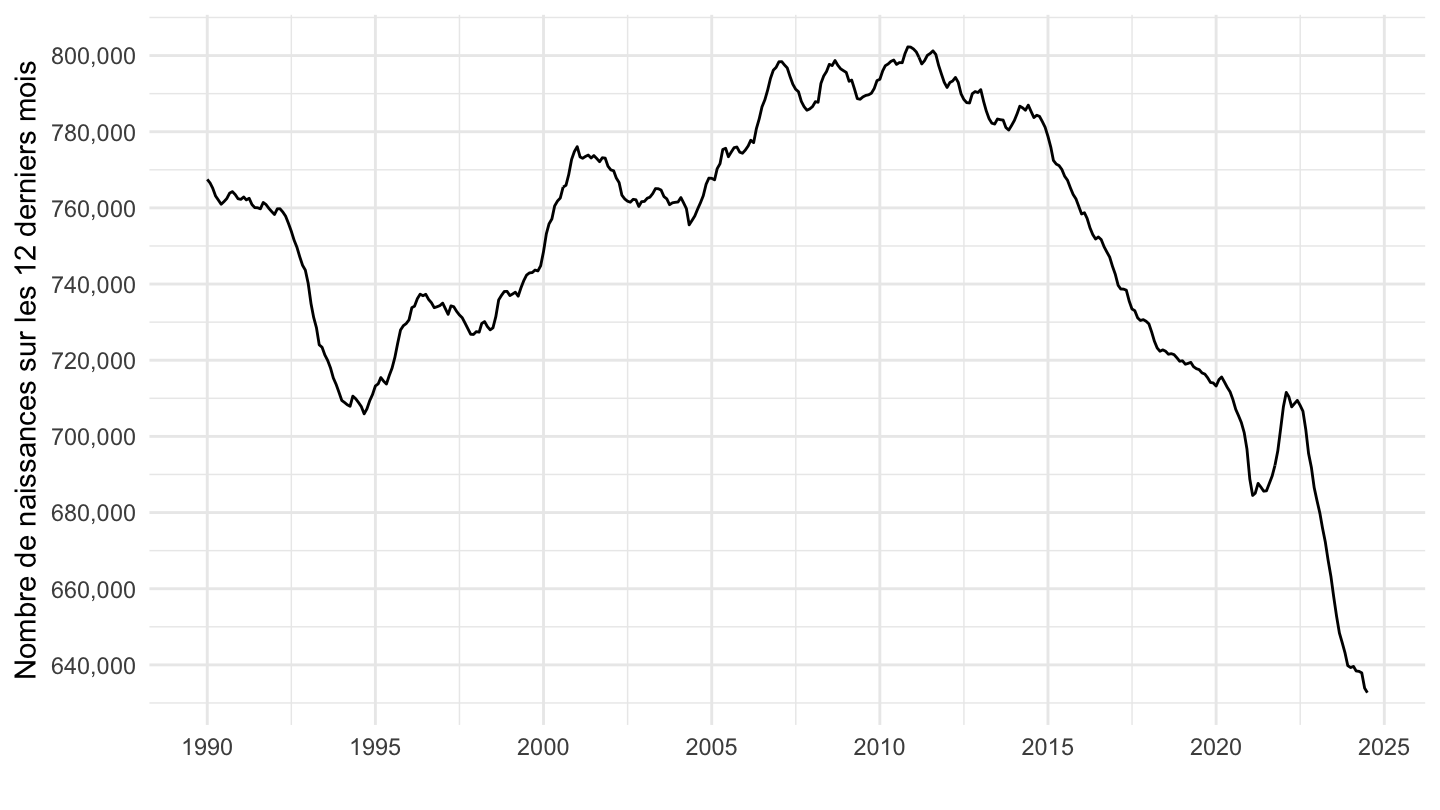
`NAISSANCES-FECONDITE` |>
  filter(IDBANK == "000436391") |>
  month_to_date() |>
  arrange(date) |>
  mutate(OBS_VALUE = rollsum(x = OBS_VALUE, 12, align = "right", fill = NA)) |>
  filter(date >= as.Date("2000-01-01")) |>
  ggplot() + geom_line(aes(x = date, y = OBS_VALUE)) +
  scale_x_date(breaks = seq(1880, 2100, 5) |> paste0("-01-01") |> as.Date(),
               labels = date_format("%Y")) +
  scale_y_continuous(breaks = seq(0, 1000000, 20000),
                     labels = dollar_format(pre = "")) +
  theme_minimal() + xlab("") + ylab("Nombre de naissances sur les 12 derniers mois")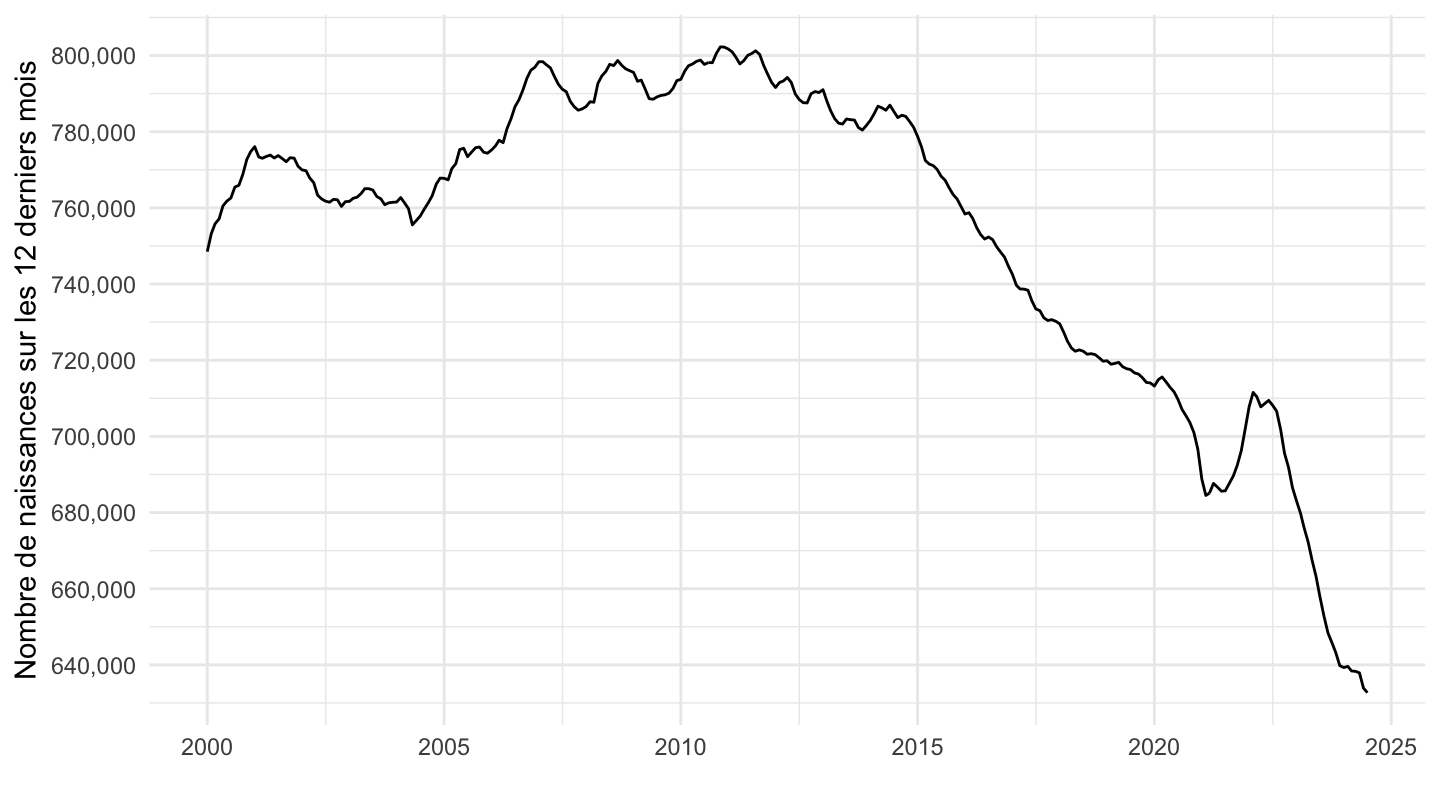
`NAISSANCES-FECONDITE` |>
  filter(IDBANK == "000436391") |>
  month_to_date() |>
  arrange(date) |>
  mutate(OBS_VALUE = rollsum(x = OBS_VALUE, 12, align = "right", fill = NA)) |>
  filter(date >= as.Date("2012-01-01")) |>
  ggplot() + geom_line(aes(x = date, y = OBS_VALUE)) +
  scale_x_date(breaks = seq(1880, 2100, 2) |> paste0("-01-01") |> as.Date(),
               labels = date_format("%Y")) +
  scale_y_continuous(breaks = seq(0, 1000000, 20000),
                     labels = dollar_format(pre = "")) +
  theme_minimal() + xlab("") + ylab("Nombre de naissances sur les 12 derniers mois")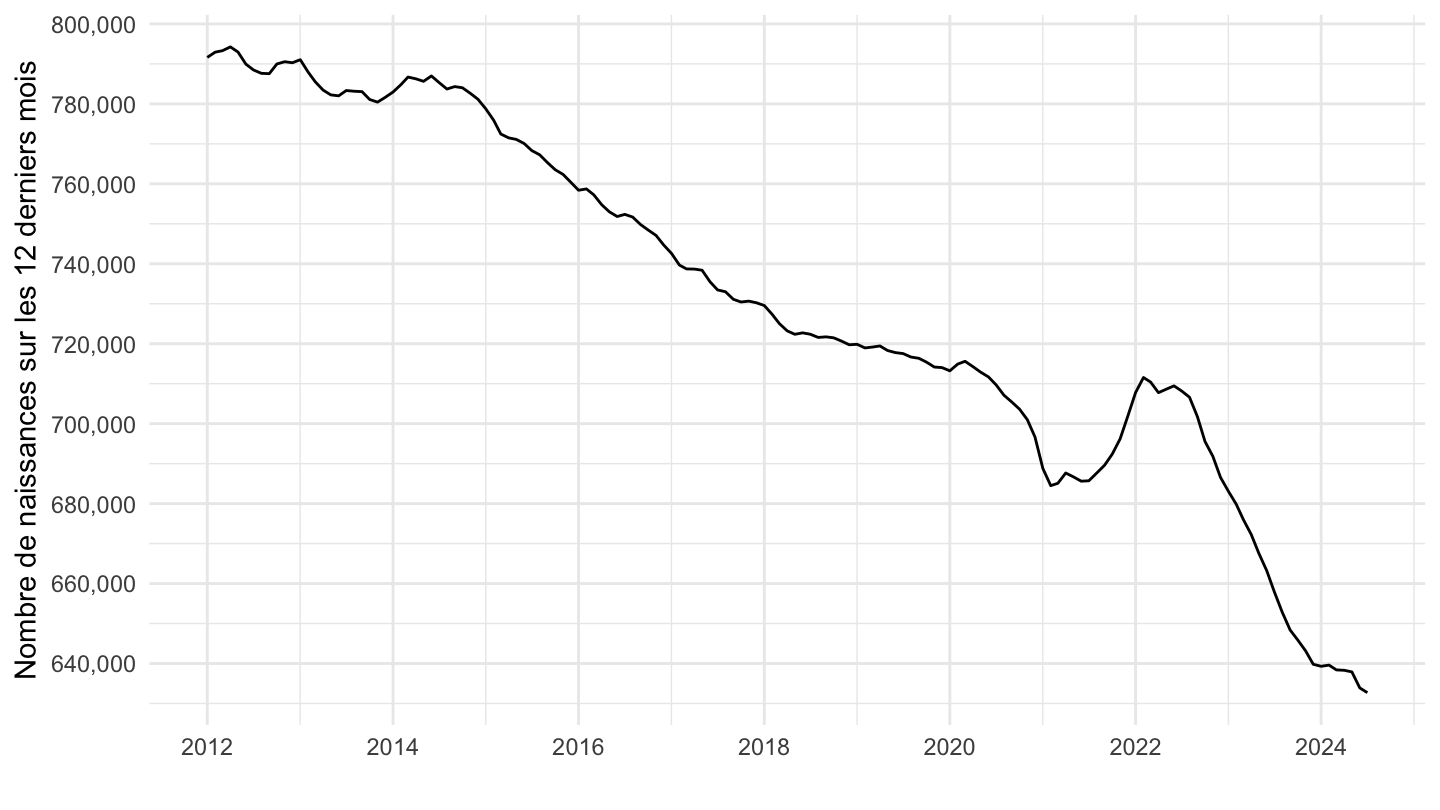
`NAISSANCES-FECONDITE` |>
  filter(IDBANK == "000436391") |>
  month_to_date() |>
  arrange(date) |>
  mutate(OBS_VALUE = rollsum(x = OBS_VALUE, 12, align = "right", fill = NA)) |>
  filter(date >= as.Date("2018-01-01")) |>
  ggplot() + geom_line(aes(x = date, y = OBS_VALUE)) +
  scale_x_date(breaks = seq(1880, 2100, 1) |> paste0("-01-01") |> as.Date(),
               labels = date_format("%Y")) +
  scale_y_continuous(breaks = seq(0, 1000000, 20000),
                     labels = dollar_format(pre = "")) +
  theme_minimal() + xlab("") + ylab("Nombre de naissances sur les 12 derniers mois")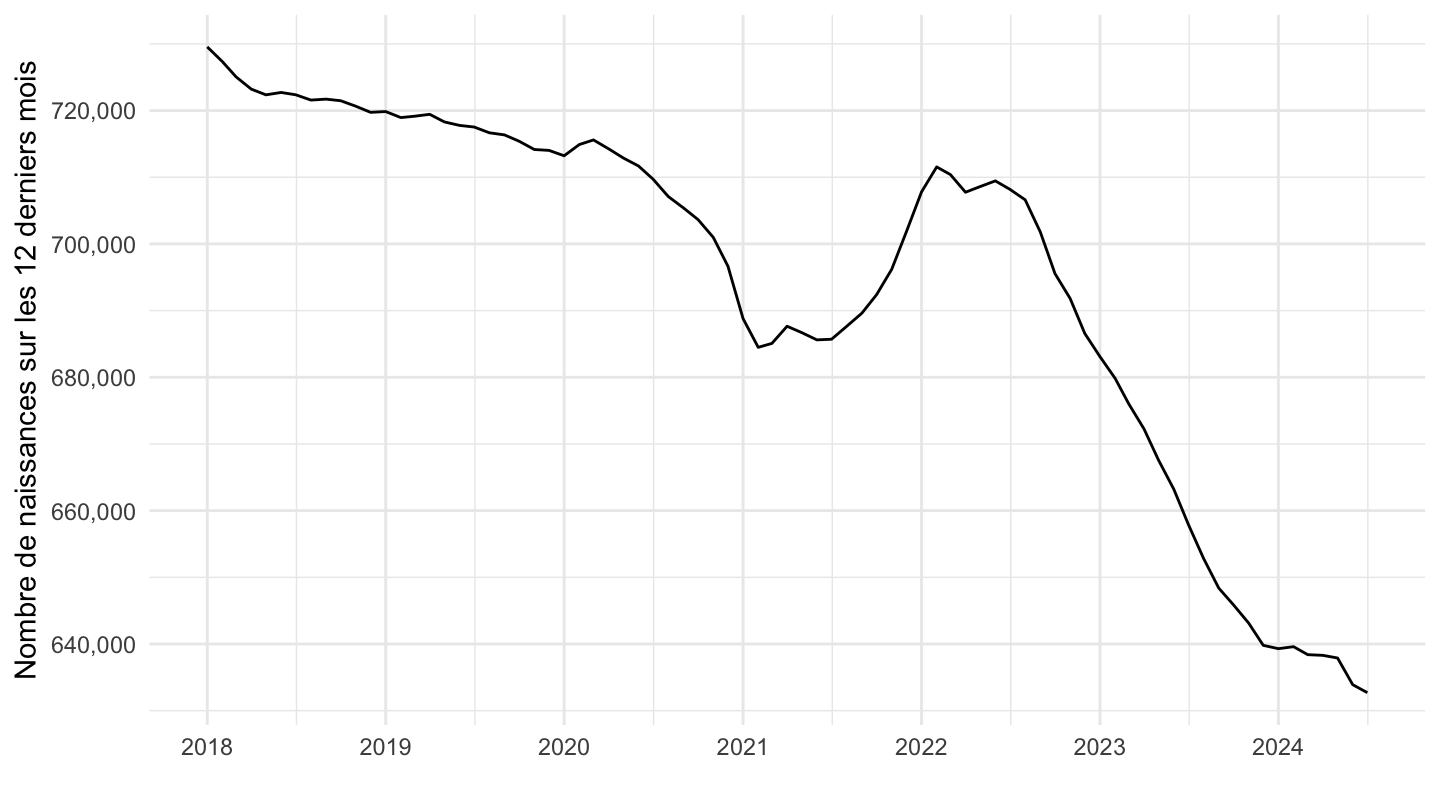
`NAISSANCES-FECONDITE` |>
  filter(IDBANK == "000436391") |>
  month_to_date() |>
  arrange(date) |>
  mutate(OBS_VALUE = rollsum(x = OBS_VALUE, 12, align = "right", fill = NA)) |>
  filter(date >= Sys.Date() - years(1)) |>
  ggplot() + geom_line(aes(x = date, y = OBS_VALUE)) +
  scale_x_date(breaks = "1 month",
               labels = date_format("%B %Y")) +
  scale_y_continuous(breaks = seq(0, 1000000, 1000),
                     labels = dollar_format(pre = "")) +
  theme_minimal() +
  theme(legend.position = "none",
        axis.text.x = element_text(angle = 45, vjust = 1, hjust = 1)) +
  xlab("") + ylab("Nombre de naissances sur les 12 derniers mois") +
  geom_text_repel(aes(x =  date, y = OBS_VALUE, label = scales::comma(OBS_VALUE)))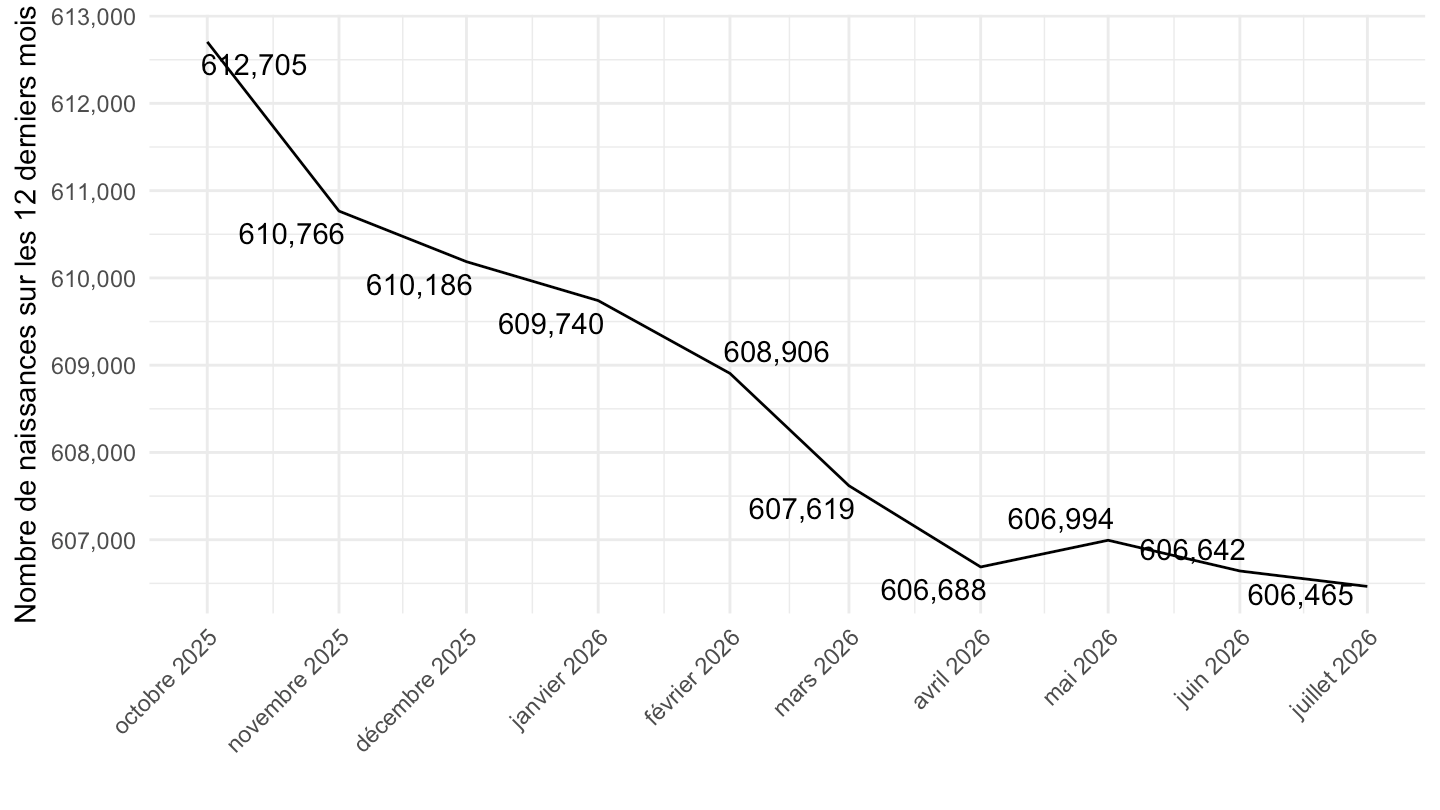
`NAISSANCES-FECONDITE` |>
  filter(IDBANK == "000436391") |>
  month_to_date() |>
  arrange(date) |>
  mutate(OBS_VALUE = rollsum(x = OBS_VALUE, 12, align = "right", fill = NA),
         change = OBS_VALUE - lag(OBS_VALUE, 24)) |>
  ggplot() + geom_line(aes(x = date, y = change)) +
  scale_x_date(breaks = seq(1880, 2100, 5) |> paste0("-01-01") |> as.Date(),
               labels = date_format("%Y")) +
  scale_y_continuous(breaks = seq(-1000000, 1000000, 20000),
                     labels = dollar_format(pre = "")) +
  theme_minimal() + xlab("") + ylab("Variation sur 2 ans\ndu nombre de naissances sur les 12 derniers mois")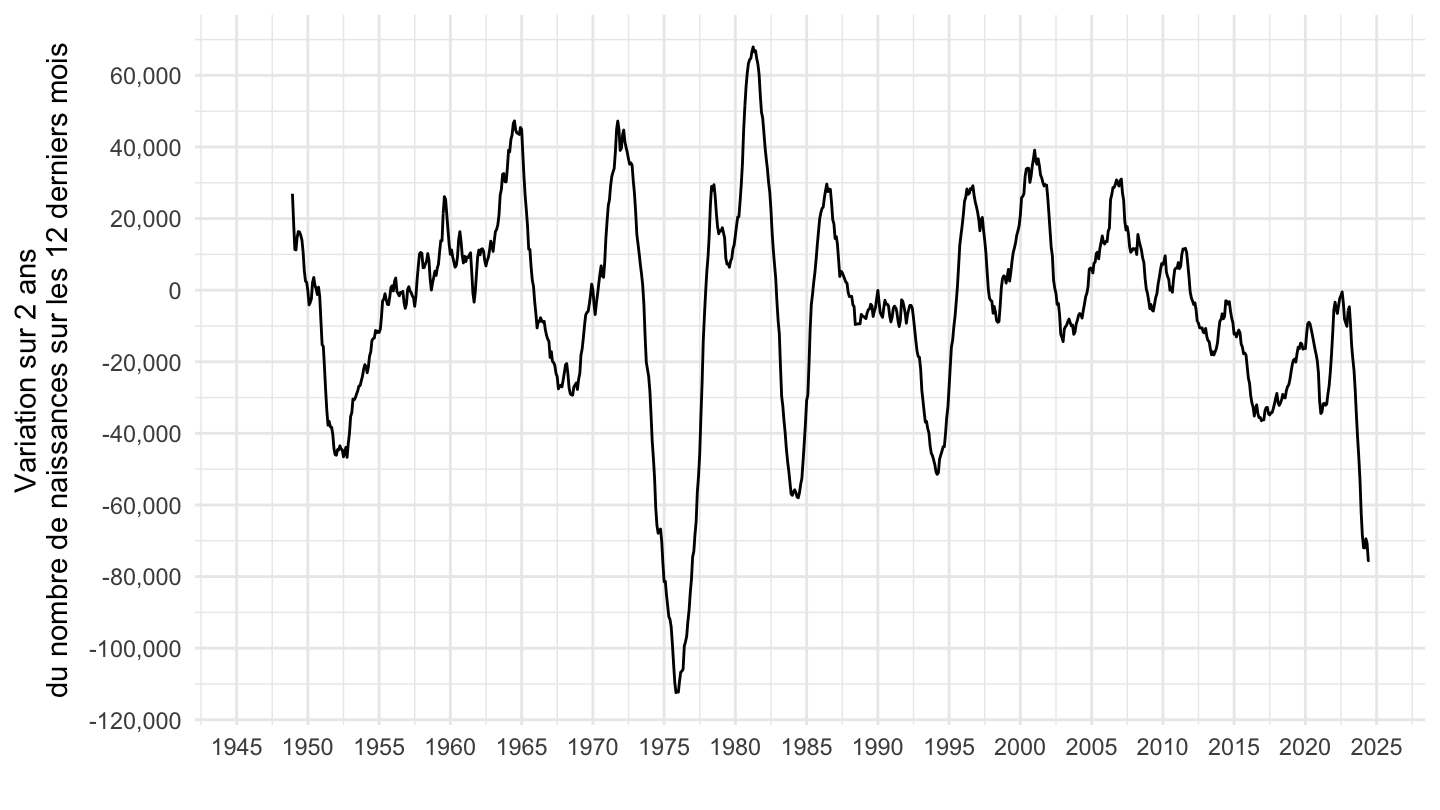
`NAISSANCES-FECONDITE` |>
  filter(IDBANK == "000436391") |>
  month_to_date() |>
  ggplot() + geom_line(aes(x = date, y = OBS_VALUE/30)) +
  scale_x_date(breaks = seq(1880, 2100, 5) |> paste0("-01-01") |> as.Date(),
               labels = date_format("%Y")) +
  scale_y_continuous(breaks = 100*seq(1, 1000, 1),
                     labels = dollar_format(pre = "")) +
  theme_minimal() + xlab("") + ylab("Nombre de naissances vivantes/jour")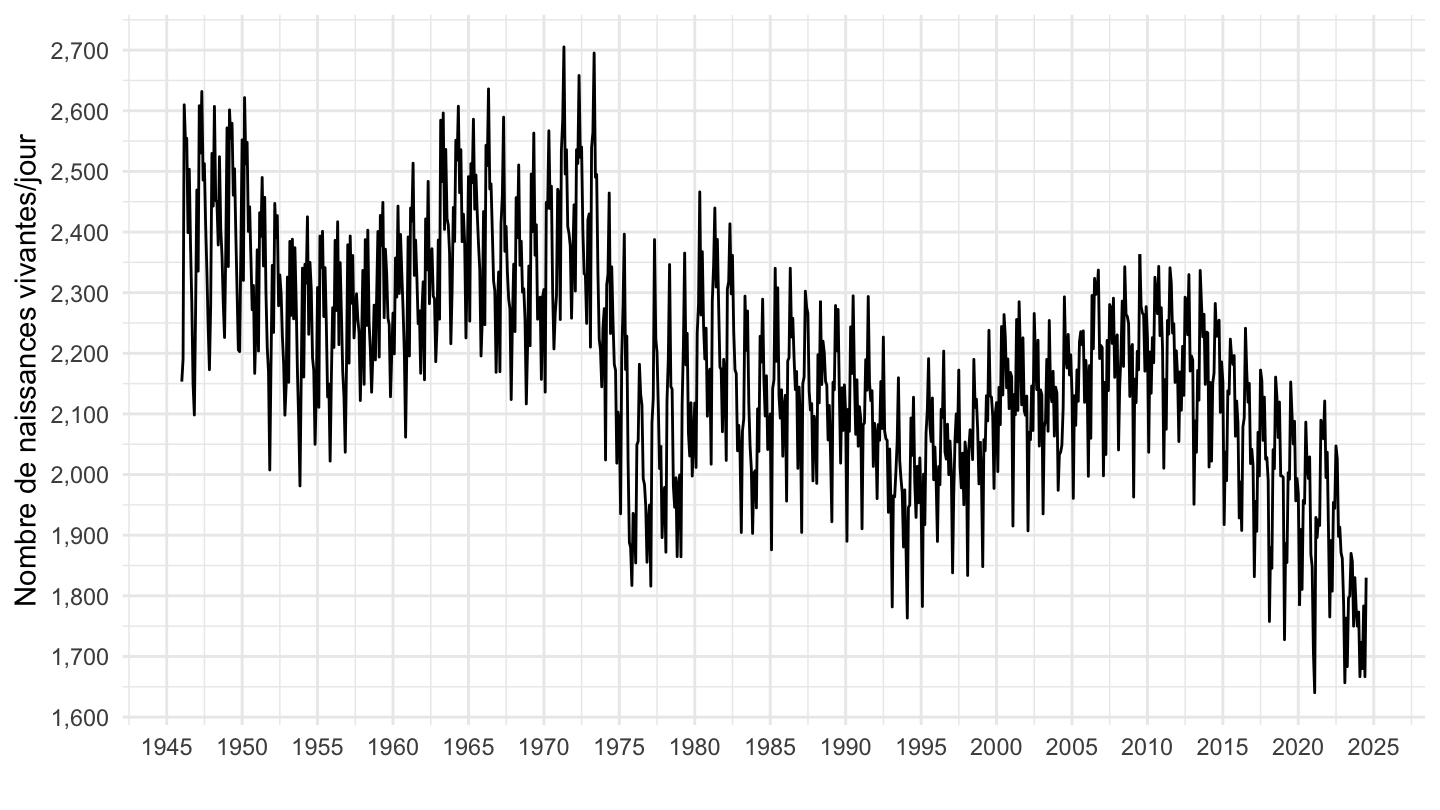
`NAISSANCES-FECONDITE` |>
  filter(IDBANK == "000436391") %>%
  mutate(TIME_PERIOD = TIME_PERIOD |> paste0("-01") |> as.Date(),
         OBS_VALUE = OBS_VALUE |> as.numeric()) |>
  filter(TIME_PERIOD >= as.Date("1990-01-01")) |>
  ggplot() + geom_line(aes(x = TIME_PERIOD, y = OBS_VALUE/30)) +
  scale_x_date(breaks = seq(1880, 2100, 5) |> paste0("-01-01") |> as.Date(),
               labels = date_format("%Y")) +
  scale_y_continuous(breaks = 100*seq(1, 1000, 1),
                     labels = dollar_format(pre = "")) +
  theme_minimal() + xlab("") + ylab("Nombre de naissances vivantes/jour")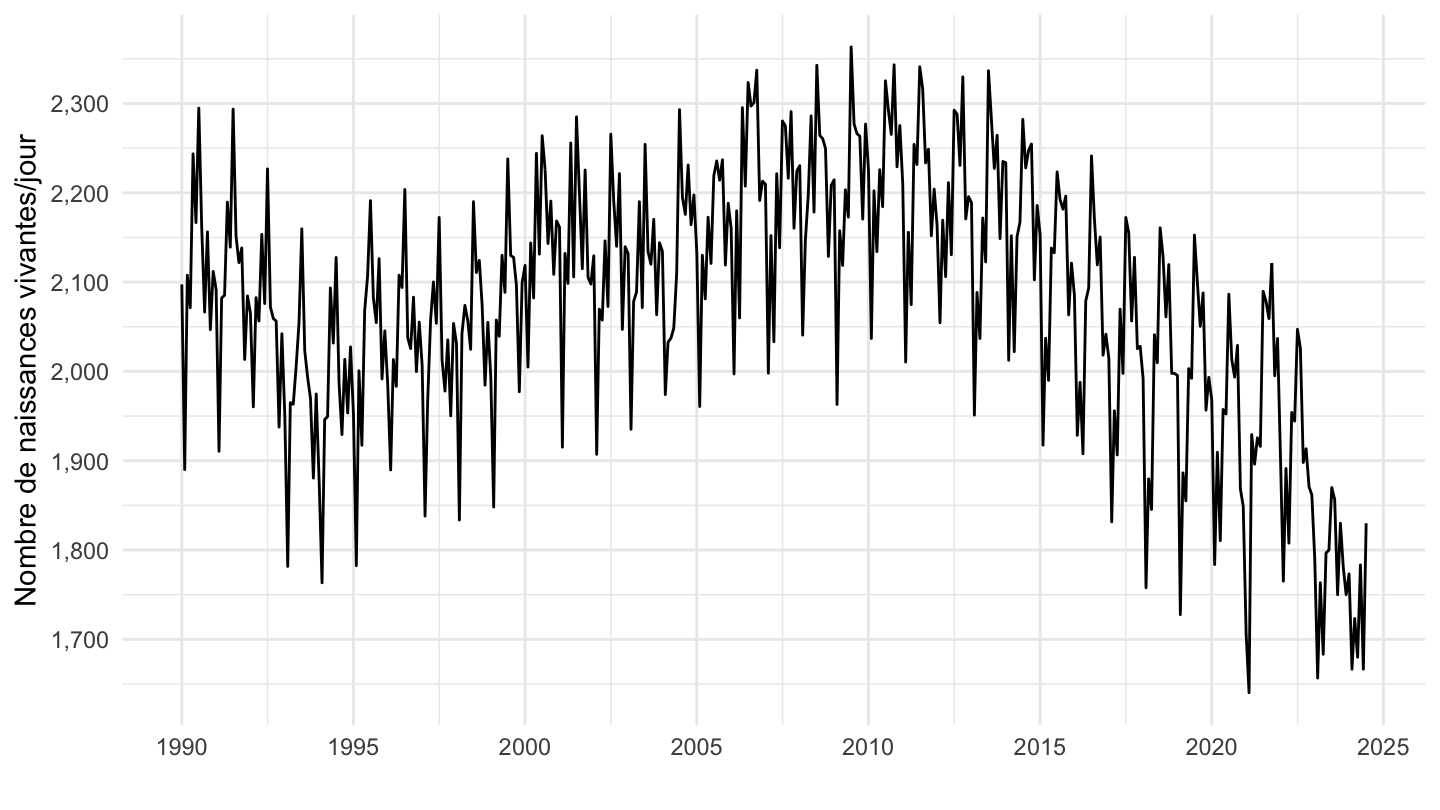
`NAISSANCES-FECONDITE` |>
  filter(IDBANK == "000436391") %>%
  mutate(TIME_PERIOD = TIME_PERIOD |> paste0("-01") |> as.Date(),
         OBS_VALUE = OBS_VALUE |> as.numeric()) |>
  filter(TIME_PERIOD >= as.Date("2000-01-01")) |>
  ggplot() + geom_line(aes(x = TIME_PERIOD, y = OBS_VALUE/30)) +
  scale_x_date(breaks = seq(1880, 2100, 2) |> paste0("-01-01") |> as.Date(),
               labels = date_format("%Y")) +
  scale_y_continuous(breaks = 100*seq(1, 1000, 1),
                     labels = dollar_format(pre = "")) +
  theme_minimal() + xlab("") + ylab("Nombre de naissances vivantes/jour")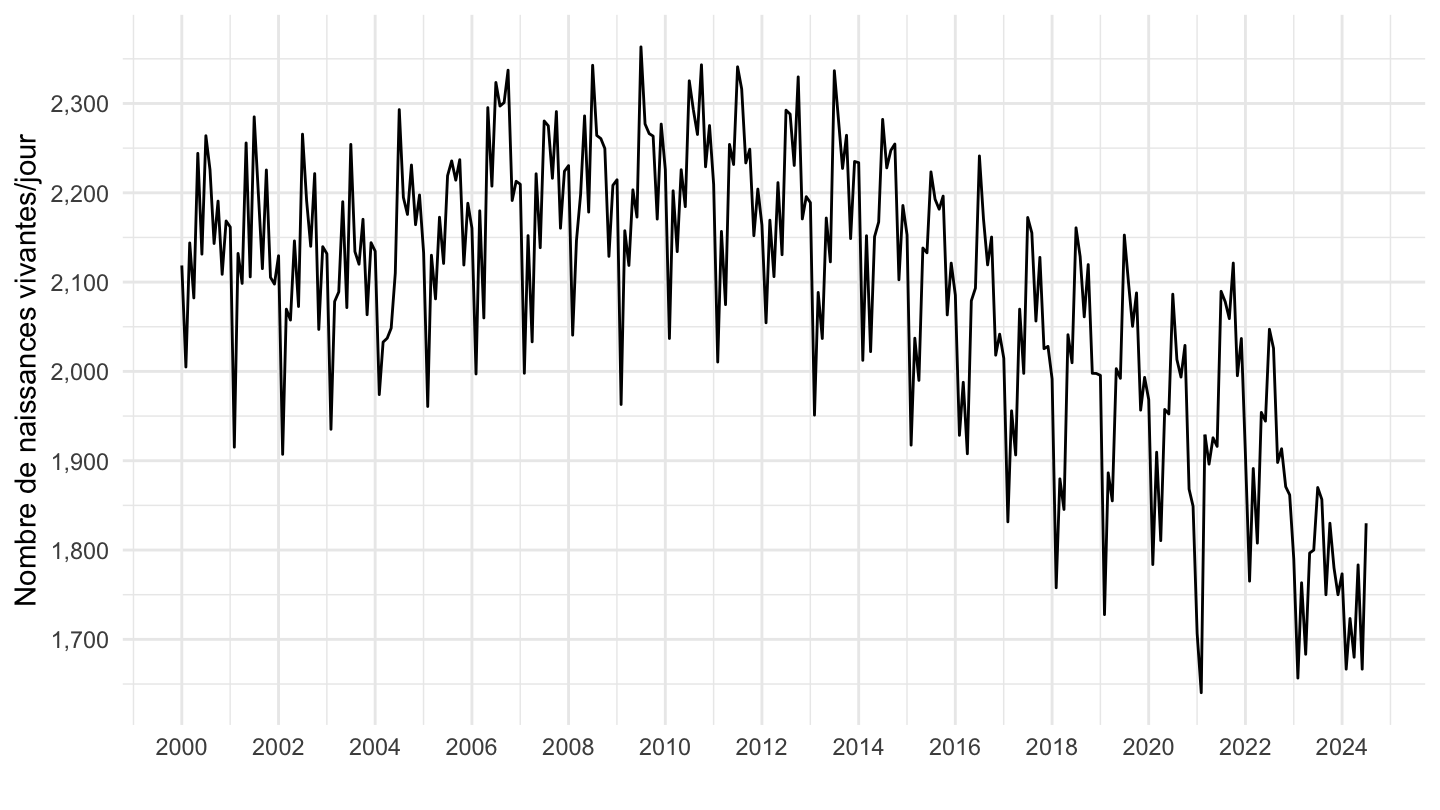
`NAISSANCES-FECONDITE` |>
  filter(IDBANK == "000436391") %>%
  mutate(TIME_PERIOD = TIME_PERIOD |> paste0("-01") |> as.Date(),
         OBS_VALUE = OBS_VALUE |> as.numeric()) |>
  filter(TIME_PERIOD >= as.Date("2012-01-01")) |>
  ggplot() + geom_line(aes(x = TIME_PERIOD, y = OBS_VALUE/30)) +
  scale_x_date(breaks = seq(1880, 2100, 1) |> paste0("-01-01") |> as.Date(),
               labels = date_format("%Y")) +
  scale_y_continuous(breaks = 100*seq(1, 1000, 1),
                     labels = dollar_format(pre = "")) +
  theme_minimal() + xlab("") + ylab("Nombre de naissances vivantes/jour")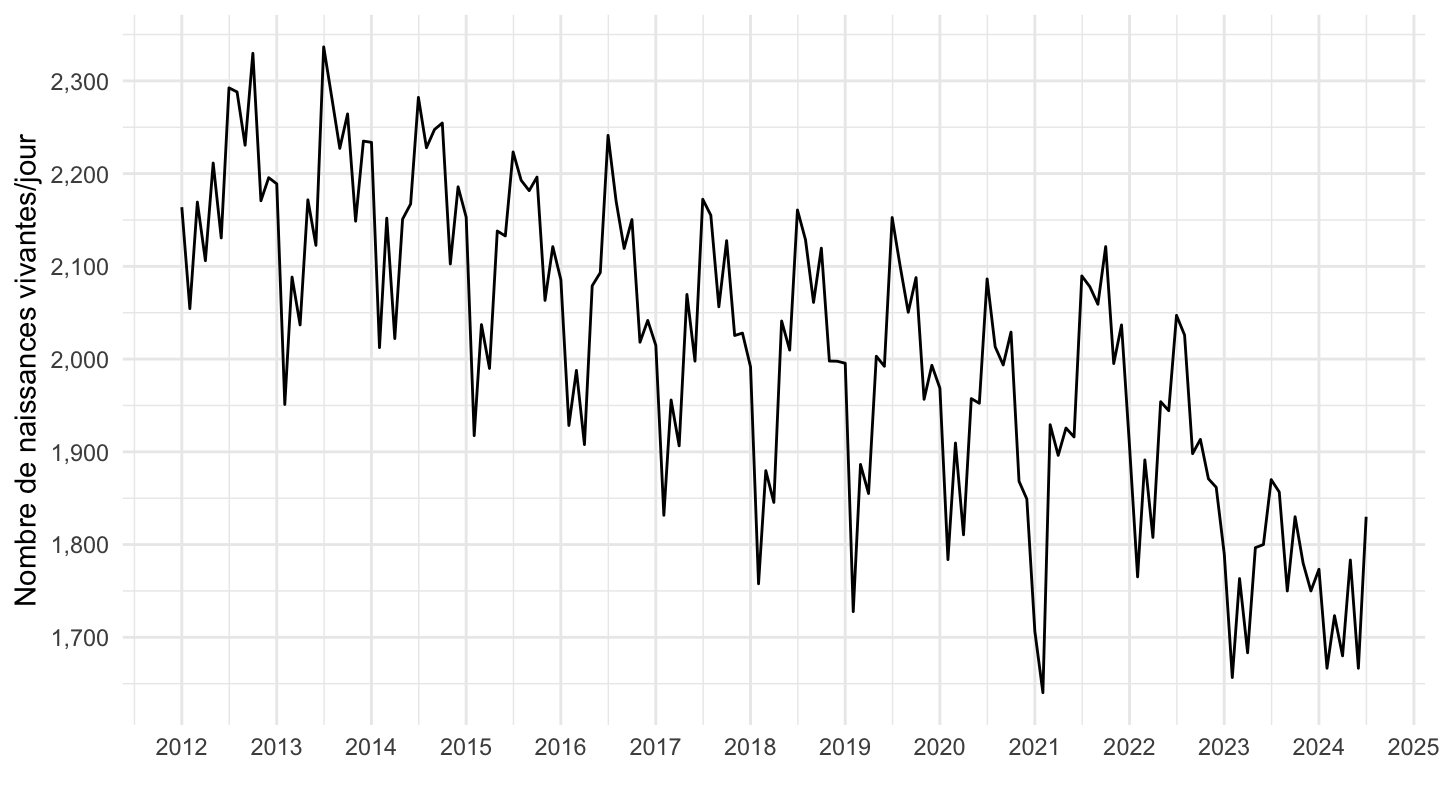
`NAISSANCES-FECONDITE` |>
  filter(IDBANK == "000436391") %>%
  mutate(TIME_PERIOD = TIME_PERIOD |> paste0("-01") |> as.Date(),
         OBS_VALUE = OBS_VALUE |> as.numeric()) |>
  filter(TIME_PERIOD >= as.Date("2018-01-01")) |>
  ggplot() + geom_line(aes(x = TIME_PERIOD, y = OBS_VALUE/30)) +
  scale_x_date(breaks = seq(1880, 2100, 1) |> paste0("-01-01") |> as.Date(),
               labels = date_format("%Y")) +
  scale_y_continuous(breaks = 100*seq(1, 1000, 1),
                     labels = dollar_format(pre = "")) +
  theme_minimal() + xlab("") + ylab("Nombre de naissances vivantes/jour")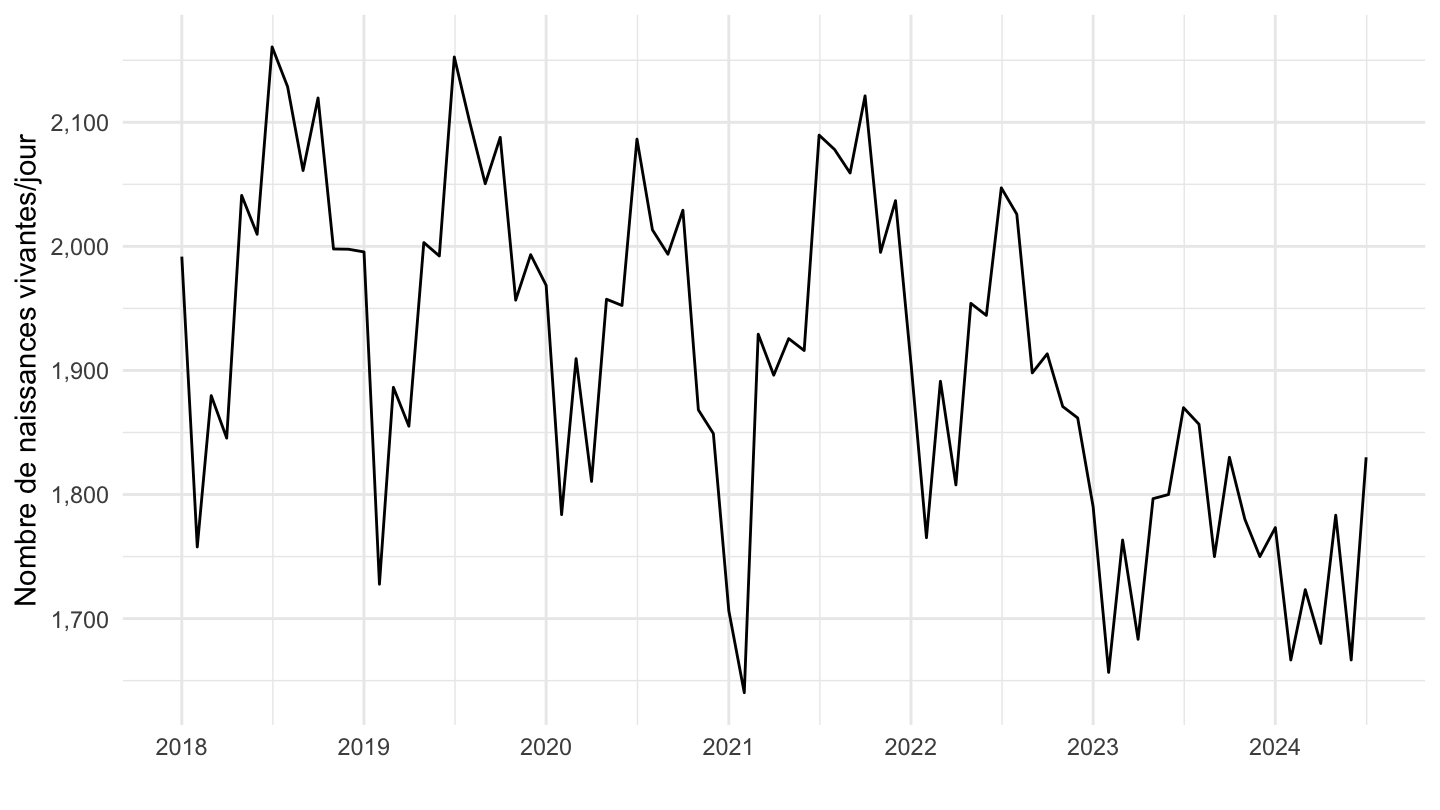
`NAISSANCES-FECONDITE` |>
  filter(IDBANK == "000436391") |>
  month_to_date() |>
  ggplot() + geom_line(aes(x = date, y = OBS_VALUE)) +
  scale_x_date(breaks = seq(1880, 2100, 5) |> paste0("-01-01") |> as.Date(),
               labels = date_format("%Y")) +
  scale_y_continuous(breaks = 100*seq(1, 1000, 50),
                     labels = dollar_format(pre = "")) +
  theme_minimal() + xlab("") + ylab("Nombre de naissances vivantes/jour")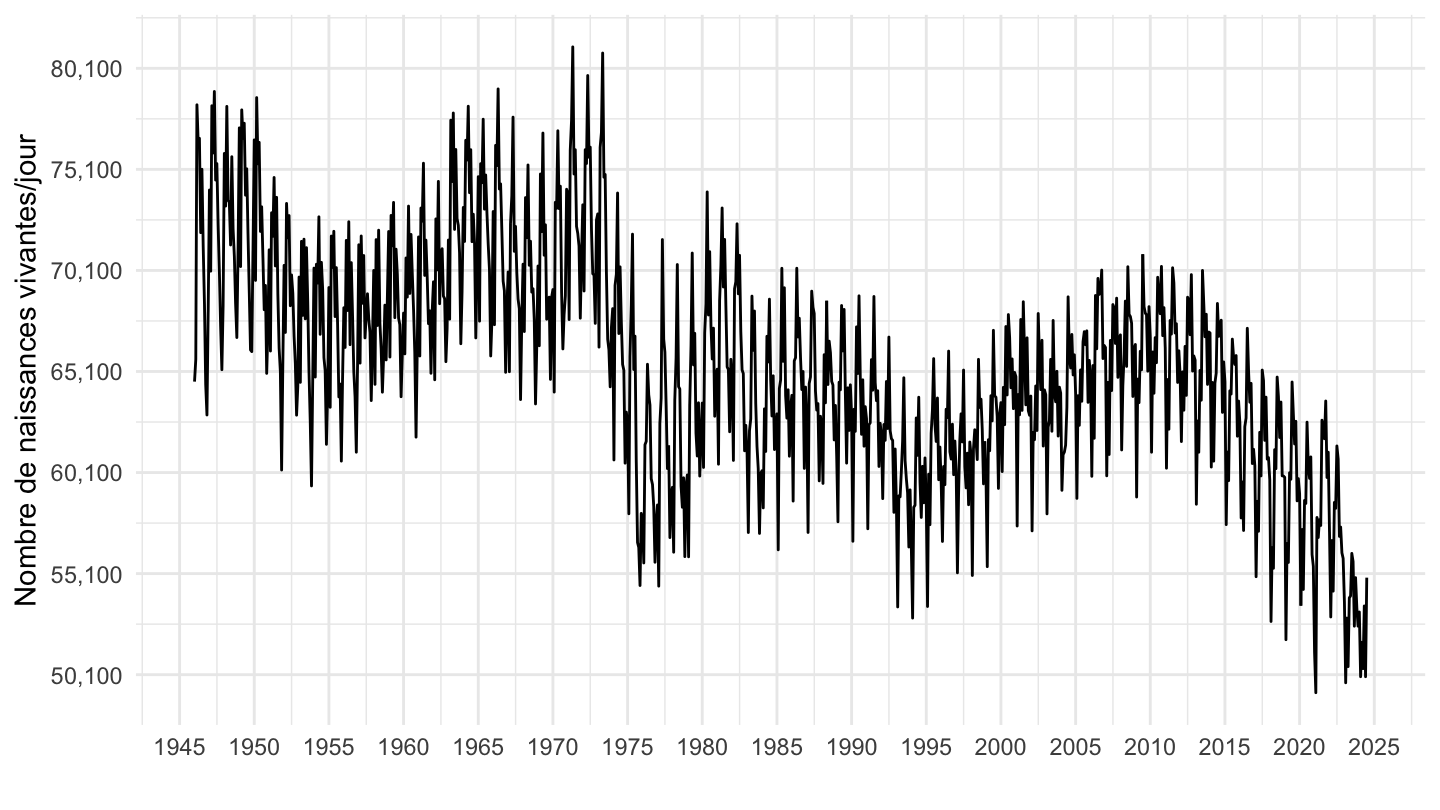
`NAISSANCES-FECONDITE` |>
  filter(DEMOGRAPHIE == "ICF") |>
  year_to_date() |>
  ggplot() + geom_line(aes(x = date, y = OBS_VALUE, color = Ref_area)) +
  scale_x_date(breaks = seq(1880, 2100, 20) |> paste0("-01-01") |> as.Date(),
               labels = date_format("%Y")) +
  scale_y_continuous(breaks = seq(100, 300, 10)) +
  theme_minimal() + xlab("") + ylab("Indicateur conjoncturel de fécondité (pour 100 femmes)") +
  theme(legend.position = c(0.85, 0.85),
        legend.title = element_blank())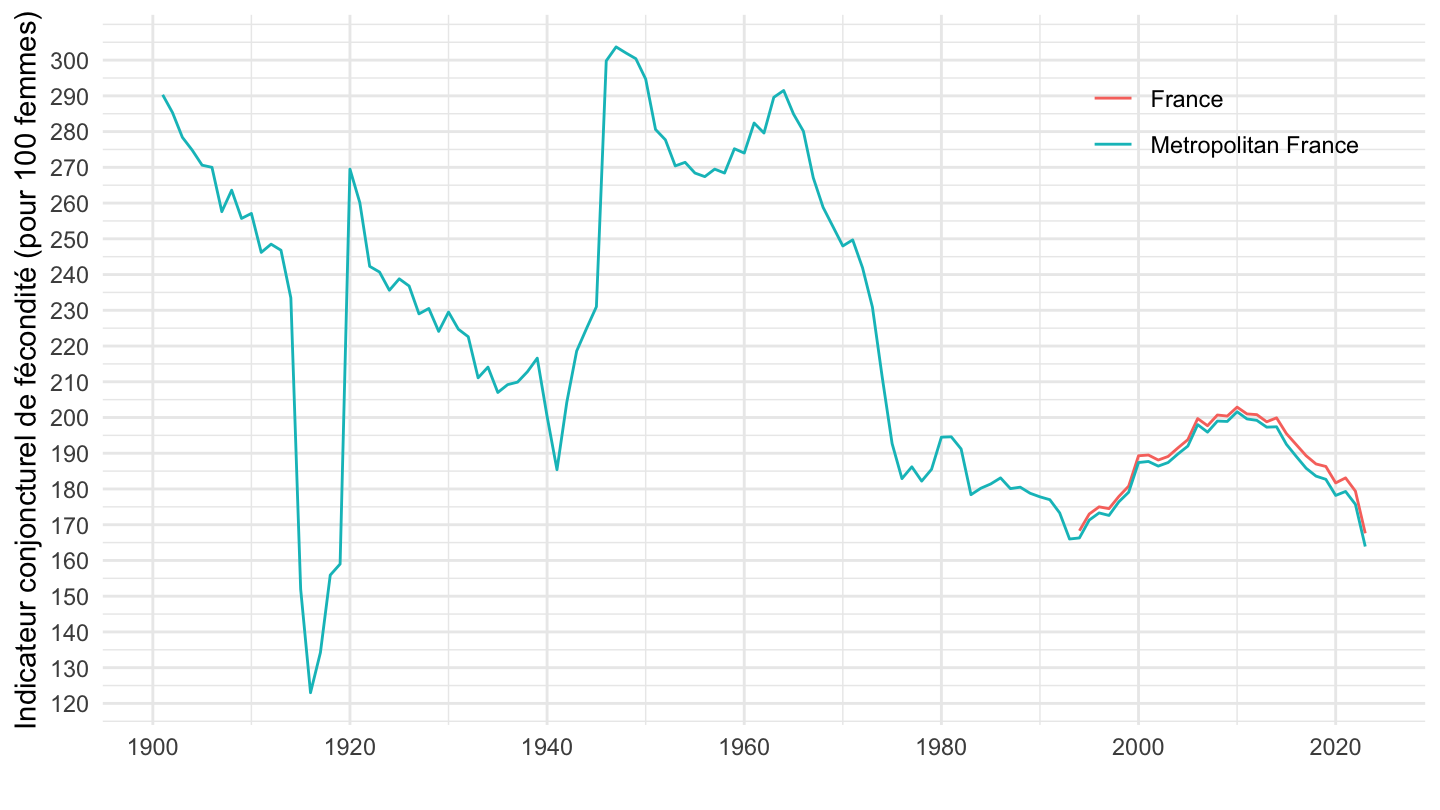
`NAISSANCES-FECONDITE` |>
  filter(REF_AREA %in% c("D92", "D93", "D75"),
         INDICATEUR == "INDICATEUR_FECONDITE",
         AGE == "00-") |>
  year_to_date() |>
  ggplot() + geom_line(aes(x = date, y = OBS_VALUE, color = Ref_area)) +
  scale_x_date(breaks = seq(1880, 2100, 5) |> paste0("-01-01") |> as.Date(),
               labels = date_format("%Y")) +
  scale_y_continuous(breaks = seq(100, 300, 10)) +
  theme_minimal() + xlab("") + ylab("Indicateur conjoncturel de fécondité (pour 100 femmes)") +
  theme(legend.position = c(0.25, 0.85),
        legend.title = element_blank())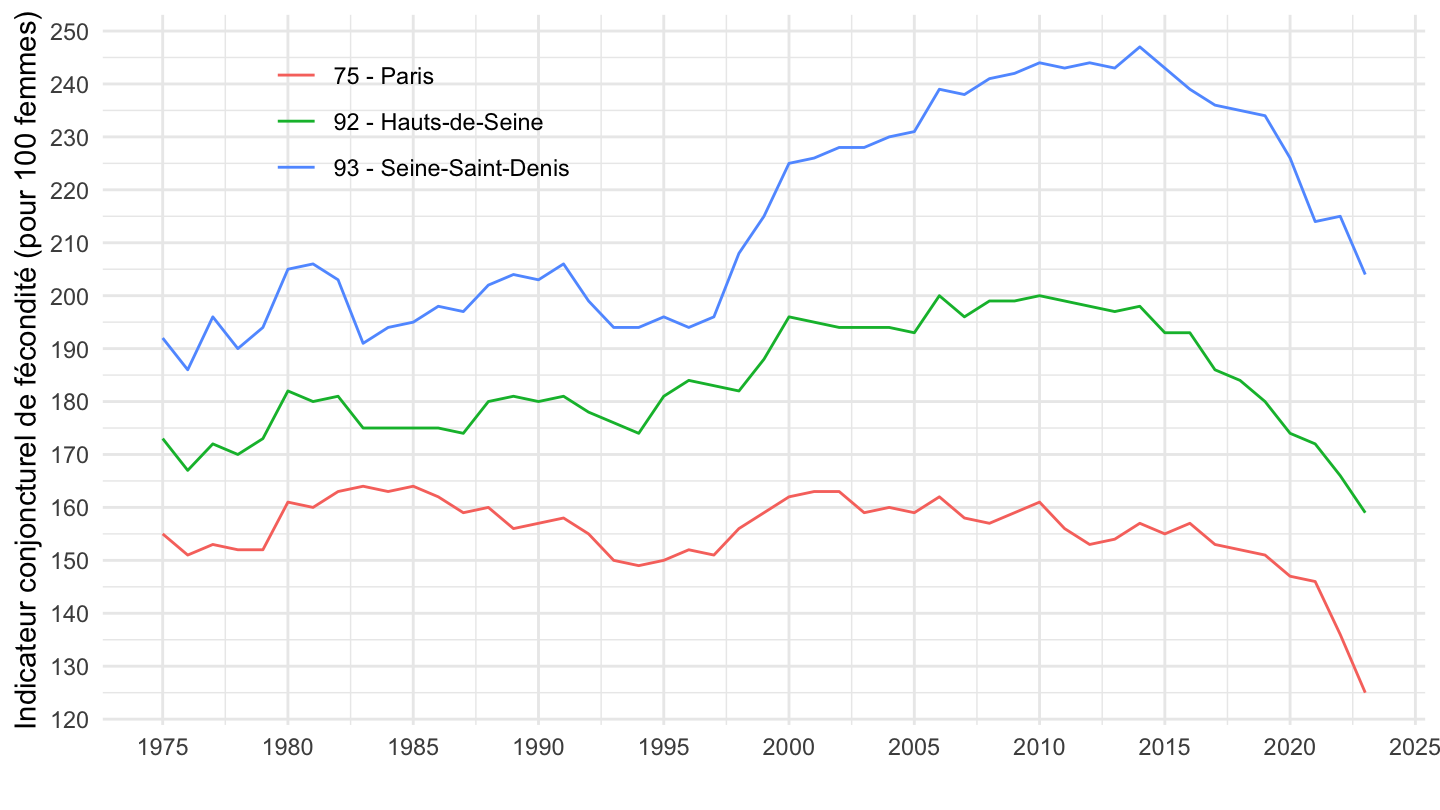
`NAISSANCES-FECONDITE` |>
  filter(DEMOGRAPHIE == "TXNAT") |>
  year_to_date() |>
  ggplot() + geom_line(aes(x = date, y = OBS_VALUE, color = Ref_area)) +
  scale_x_date(breaks = seq(1880, 2100, 20) |> paste0("-01-01") |> as.Date(),
               labels = date_format("%Y")) +
  scale_y_continuous(breaks = seq(0, 300, 1)) +
  theme_minimal() + xlab("") + ylab("Taux de natalité") +
  theme(legend.position = c(0.85, 0.85),
        legend.title = element_blank())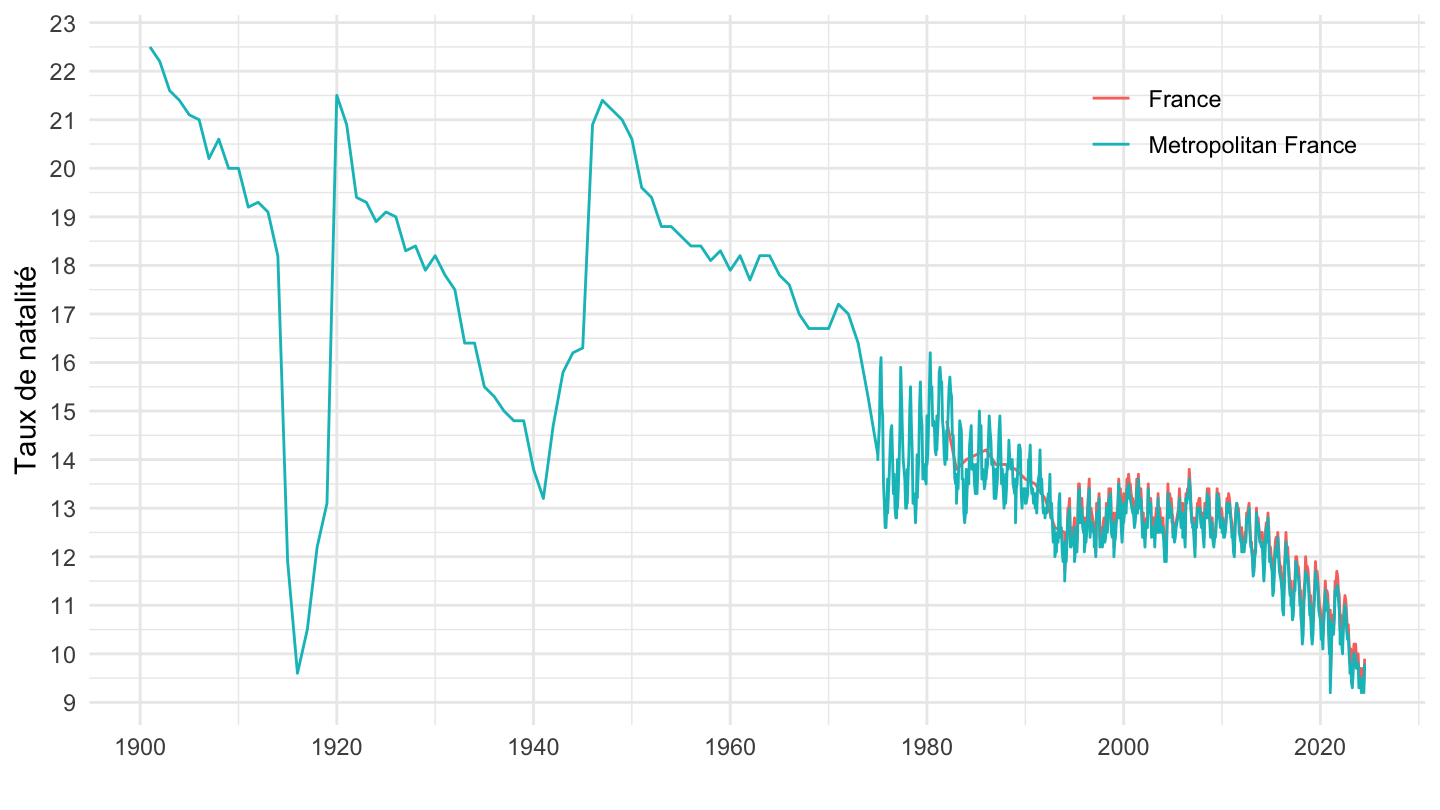
| source | dataset | Title | Updated |
|---|---|---|---|


