| source | dataset | Title | .html | .rData |
|---|---|---|---|---|
| insee | DECES-MORTALITE | Décès et mortalité | 2026-07-23 | 2026-07-22 |
Décès et mortalité
Données - INSEE
Info
Données sur la demographie
| source | dataset | Title | .html | .rData |
|---|---|---|---|---|
| eurostat | demo_minfind | Infant mortality rates | 2026-07-23 | 2026-07-23 |
| ined | fm_t70_2019.fr | Evolution de la mortalité infantile et de ses nombreuses composantes, 2019 | 2024-06-20 | 2022-01-31 |
| ined | fm_t70_2021.fr | Evolution de la mortalité infantile et de ses nombreuses composantes, 2021 | 2024-06-20 | 2023-10-10 |
| ined | p2d_2019.fr | Mortalité infantile par département et région - p2d_2019.fr | 2024-06-20 | 2021-12-18 |
| insee | DECES-MORTALITE | Décès et mortalité | 2026-07-23 | 2026-07-22 |
| insee | NAISSANCES-FECONDITE | Naissances et fécondité | 2026-07-23 | 2026-07-23 |
| oecd | FAMILY | Family Database - FAMILY | 2024-09-15 | 2025-05-29 |
Définitions
- Espérance de vie à la naissance. L’espérance de vie à la naissance est égale à la durée de vie moyenne d’une génération fictive qui connaîtrait tout au long de son existence les conditions de mortalité par âge de l’année considérée. C’est un indicateur synthétique des taux de mortalité par âge de l’année considérée.
Last
Code
`DECES-MORTALITE` %>%
  group_by(TIME_PERIOD) %>%
  summarise(Nobs = n()) %>%
  arrange(desc(TIME_PERIOD)) %>%
  head(1) %>%
print_table_conditional()| TIME_PERIOD | Nobs |
|---|---|
| 2026-05 | 2 |
TITLE_FR
Code
`DECES-MORTALITE` %>%
  group_by(IDBANK, TITLE_FR) %>%
  summarise(Nobs = n()) %>%
  arrange(-Nobs) %>%
  print_table_conditional()
INDICATEUR
Code
`DECES-MORTALITE` %>%
  left_join(INDICATEUR,  by = "INDICATEUR") %>%
  group_by(INDICATEUR, Indicateur) %>%
  summarise(Nobs = n()) %>%
  arrange(-Nobs) %>%
print_table_conditional()| INDICATEUR | Indicateur | Nobs |
|---|---|---|
| ESPERANCE_VIE | Espérance de vie | 44688 |
| TAUX_MORTALITE | Taux de mortalité | 21023 |
| TAUX_MORTALITE_STANDARDISE | Taux de mortalité standardisé | 6520 |
| DECES_DOMICILIES | Décès domiciliés | 5862 |
| NOMBRE_DECES | Nombre de décès | 2929 |
DEMOGRAPHIE
Code
`DECES-MORTALITE` %>%
  left_join(DEMOGRAPHIE,  by = "DEMOGRAPHIE") %>%
  group_by(DEMOGRAPHIE, Demographie) %>%
  summarise(Nobs = n()) %>%
  arrange(-Nobs) %>%
print_table_conditional()| DEMOGRAPHIE | Demographie | Nobs |
|---|---|---|
| SO | Sans objet | 26678 |
| ESPV | Espérance de vie à la naissance | 11116 |
| ESPV-20 | Espérance de vie à 20 ans | 11116 |
| ESPV-40 | Espérance de vie à 40 ans | 11116 |
| ESPV-60 | Espérance de vie à 60 ans | 11116 |
| DECES-DOM | Décès de tous âges, domiciliés | 5862 |
| DECES | Décès de tous âges | 1548 |
| DECES-1A | Décès de moins d'un an | 1381 |
| TXMORINF | Taux de mortalité infantile | 865 |
| ESPV-01 | Espérance de vie à 1 an | 224 |
AGE
Code
`DECES-MORTALITE` %>%
  left_join(AGE,  by = "AGE") %>%
  group_by(AGE, Age) %>%
  summarise(Nobs = n()) %>%
print_table_conditional()| AGE | Age | Nobs |
|---|---|---|
| 00- | Ensemble | 192 |
| 00-01 | Moins d'un an | 2131 |
| 00-64 | De 0 à 64 ans | 3260 |
| 01-04 | De 1 à 4 ans | 288 |
| 05-09 | De 5 à 9 ans | 288 |
| 10-14 | De 10 à 14 ans | 288 |
| 15-19 | De 15 à 19 ans | 288 |
| 20-24 | De 20 à 24 ans | 288 |
| 25-29 | De 25 à 29 ans | 288 |
| 30-34 | De 30 à 34 ans | 288 |
| 35-39 | De 35 à 39 ans | 288 |
| 40-44 | De 40 à 44 ans | 288 |
| 45-49 | De 45 à 49 ans | 288 |
| 50-54 | De 50 à 54 ans | 288 |
| 55-59 | De 55 à 59 ans | 288 |
| 60-64 | De 60 à 64 ans | 288 |
| 65- | 65 ans et plus | 3260 |
| 65-69 | De 65 à 69 ans | 288 |
| 70-79 | De 70 à 79 ans | 288 |
| 80-89 | De 80 à 89 ans | 288 |
| 90- | 90 ans et plus | 288 |
| SO | Sans objet | 67283 |
Espérance de vie à la naissance
ESPV
Tous
Code
`DECES-MORTALITE` %>%
  filter(INDICATEUR == "ESPERANCE_VIE",
         REF_AREA == "FM",
         DEMOGRAPHIE != "ESPV-01") %>%
  select_if(~ n_distinct(.) > 1) %>%
  year_to_date %>%
  arrange(date) %>%
  #filter(date >= as.Date("1981-01-01")) %>%
  arrange(date) %>%
  left_join(DEMOGRAPHIE, by = "DEMOGRAPHIE") %>%
  left_join(SEXE, by = "SEXE") %>%
  unique %>%
  mutate(Demographie = gsub("Espérance de vie", "... ", Demographie)) %>%
  mutate(Demographie = ifelse(DEMOGRAPHIE == "ESPV", "... à 0 ans", Demographie)) %>%
  arrange(Demographie) %>%
  ggplot() + geom_line(aes(x = date, y = OBS_VALUE, color = Demographie)) +
  scale_x_date(breaks = seq(1940, 2100, 10) %>% paste0("-01-01") %>% as.Date,
               labels = date_format("%Y")) +
  scale_y_continuous(breaks = seq(0, 100, 10),
                     labels = dollar_format(pre = "", su = " ans")) +
  theme_minimal() + xlab("") + ylab("") +
  geom_label(data = . %>% filter(date %in% c(max(date), min(date))),
             aes(x = date, y = OBS_VALUE, color = Demographie, label = paste0(OBS_VALUE))) +
  theme(legend.position = "top",
        axis.text.x = element_text(angle = 45, vjust = 1, hjust = 1)) + labs(x = "", y = "", color = "Espérance de vie: ") +
  facet_wrap(~ Sexe)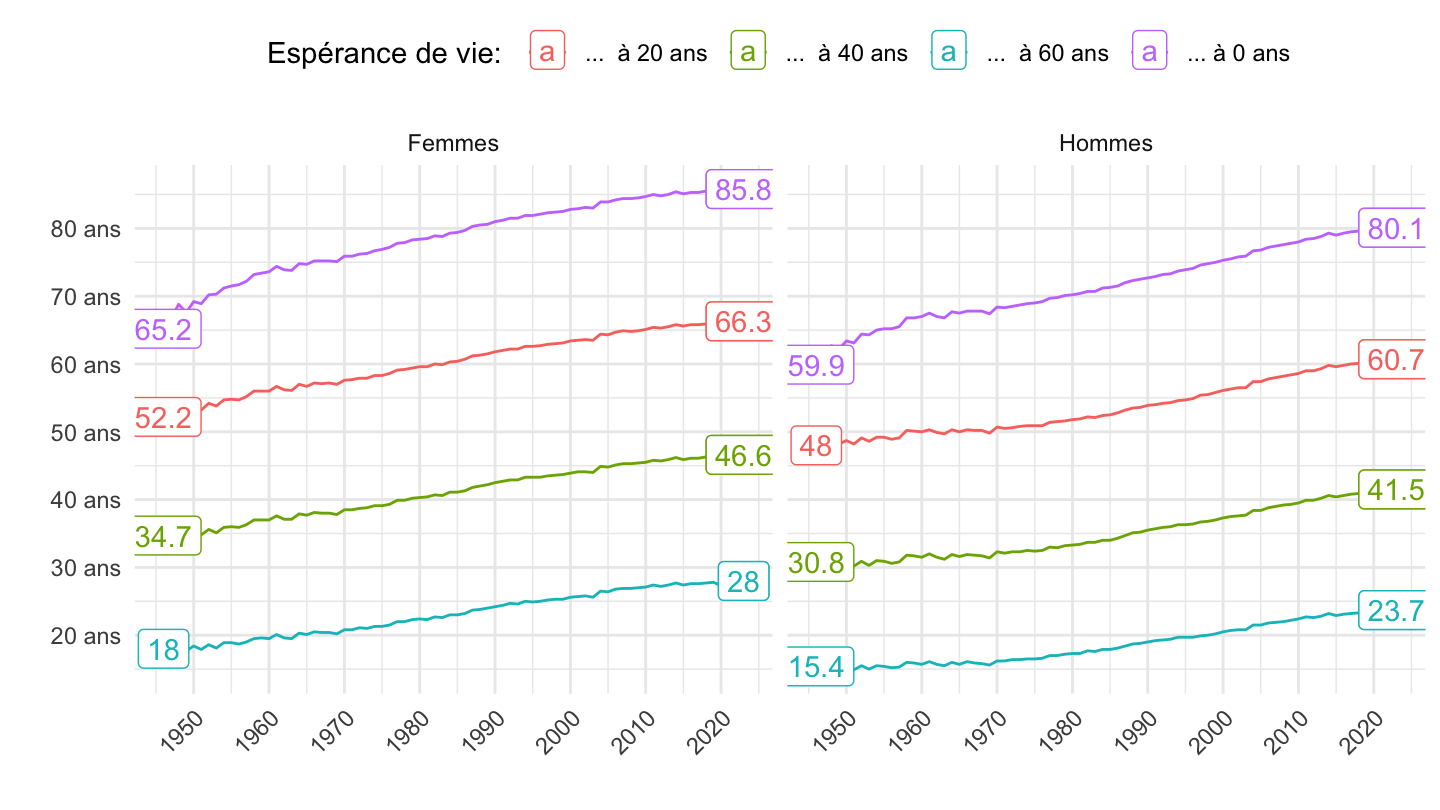
1981-
Code
`DECES-MORTALITE` %>%
  filter(INDICATEUR == "ESPERANCE_VIE",
         REF_AREA == "FM",
         DEMOGRAPHIE != "ESPV-01") %>%
  select_if(~ n_distinct(.) > 1) %>%
  year_to_date %>%
  arrange(date) %>%
  filter(date >= as.Date("1981-01-01")) %>%
  arrange(date) %>%
  left_join(DEMOGRAPHIE, by = "DEMOGRAPHIE") %>%
  left_join(SEXE, by = "SEXE") %>%
  unique %>%
  mutate(Demographie = gsub("Espérance de vie", "... ", Demographie)) %>%
  mutate(Demographie = ifelse(DEMOGRAPHIE == "ESPV", "... à 0 ans", Demographie)) %>%
  arrange(Demographie) %>%
  ggplot() + geom_line(aes(x = date, y = OBS_VALUE, color = Demographie)) +
  scale_x_date(breaks = seq(1981, 2023, 3) %>% paste0("-01-01") %>% as.Date,
               labels = date_format("%Y"),
               limits = c(1980, 2024) %>% paste0("-01-01") %>% as.Date) +
  scale_y_continuous(breaks = seq(0, 100, 10),
                     labels = dollar_format(pre = "", su = " ans")) +
  theme_minimal() + xlab("") + ylab("") +
  geom_label(data = . %>% filter(date %in% c(max(date), min(date))),
             aes(x = date, y = OBS_VALUE, color = Demographie, label = paste0(OBS_VALUE))) +
  theme(legend.position = "top",
        axis.text.x = element_text(angle = 45, vjust = 1, hjust = 1)) + labs(x = "", y = "", color = "Espérance de vie: ") +
  facet_wrap(~ Sexe)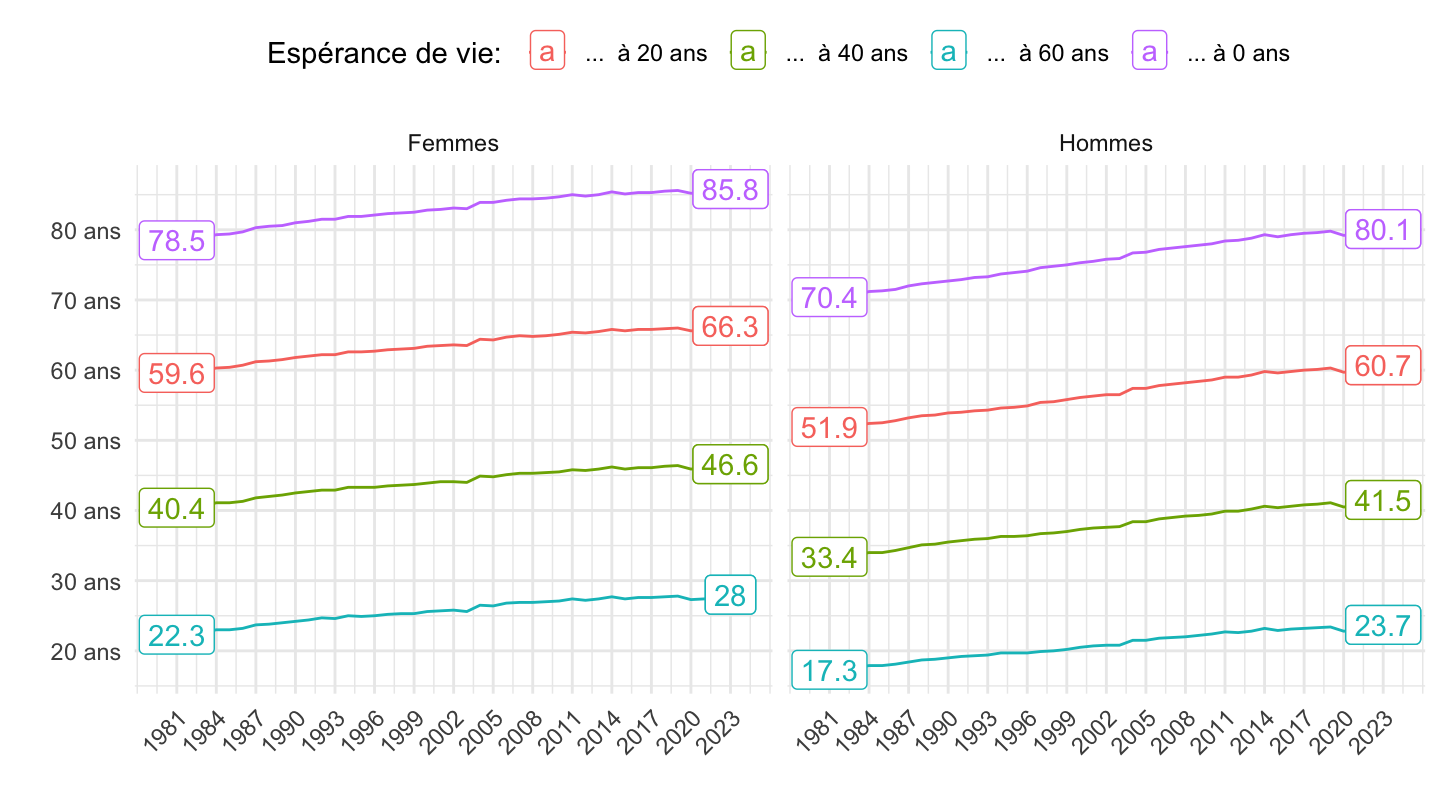
Démographie - Nombre de naissances vivantes
Par an (glissement)
Tous
Code
`DECES-MORTALITE` %>%
  filter(IDBANK == "000436394") %>%
  month_to_date %>%
  arrange(date) %>%
  mutate(OBS_VALUE = rollsum(x = OBS_VALUE, 12, align = "right", fill = NA)) %>%
  ggplot() + geom_line(aes(x = date, y = OBS_VALUE)) +
  scale_x_date(breaks = seq(1880, 2100, 5) %>% paste0("-01-01") %>% as.Date,
               labels = date_format("%Y")) +
  scale_y_continuous(breaks = seq(0, 1000000, 20000),
                     labels = dollar_format(pre = "")) +
  theme_minimal() + xlab("") + ylab("Nombre sur les 12 derniers mois")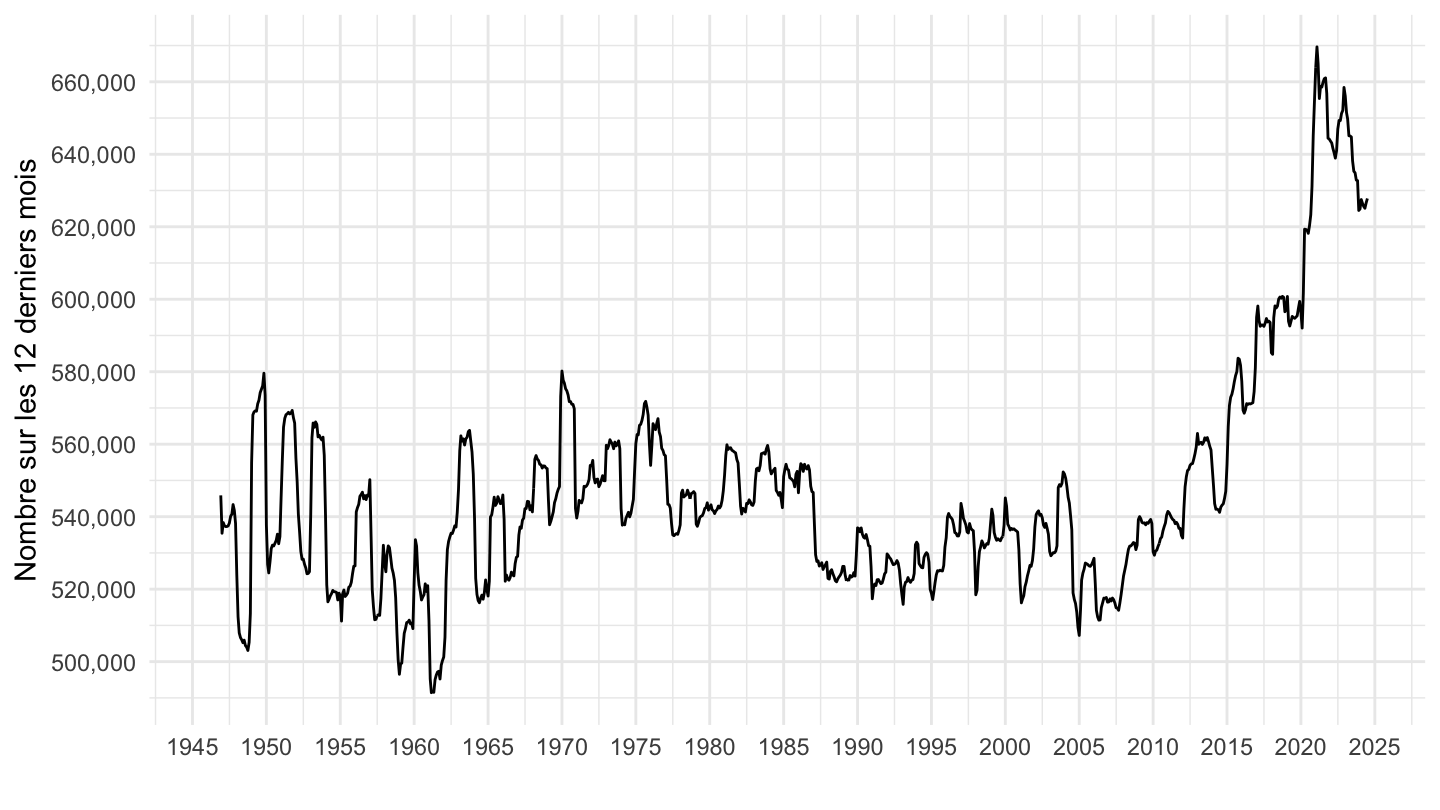
Deces vs. naissances
France Métropolitaine
24 mois
Tous
Code
`DECES-MORTALITE` %>%
  bind_rows(`NAISSANCES-FECONDITE`) %>%
  filter(IDBANK %in% c("000436394", "000436391")) %>%
  month_to_date %>%
  group_by(TITLE_FR) %>%
  arrange(date) %>%
  mutate(OBS_VALUE = rollsum(x = OBS_VALUE, 24, align = "right", fill = NA),
         DEMOGRAPHIE2 = ifelse(DEMOGRAPHIE == "DECES", "Décès", "Naissances")) %>%
  ggplot() + geom_line(aes(x = date, y = OBS_VALUE, color = TITLE_FR)) +
  scale_x_date(breaks = seq(1880, 2100, 5) %>% paste0("-01-01") %>% as.Date,
               labels = date_format("%Y")) +
  scale_y_continuous(breaks = seq(0, 3000000, 50000),
                     labels = dollar_format(pre = "")) +
  theme_minimal() + xlab("") + ylab("Nombre sur les 24 derniers mois") +
  theme(legend.position = "none") +
  geom_label(data = . %>% filter(date == as.Date("2005-01-01")), aes(x = date, y = OBS_VALUE, label = DEMOGRAPHIE2, color = TITLE_FR)) +
  ggtitle("Naissances et décès sur les 24 derniers mois - France Métropolitaine")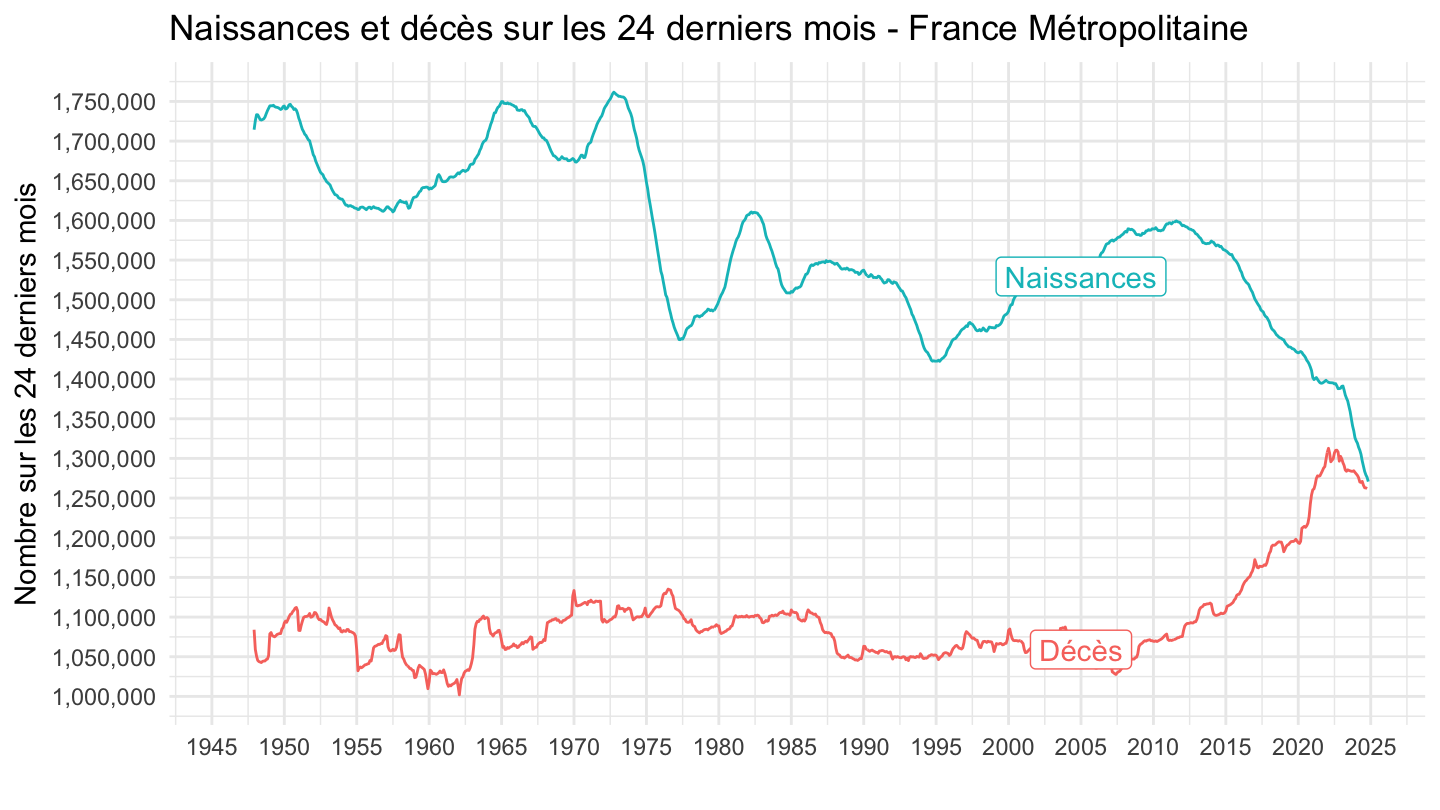
12 mois
Tous
Code
`DECES-MORTALITE` %>%
  bind_rows(`NAISSANCES-FECONDITE`) %>%
  filter(IDBANK %in% c("000436394", "000436391")) %>%
  month_to_date %>%
  group_by(TITLE_FR) %>%
  arrange(date) %>%
  mutate(OBS_VALUE = rollsum(x = OBS_VALUE, 12, align = "right", fill = NA),
         DEMOGRAPHIE2 = ifelse(DEMOGRAPHIE == "DECES", "Décès", "Naissances")) %>%
  arrange(desc(date)) %>%
  ggplot() + geom_line(aes(x = date, y = OBS_VALUE, color = TITLE_FR)) +
  scale_x_date(breaks = seq(1880, 2100, 5) %>% paste0("-01-01") %>% as.Date,
               labels = date_format("%Y")) +
  scale_y_continuous(breaks = seq(0, 1000000, 20000),
                     labels = dollar_format(pre = "")) +
  theme_minimal() + xlab("") + ylab("Nombre sur les 12 derniers mois") +
  theme(legend.position = "none") +
  geom_label(data = . %>% filter(date == as.Date("2005-01-01")), aes(x = date, y = OBS_VALUE, label = DEMOGRAPHIE2, color = TITLE_FR)) +
  ggtitle("Naissances et décès sur les 12 derniers mois - France Métropolitaine")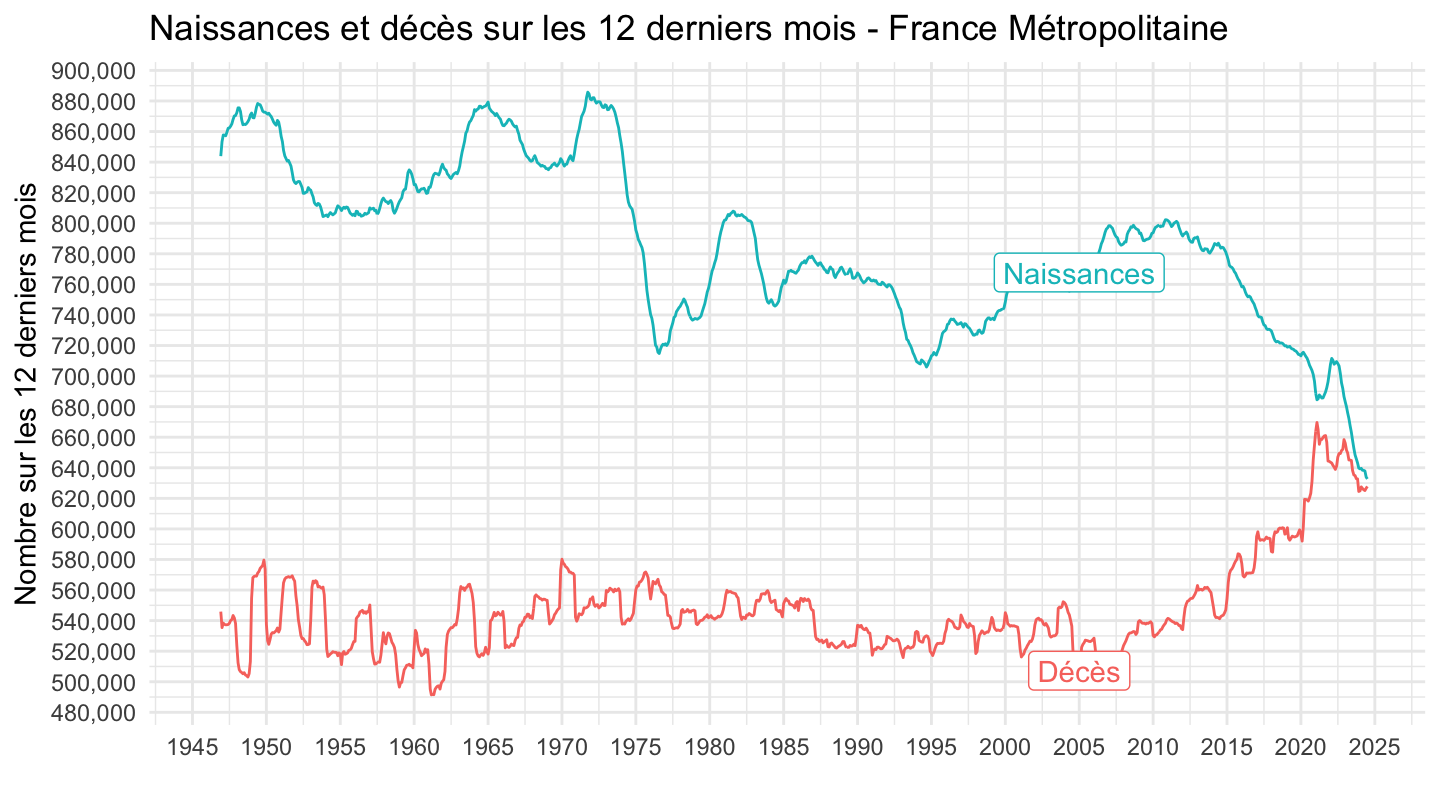
Tous, Dernier chiffre
Code
`DECES-MORTALITE` %>%
  bind_rows(`NAISSANCES-FECONDITE`) %>%
  filter(IDBANK %in% c("000436394", "000436391")) %>%
  month_to_date %>%
  group_by(TITLE_FR) %>%
  arrange(date) %>%
  mutate(OBS_VALUE = rollsum(x = OBS_VALUE, 12, align = "right", fill = NA),
         DEMOGRAPHIE2 = ifelse(DEMOGRAPHIE == "DECES", "Décès", "Naissances")) %>%
  arrange(desc(date)) %>%
  ggplot() + geom_line(aes(x = date, y = OBS_VALUE, color = TITLE_FR), size = 1) +
  scale_x_date(breaks = seq(1880, 2100, 5) %>% paste0("-01-01") %>% as.Date,
               labels = date_format("%Y")) +
  scale_y_continuous(breaks = seq(0, 1000000, 20000),
                     labels = dollar_format(pre = "")) +
  theme_minimal() + xlab("") + ylab("Nombre sur les 12 derniers mois") +
  theme(legend.position = "none") +
  geom_label(data = . %>% filter(date == as.Date("1950-01-01")), aes(x = date, y = OBS_VALUE, label = DEMOGRAPHIE2, color = TITLE_FR, size = 2)) +
  ggtitle("Naissances et décès sur les 12 derniers mois - France Métropolitaine") +
  geom_label_repel(data = . %>% filter(max(date) == date),
             aes(x =  as.Date("2032-01-01"), y = OBS_VALUE, color = TITLE_FR, label = scales::comma(OBS_VALUE)))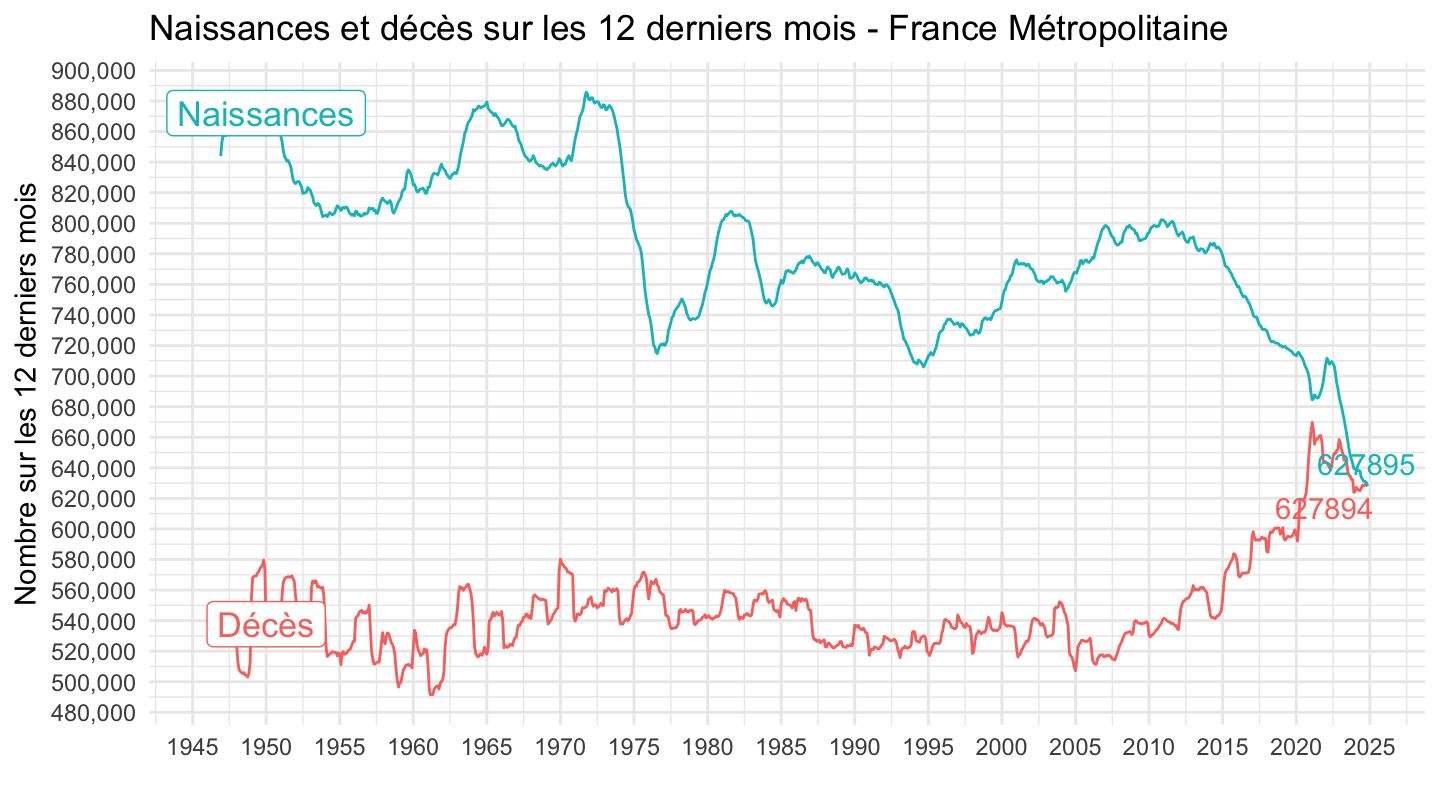
1990-
Code
`DECES-MORTALITE` %>%
  bind_rows(`NAISSANCES-FECONDITE`) %>%
  filter(IDBANK %in% c("000436394", "000436391")) %>%
  month_to_date %>%
  group_by(TITLE_FR) %>%
  arrange(date) %>%
  mutate(OBS_VALUE = rollsum(x = OBS_VALUE, 12, align = "right", fill = NA),
         DEMOGRAPHIE2 = ifelse(DEMOGRAPHIE == "DECES", "Décès", "Naissances")) %>%
  filter(date >= as.Date("1990-01-01")) %>%
  ggplot() + geom_line(aes(x = date, y = OBS_VALUE, color = TITLE_FR)) +
  scale_x_date(breaks = seq(1880, 2100, 5) %>% paste0("-01-01") %>% as.Date,
               labels = date_format("%Y")) +
  scale_y_continuous(breaks = seq(0, 1000000, 20000),
                     labels = dollar_format(pre = "")) +
  theme_minimal() + xlab("") + ylab("Nombre sur les 12 derniers mois") +
  theme(legend.position = "none") +
  geom_label(data = . %>% filter(date == as.Date("2005-01-01")), aes(x = date, y = OBS_VALUE, label = DEMOGRAPHIE2, color = TITLE_FR)) +
  ggtitle("Naissances et décès sur les 12 derniers mois - France Métropolitaine") +
  geom_label_repel(data = . %>% filter(max(date) == date),
             aes(x =  date, y = OBS_VALUE, color = TITLE_FR, label = OBS_VALUE))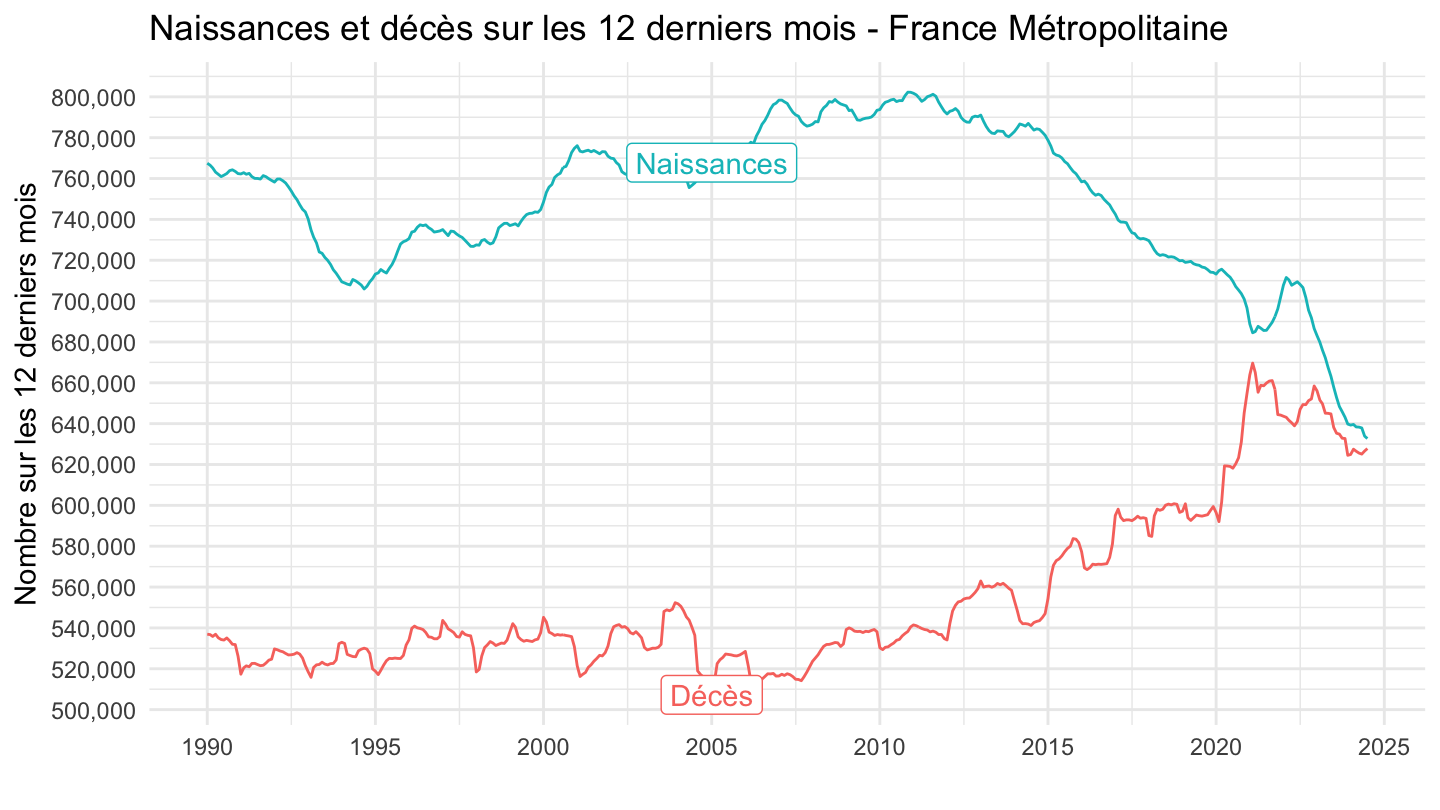
2009-
Code
`DECES-MORTALITE` %>%
  bind_rows(`NAISSANCES-FECONDITE`) %>%
  filter(IDBANK %in% c("000436394", "000436391")) %>%
  month_to_date %>%
  group_by(TITLE_FR) %>%
  arrange(date) %>%
  mutate(OBS_VALUE = rollsum(x = OBS_VALUE, 12, align = "right", fill = NA),
         DEMOGRAPHIE2 = ifelse(DEMOGRAPHIE == "DECES", "Décès", "Naissances")) %>%
  filter(date >= as.Date("2009-01-01")) %>%
  ggplot() + geom_line(aes(x = date, y = OBS_VALUE, color = TITLE_FR)) +
  scale_x_date(breaks = seq(1880, 2100, 1) %>% paste0("-01-01") %>% as.Date,
               labels = date_format("%Y")) +
  scale_y_continuous(breaks = seq(0, 1000000, 20000),
                     labels = dollar_format(pre = "")) +
  theme_minimal() + xlab("") + ylab("Nombre sur les 12 derniers mois") +
  theme(legend.position = "none") +
  geom_label(data = . %>% filter(date == as.Date("2015-01-01")), aes(x = date, y = OBS_VALUE, label = DEMOGRAPHIE2, color = TITLE_FR)) +
  ggtitle("Naissances et décès sur les 12 derniers mois - France Métropolitaine")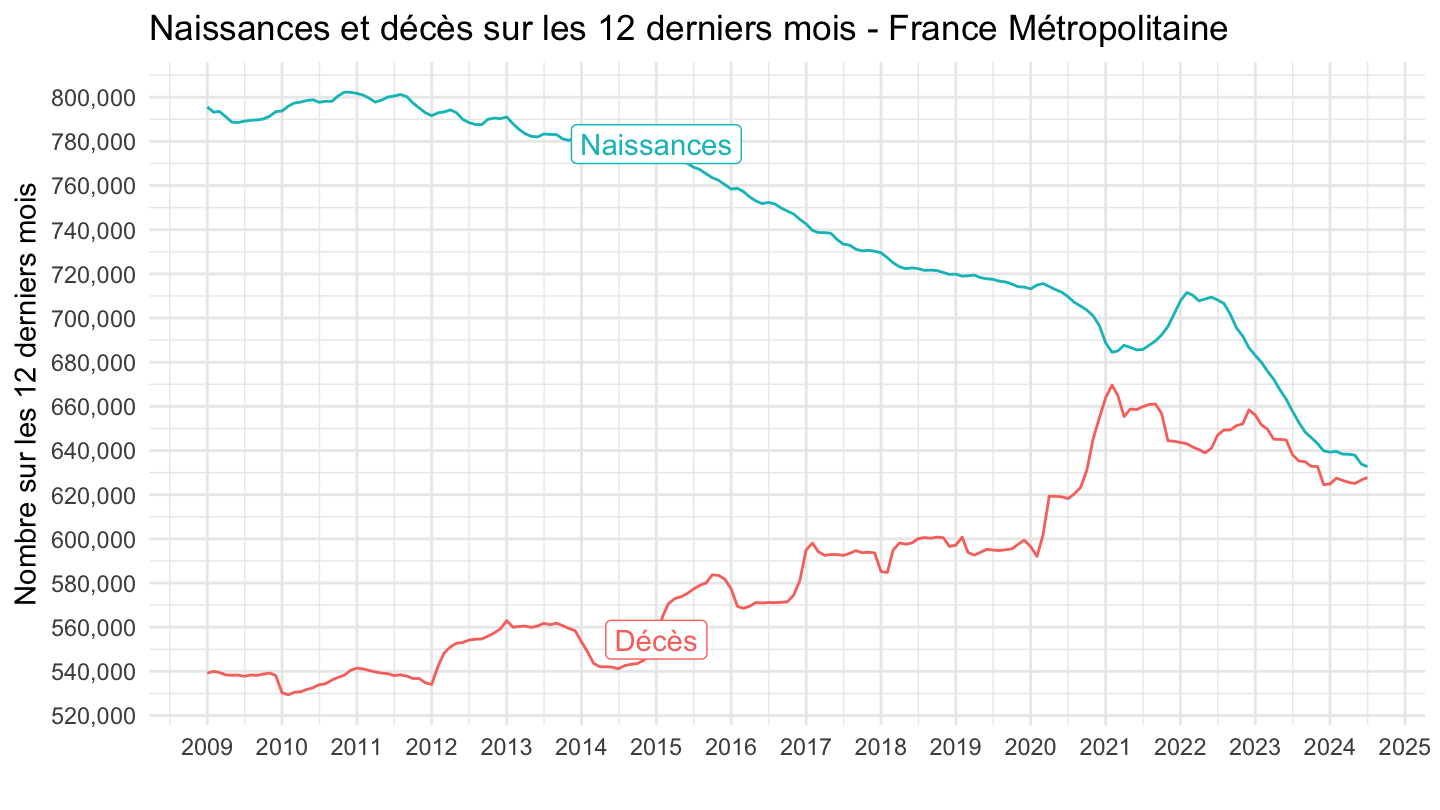
2017-
Code
`DECES-MORTALITE` %>%
  bind_rows(`NAISSANCES-FECONDITE`) %>%
  filter(IDBANK %in% c("000436394", "000436391")) %>%
  month_to_date %>%
  group_by(TITLE_FR) %>%
  arrange(date) %>%
  mutate(OBS_VALUE = rollsum(x = OBS_VALUE, 12, align = "right", fill = NA),
         DEMOGRAPHIE2 = ifelse(DEMOGRAPHIE == "DECES", "Décès", "Naissances")) %>%
  filter(date >= as.Date("2017-01-01")) %>%
  ggplot() + geom_line(aes(x = date, y = OBS_VALUE, color = TITLE_FR)) +
  scale_x_date(breaks = seq(1880, 2100, 1) %>% paste0("-01-01") %>% as.Date,
               labels = date_format("%Y")) +
  scale_y_continuous(breaks = seq(0, 1000000, 20000),
                     labels = dollar_format(pre = "")) +
  theme_minimal() + xlab("") + ylab("Nombre sur les 12 derniers mois") +
  theme(legend.position = "none") +
  geom_label(data = . %>% filter(date == as.Date("2015-01-01")), aes(x = date, y = OBS_VALUE, label = DEMOGRAPHIE2, color = TITLE_FR)) +
  ggtitle("Naissances et décès sur les 12 derniers mois - France Métropolitaine")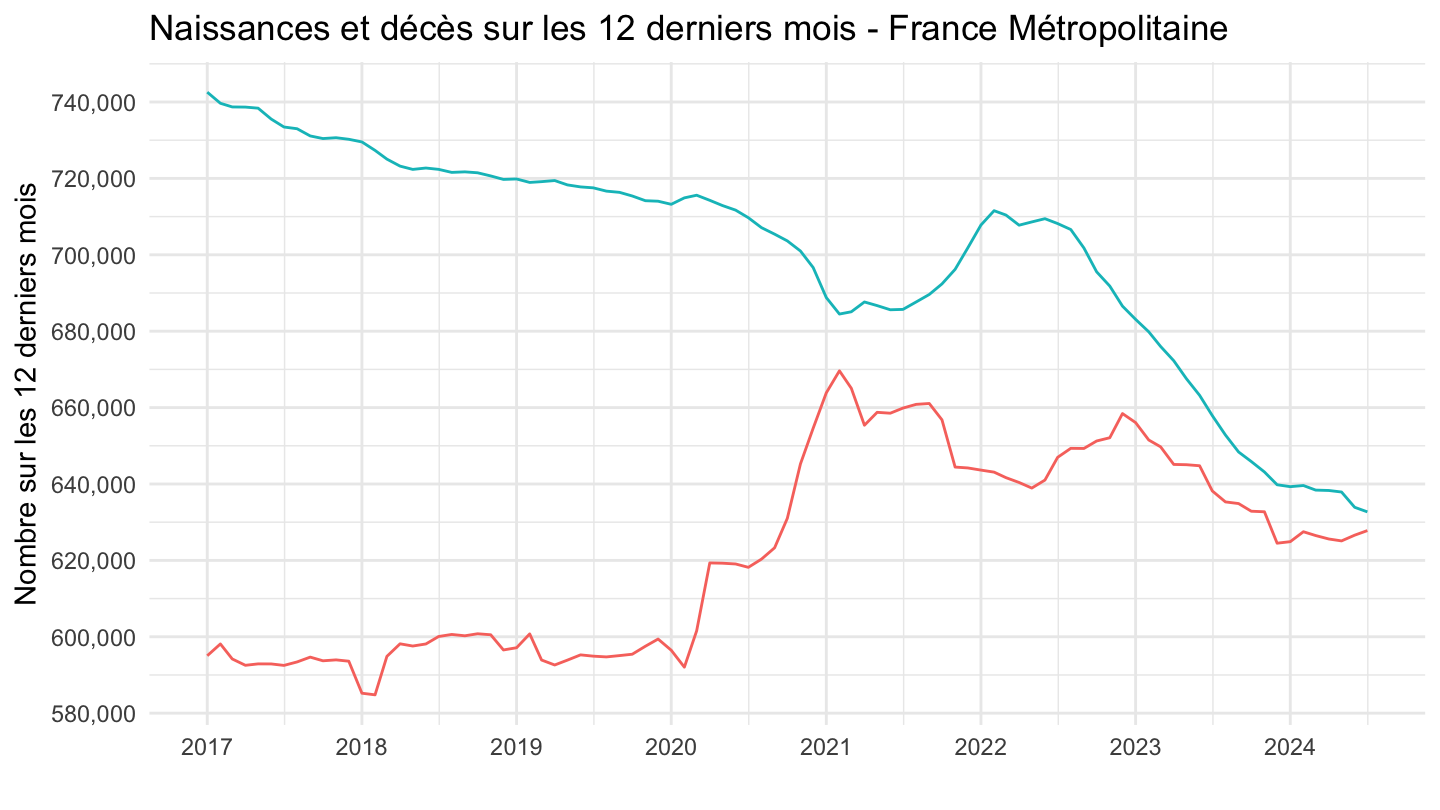
2020-
Code
`DECES-MORTALITE` %>%
  bind_rows(`NAISSANCES-FECONDITE`) %>%
  filter(IDBANK %in% c("000436394", "000436391")) %>%
  month_to_date %>%
  group_by(TITLE_FR) %>%
  arrange(date) %>%
  mutate(OBS_VALUE = rollsum(x = OBS_VALUE, 12, align = "right", fill = NA),
         DEMOGRAPHIE2 = ifelse(DEMOGRAPHIE == "DECES", "Décès", "Naissances")) %>%
  filter(date >= as.Date("2020-01-01")) %>%
  ggplot() + geom_line(aes(x = date, y = OBS_VALUE, color = TITLE_FR)) +
  scale_x_date(breaks = seq(1880, 2100, 1) %>% paste0("-01-01") %>% as.Date,
               labels = date_format("%Y")) +
  scale_y_continuous(breaks = seq(0, 1000000, 20000),
                     labels = dollar_format(pre = "")) +
  theme_minimal() + xlab("") + ylab("Nombre sur les 12 derniers mois") +
  theme(legend.position = "none") +
  geom_label(data = . %>% filter(date == as.Date("2015-01-01")), aes(x = date, y = OBS_VALUE, label = DEMOGRAPHIE2, color = TITLE_FR)) +
  ggtitle("Naissances et décès sur les 12 derniers mois - France Métropolitaine")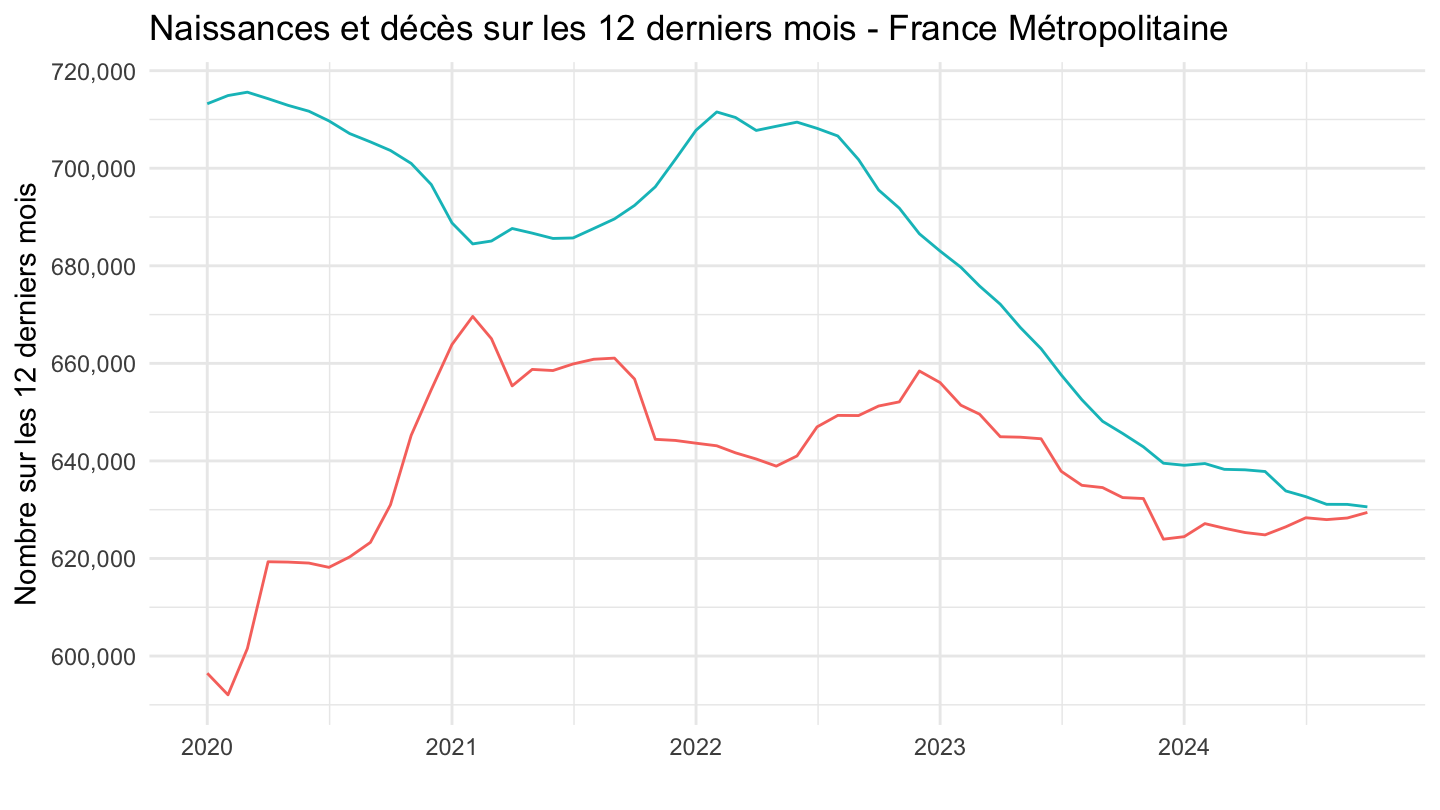
2023-
Code
`DECES-MORTALITE` %>%
  bind_rows(`NAISSANCES-FECONDITE`) %>%
  filter(IDBANK %in% c("000436394", "000436391")) %>%
  month_to_date %>%
  group_by(TITLE_FR) %>%
  arrange(date) %>%
  mutate(OBS_VALUE = rollsum(x = OBS_VALUE, 12, align = "right", fill = NA),
         DEMOGRAPHIE2 = ifelse(DEMOGRAPHIE == "DECES", "Décès", "Naissances")) %>%
  filter(date >= as.Date("2023-01-01")) %>%
  ggplot() + geom_line(aes(x = date, y = OBS_VALUE, color = TITLE_FR)) +
  scale_x_date(breaks = "1 month",
               labels = date_format("%B %Y")) +
  scale_y_continuous(breaks = seq(0, 1000000, 10000),
                     labels = dollar_format(pre = "")) +
  theme_minimal() + xlab("") + ylab("Nombre sur les 12 derniers mois") +
  theme(legend.position = "none",
        axis.text.x = element_text(angle = 45, vjust = 1, hjust = 1)) +
  geom_label(data = . %>% filter(date == as.Date("2015-01-01")), aes(x = date, y = OBS_VALUE, label = DEMOGRAPHIE2, color = TITLE_FR)) +
  ggtitle("Naissances et décès sur les 12 derniers mois - France Métropolitaine") +
  geom_label(data = . %>% filter(max(date) == date),
             aes(x =  date, y = OBS_VALUE, color = TITLE_FR, label = scales::comma(OBS_VALUE)))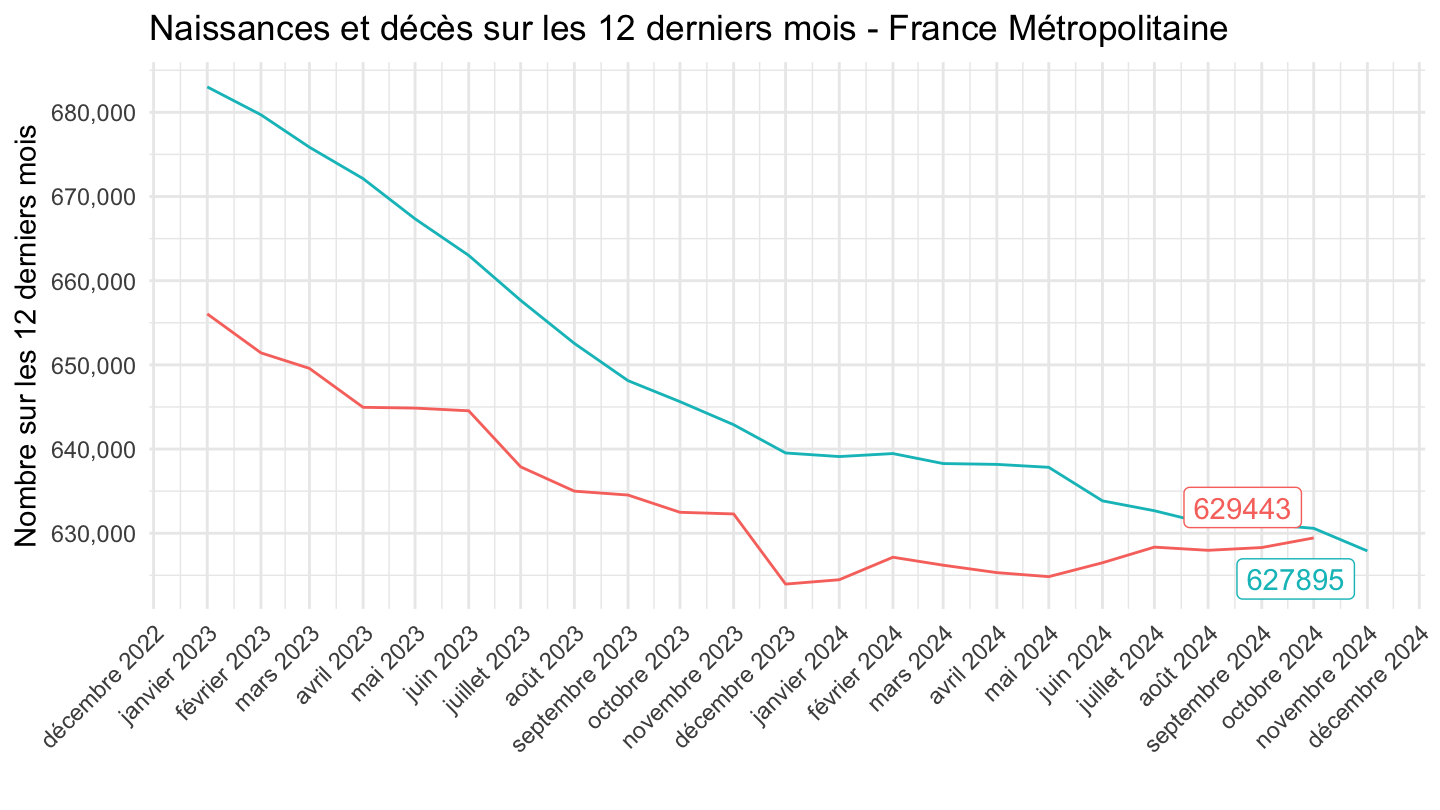
2024-
Code
invisible(Sys.setlocale("LC_TIME", "fr_FR.UTF-8"))
`DECES-MORTALITE` %>%
  bind_rows(`NAISSANCES-FECONDITE`) %>%
  filter(IDBANK %in% c("000436394", "000436391")) %>%
  month_to_date %>%
  group_by(TITLE_FR) %>%
  arrange(date) %>%
  mutate(OBS_VALUE = rollsum(x = OBS_VALUE, 12, align = "right", fill = NA),
         DEMOGRAPHIE2 = ifelse(DEMOGRAPHIE == "DECES", "Décès", "Naissances")) %>%
  filter(date >= max(date) - years(1)-months(2)) %>%
  ggplot() + geom_line(aes(x = date, y = OBS_VALUE, color = TITLE_FR)) +
  scale_x_date(breaks = "1 month",
               labels = date_format("%B %Y")) +
  scale_y_continuous(breaks = seq(0, 1000000, 1000),
                     labels = dollar_format(pre = "")) +
  theme_minimal() + xlab("") + ylab("Nombre sur les 12 derniers mois") +
  theme(legend.position = "none",
        axis.text.x = element_text(angle = 45, vjust = 1, hjust = 1)) +
  geom_label(data = . %>% filter(date == as.Date("2015-01-01")), aes(x = date, y = OBS_VALUE, label = DEMOGRAPHIE2, color = TITLE_FR)) +
  ggtitle("Naissances et décès sur les 12 derniers mois - France Métropolitaine") +
  geom_text(aes(x =  date, y = OBS_VALUE, color = TITLE_FR, label = scales::comma(OBS_VALUE)))
6 mois
Code
`DECES-MORTALITE` %>%
  bind_rows(`NAISSANCES-FECONDITE`) %>%
  filter(IDBANK %in% c("000436394", "000436391")) %>%
  month_to_date %>%
  group_by(TITLE_FR) %>%
  arrange(date) %>%
  mutate(OBS_VALUE = rollsum(x = OBS_VALUE, 6, align = "right", fill = NA)) %>%
  ggplot() + geom_line(aes(x = date, y = OBS_VALUE, color = TITLE_FR)) +
  scale_x_date(breaks = seq(1880, 2100, 5) %>% paste0("-01-01") %>% as.Date,
               labels = date_format("%Y")) +
  scale_y_continuous(breaks = seq(0, 1000000, 20000),
                     labels = dollar_format(pre = "")) +
  theme_minimal() + xlab("") + ylab("Nombre sur les 6 derniers mois") +
  theme(legend.position = c(0.4, 0.5),
        legend.title = element_blank(),
        legend.direction = "vertical")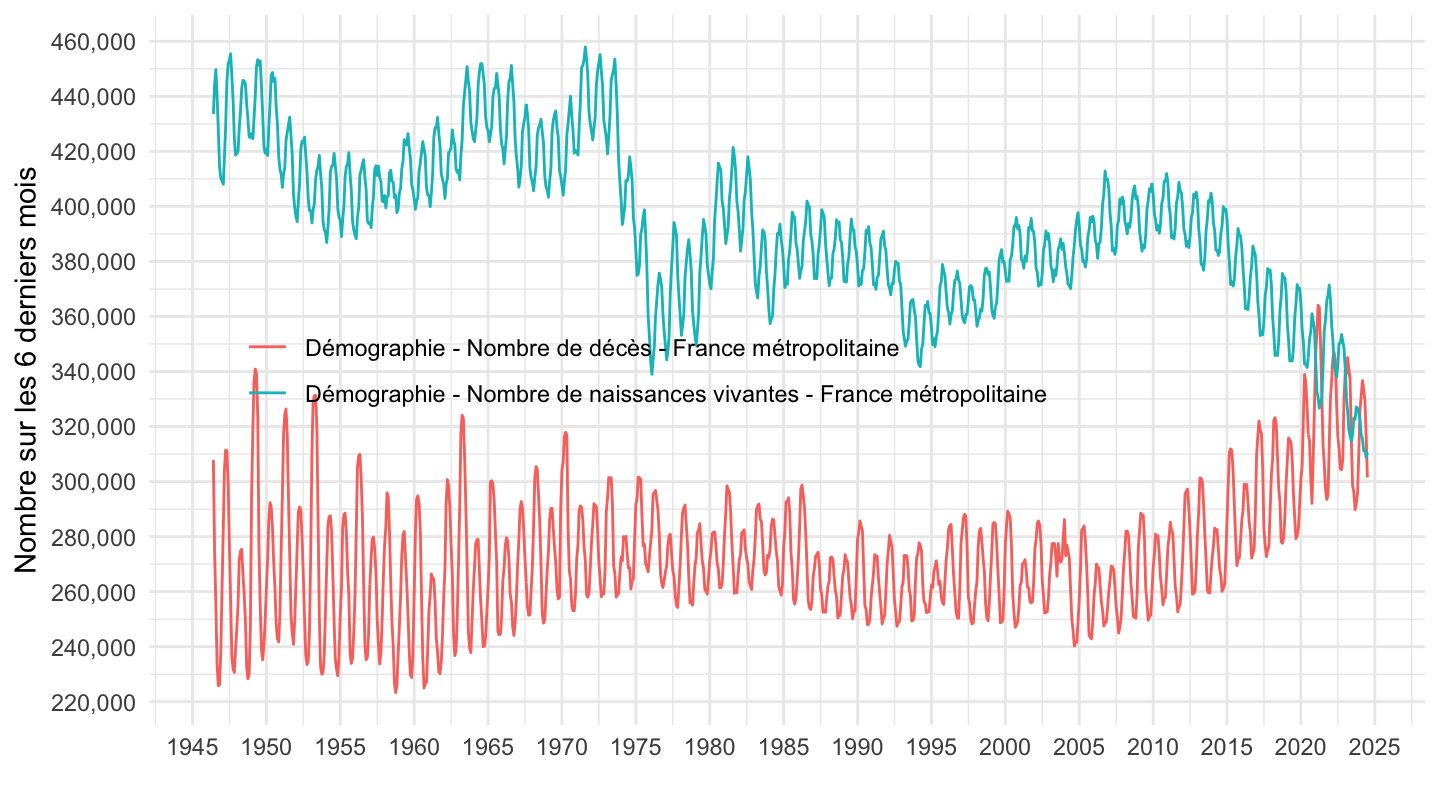
France Entière
12 mois
Code
`DECES-MORTALITE` %>%
  bind_rows(`NAISSANCES-FECONDITE`) %>%
  filter(IDBANK %in% c("001641603", "001641601")) %>%
  month_to_date %>%
  group_by(TITLE_FR) %>%
  arrange(date) %>%
  mutate(OBS_VALUE = rollsum(x = OBS_VALUE, 12, align = "right", fill = NA)) %>%
  ggplot() + geom_line(aes(x = date, y = OBS_VALUE, color = TITLE_FR)) +
  scale_x_date(breaks = seq(1880, 2100, 5) %>% paste0("-01-01") %>% as.Date,
               labels = date_format("%Y")) +
  scale_y_continuous(breaks = seq(0, 1000000, 20000),
                     labels = dollar_format(pre = "")) +
  theme_minimal() + xlab("") + ylab("Nombre sur les 12 derniers mois") +
  theme(legend.position = c(0.4, 0.5),
        legend.title = element_blank(),
        legend.direction = "vertical")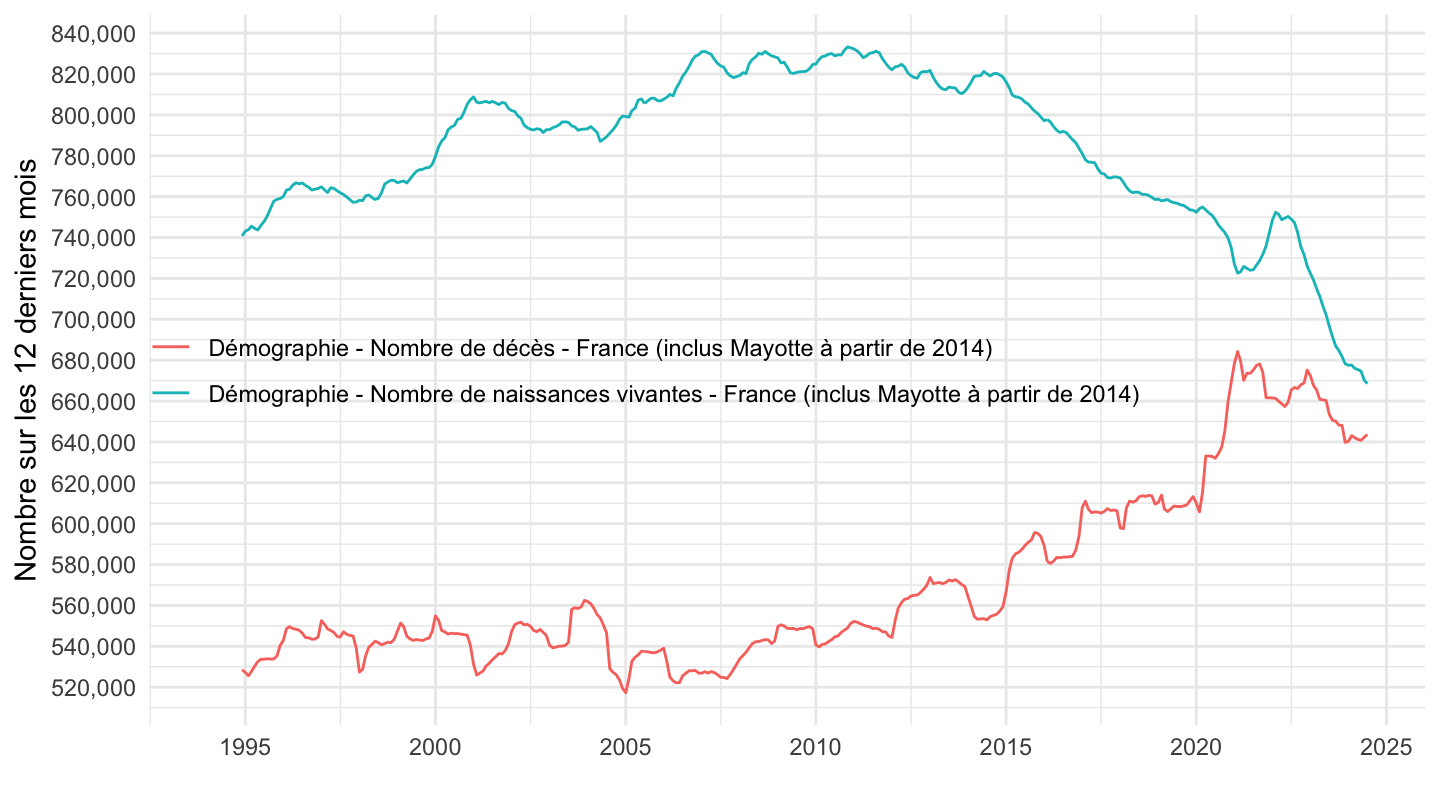
Tous, Dernier chiffre
Code
`DECES-MORTALITE` %>%
  bind_rows(`NAISSANCES-FECONDITE`) %>%
  filter(IDBANK %in% c("001641603", "001641601")) %>%
  month_to_date %>%
  group_by(TITLE_FR) %>%
  arrange(date) %>%
  mutate(OBS_VALUE = rollsum(x = OBS_VALUE, 12, align = "right", fill = NA),
         DEMOGRAPHIE2 = ifelse(DEMOGRAPHIE == "DECES", "Décès", "Naissances")) %>%
  arrange(desc(date)) %>%
  ggplot() + geom_line(aes(x = date, y = OBS_VALUE, color = TITLE_FR), size = 1) +
  scale_x_date(breaks = seq(1880, 2100, 5) %>% paste0("-01-01") %>% as.Date,
               labels = date_format("%Y")) +
  scale_y_continuous(breaks = seq(0, 1000000, 20000),
                     labels = dollar_format(pre = "")) +
  theme_minimal() + xlab("") + ylab("Nombre sur les 12 derniers mois") +
  theme(legend.position = "none") +
  geom_label(data = . %>% filter(date == as.Date("1950-01-01")), aes(x = date, y = OBS_VALUE, label = DEMOGRAPHIE2, color = TITLE_FR, size = 2)) +
  ggtitle("Naissances et décès sur les 12 derniers mois - France Entière") +
  geom_label_repel(data = . %>% filter(max(date) == date),
             aes(x =  max(date) + years(3), y = OBS_VALUE, color = TITLE_FR, label = scales::comma(OBS_VALUE)))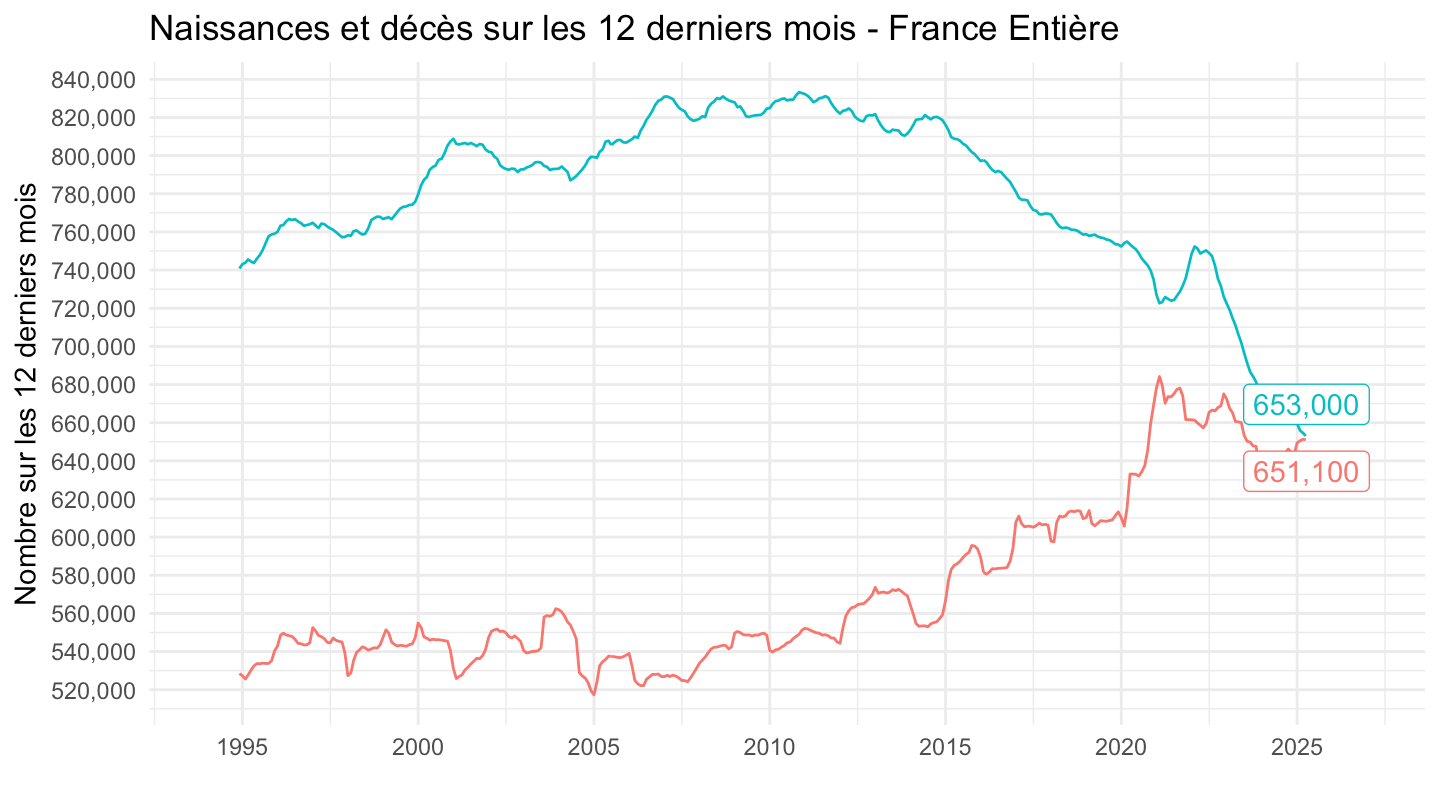
2024-
Code
invisible(Sys.setlocale("LC_TIME", "fr_FR.UTF-8"))
`DECES-MORTALITE` %>%
  bind_rows(`NAISSANCES-FECONDITE`) %>%
  filter(IDBANK %in% c("001641603", "001641601")) %>%
  month_to_date %>%
  group_by(TITLE_FR) %>%
  arrange(date) %>%
  mutate(OBS_VALUE = rollsum(x = OBS_VALUE, 12, align = "right", fill = NA),
         DEMOGRAPHIE2 = ifelse(DEMOGRAPHIE == "DECES", "Décès", "Naissances")) %>%
  filter(date >= max(date) - years(1)-months(2)) %>%
  ggplot() + geom_line(aes(x = date, y = OBS_VALUE, color = TITLE_FR), size = 1) +
  scale_x_date(breaks = "1 month",
               labels = date_format("%B %Y")) +
  scale_y_continuous(breaks = seq(0, 1000000, 5000),
                     labels = dollar_format(pre = "")) +
  theme_minimal() + xlab("") + ylab("Nombre sur les 12 derniers mois") +
  theme(legend.position = "none",
        axis.text.x = element_text(angle = 45, vjust = 1, hjust = 1)) +
  geom_label(data = . %>% filter(date == as.Date("2015-01-01")), aes(x = date, y = OBS_VALUE, label = DEMOGRAPHIE2, color = TITLE_FR)) +
  ggtitle("Naissances et décès sur les 12 derniers mois - France Entière") +
  geom_text_repel(aes(x =  date, y = OBS_VALUE, color = TITLE_FR, label = scales::comma(OBS_VALUE)))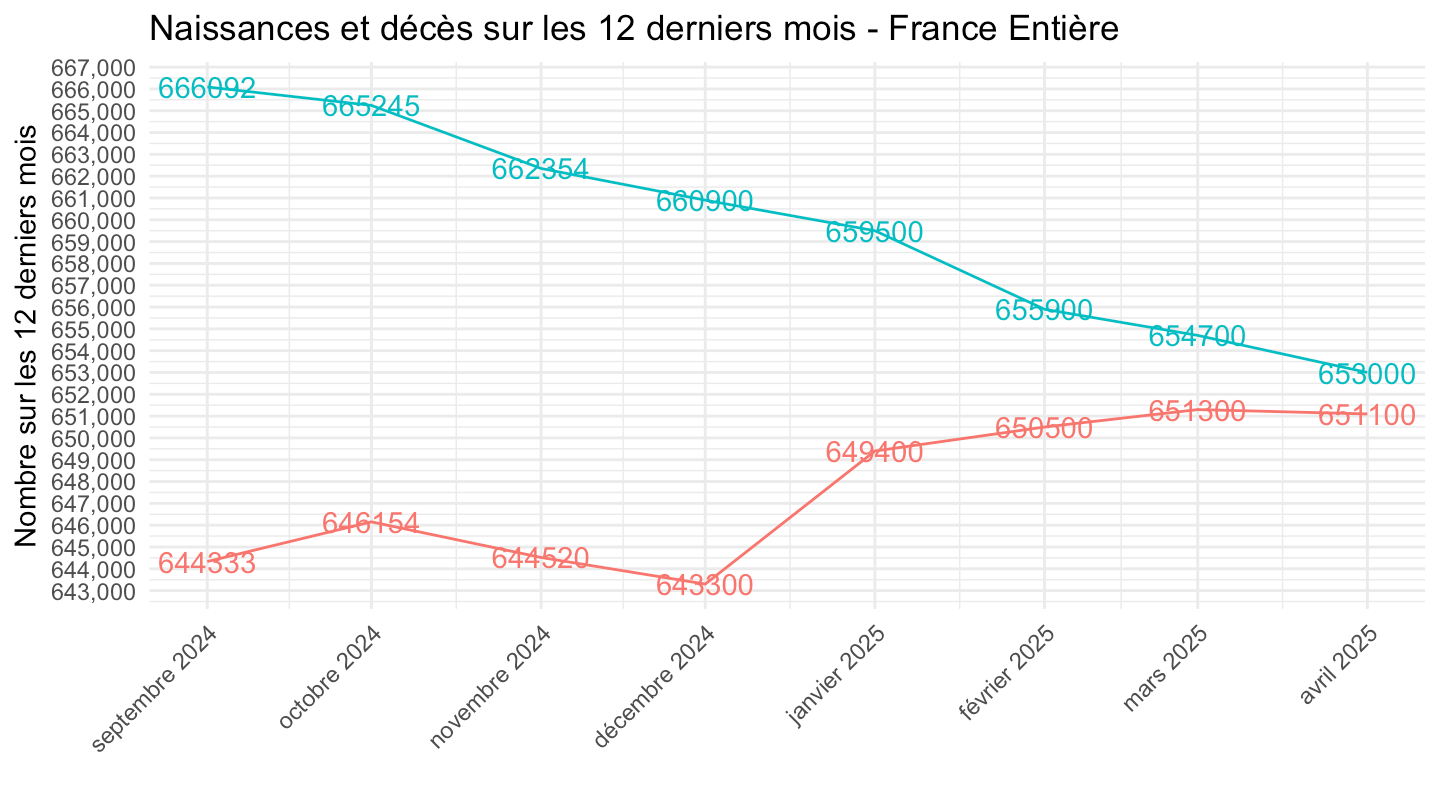
1 an dernier
Code
invisible(Sys.setlocale("LC_TIME", "fr_FR.UTF-8"))
`DECES-MORTALITE` %>%
  bind_rows(`NAISSANCES-FECONDITE`) %>%
  filter(IDBANK %in% c("001641603", "001641601")) %>%
  month_to_date %>%
  group_by(TITLE_FR) %>%
  arrange(date) %>%
  mutate(OBS_VALUE = rollsum(x = OBS_VALUE, 12, align = "right", fill = NA),
         DEMOGRAPHIE2 = ifelse(DEMOGRAPHIE == "DECES", "Décès", "Naissances")) %>%
  filter(date >= max(date) - years(1)) %>%
  ggplot() + geom_line(aes(x = date, y = OBS_VALUE, color = TITLE_FR), size = 1) +
  scale_x_date(breaks = "1 month",
               labels = date_format("%B %Y")) +
  scale_y_continuous(breaks = seq(0, 1000000, 5000),
                     labels = dollar_format(pre = "")) +
  theme_minimal() + xlab("") + ylab("Nombre sur les 12 derniers mois") +
  theme(legend.position = "none",
        axis.text.x = element_text(angle = 45, vjust = 1, hjust = 1)) +
  geom_label(data = . %>% filter(date == as.Date("2015-01-01")), aes(x = date, y = OBS_VALUE, label = DEMOGRAPHIE2, color = TITLE_FR)) +
  ggtitle("Naissances et décès sur les 12 derniers mois - France Entière") +
  geom_text_repel(aes(x =  date, y = OBS_VALUE, color = TITLE_FR, label = scales::comma(OBS_VALUE)))
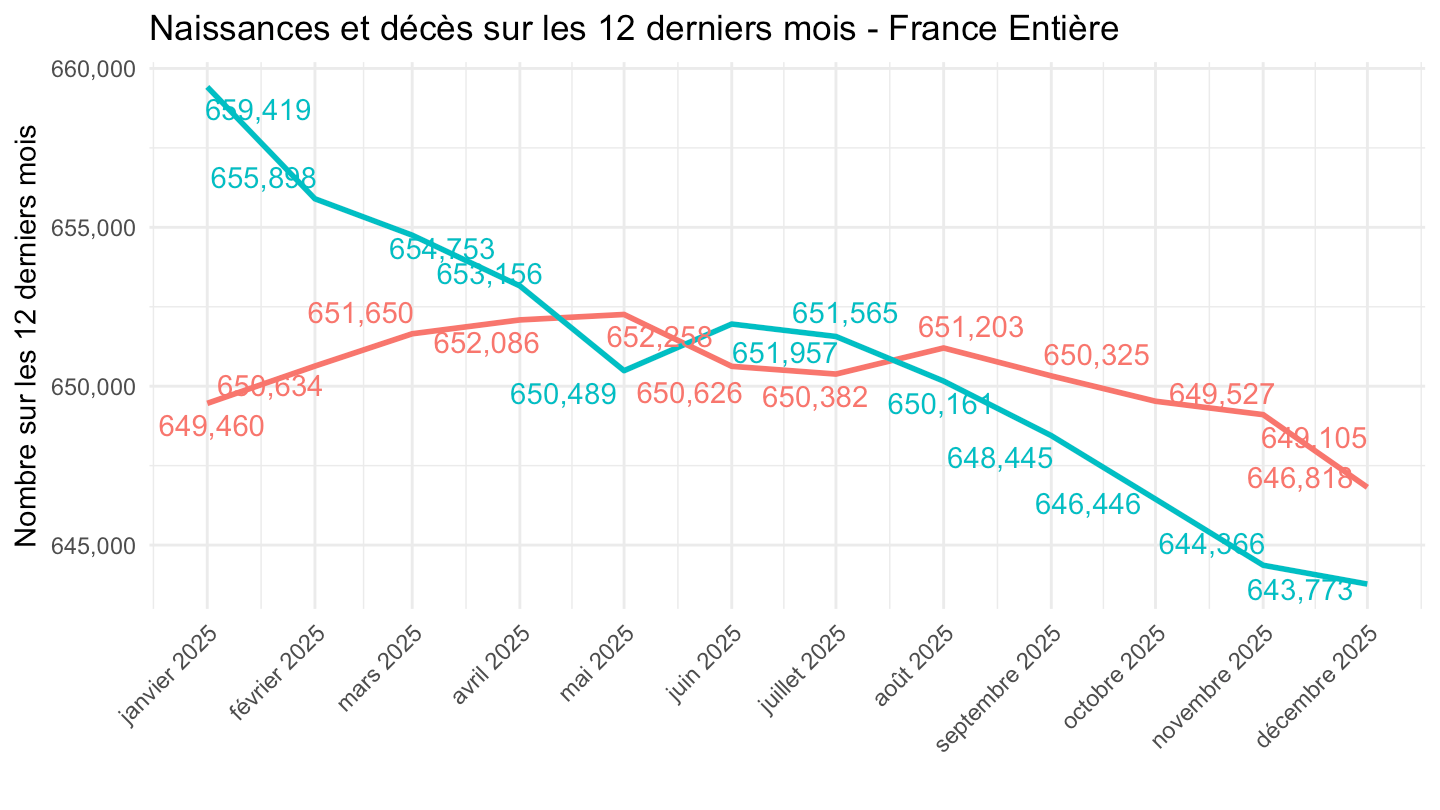
2025-
Code
invisible(Sys.setlocale("LC_TIME", "fr_FR.UTF-8"))
`DECES-MORTALITE` %>%
  bind_rows(`NAISSANCES-FECONDITE`) %>%
  filter(IDBANK %in% c("001641603", "001641601")) %>%
  month_to_date %>%
  group_by(TITLE_FR) %>%
  arrange(date) %>%
  mutate(OBS_VALUE = rollsum(x = OBS_VALUE, 12, align = "right", fill = NA),
         DEMOGRAPHIE2 = ifelse(DEMOGRAPHIE == "DECES", "Décès", "Naissances")) %>%
  filter(date >= as.Date("2025-01-01")) %>%
  ggplot() + geom_line(aes(x = date, y = OBS_VALUE, color = TITLE_FR), size = 1) +
  scale_x_date(breaks = "1 month",
               labels = date_format("%B %Y")) +
  scale_y_continuous(breaks = seq(0, 1000000, 5000),
                     labels = dollar_format(pre = "")) +
  theme_minimal() + xlab("") + ylab("Nombre sur les 12 derniers mois") +
  theme(legend.position = "none",
        axis.text.x = element_text(angle = 45, vjust = 1, hjust = 1)) +
  geom_label(data = . %>% filter(date == as.Date("2015-01-01")), aes(x = date, y = OBS_VALUE, label = DEMOGRAPHIE2, color = TITLE_FR)) +
  ggtitle("Naissances et décès sur les 12 derniers mois - France Entière") +
  geom_text_repel(aes(x =  date, y = OBS_VALUE, color = TITLE_FR, label = scales::comma(OBS_VALUE)))