Infra-annual labour statistics
Data - OECD
Info
Last observation: Quarterly: 2026-Q1 (N = 395) · Monthly: 2026-03 (N = 380) · Annual: 2025 (N = 5,662)
Last update of .RData: 12 avr 2026, 13:05. Last compile: 26 jul 2026, 03:38
Structure
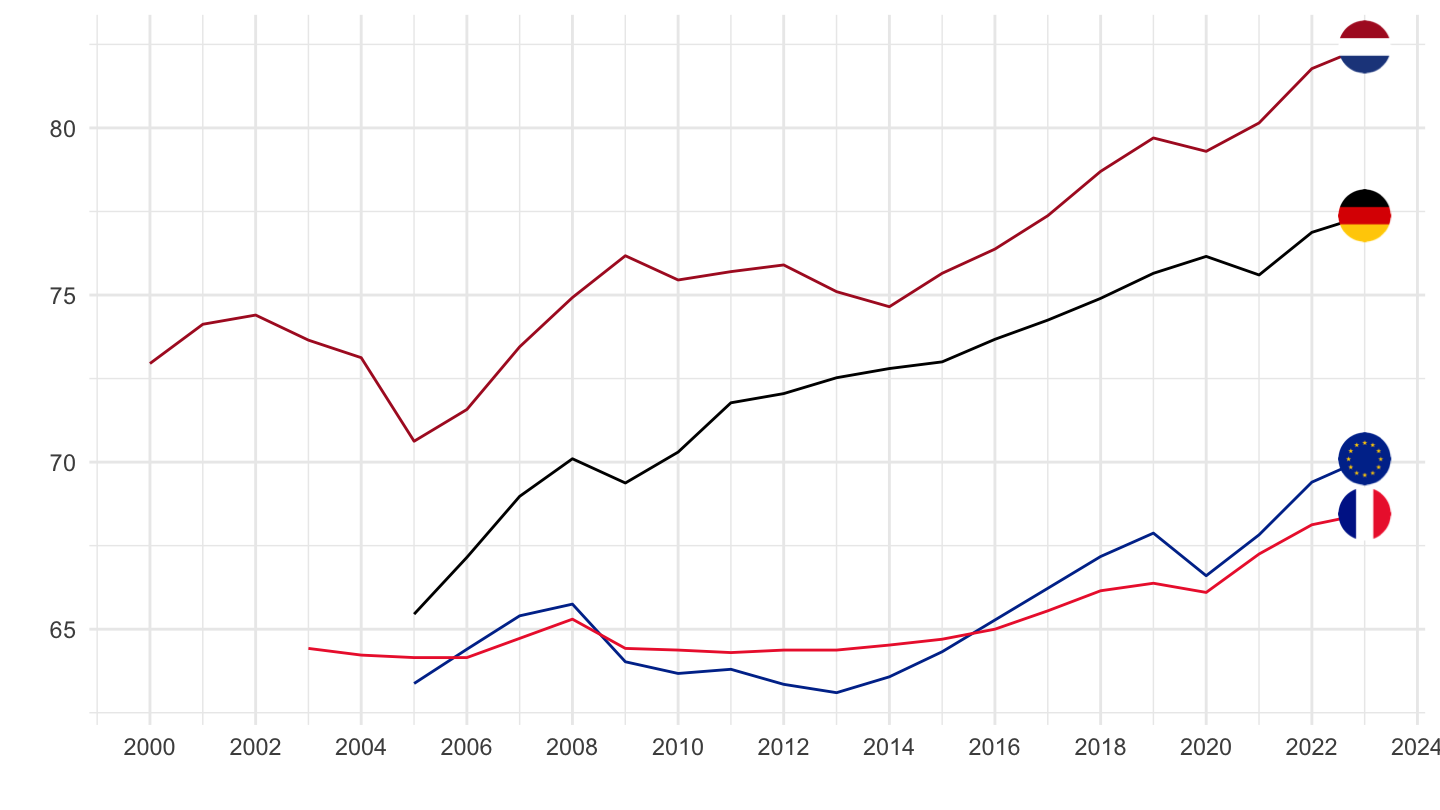
Employment rate
Table
Code
IALFS_INDIC %>%
  filter(MEASURE == "EMP_WAP",
         AGE == "Y15T64",
         FREQ == "A",
         SEX == "_T",
         ADJUSTMENT == "N",
         obsTime == "2023") %>%

  select_if(~ n_distinct(.) > 1) %>%
  arrange(-obsValue) %>%
  print_table_conditional()
France, Netherlands, Germany, Eurozone
Code
IALFS_INDIC %>%
  filter(MEASURE == "EMP_WAP",
         REF_AREA %in% c("FRA", "NLD", "DEU", "EA20"),
         AGE == "Y15T64",
         FREQ == "A",
         SEX == "_T",
         ADJUSTMENT == "N") %>%
  year_to_date() %>%
  arrange(desc(date)) %>%

  mutate(Ref_area = ifelse(REF_AREA == "EA20", "Europe", Ref_area)) %>%
  group_by(Ref_area) %>%
  arrange(date) %>%
  left_join(colors, by = c("Ref_area" = "country")) %>%
  ggplot + geom_line(aes(x = date, y = obsValue, color = color)) +
  scale_color_identity() + add_4flags + theme_minimal() + xlab("") + ylab("") +
  scale_x_date(breaks = seq(1960, 2100, 2) %>% paste0("-01-01") %>% as.Date,
               labels = date_format("%Y")) +
  theme(legend.position = "none")