| source | dataset | Title | .html | .rData |
|---|---|---|---|---|
| oecd | FTPT_COMMON_INC | Incidence of full-time and part-time employment based on OECD-harmonized definition | 2026-07-24 | 2026-07-24 |
Incidence of full-time and part-time employment based on OECD-harmonized definition
Data - OECD
Info
Données sur l’emploi
| Title | source | dataset | .html | .RData |
|---|---|---|---|---|
| Chômage, taux de chômage par sexe et âge (sens BIT) (1975-) | insee | CHOMAGE-TRIM-NATIONAL | 2026-07-24 | NA |
| Emploi intérieur, durée effective travaillée et productivité horaire | insee | CNA-2014-EMPLOI | 2026-07-24 | 2026-07-23 |
| Demandeurs d'emploi inscrits à Pôle Emploi | insee | DEMANDES-EMPLOIS-NATIONALES | 2026-07-24 | NA |
| Emploi, activité, sous-emploi par secteur d’activité (sens BIT) | insee | EMPLOI-BIT-TRIM | 2026-07-24 | NA |
| Estimations d'emploi salarié par secteur d'activité | insee | EMPLOI-SALARIE-TRIM-NATIONAL | 2026-07-24 | 2026-07-23 |
| Taux de chômage localisé | insee | TAUX-CHOMAGE | 2026-07-24 | 2026-07-23 |
| Estimations d'emploi salarié par secteur d'activité et par département | insee | TCRED-EMPLOI-SALARIE-TRIM | 2026-07-24 | NA |
REF_AREA
Code
FTPT_COMMON_INC %>%
  group_by(REF_AREA, Ref_area) %>%
  summarise(Nobs = n()) %>%
  arrange(-Nobs) %>%
  print_table_conditional()
SEX
Code
FTPT_COMMON_INC %>%
  group_by(SEX, Sex) %>%
  summarise(Nobs = n()) %>%
  arrange(-Nobs) %>%
print_table_conditional()| SEX | Sex | Nobs |
|---|---|---|
| M | Male | 160096 |
| F | Female | 159768 |
| _T | Total | 106982 |
AGE
Code
FTPT_COMMON_INC %>%
  group_by(AGE, Age) %>%
  summarise(Nobs = n()) %>%
  arrange(-Nobs) %>%
print_table_conditional()| AGE | Age | Nobs |
|---|---|---|
| _T | Total | 28120 |
| Y55T64 | From 55 to 64 years | 28006 |
| Y25T54 | From 25 to 54 years | 28000 |
| Y15T24 | From 15 to 24 years | 27994 |
| Y15T64 | From 15 to 64 years | 27940 |
| Y_GE65 | 65 years or over | 26552 |
| Y25T29 | From 25 to 29 years | 22808 |
| Y40T44 | From 40 to 44 years | 22805 |
| Y20T24 | From 20 to 24 years | 22802 |
| Y45T49 | From 45 to 49 years | 22802 |
| Y35T39 | From 35 to 39 years | 22796 |
| Y50T54 | From 50 to 54 years | 22796 |
| Y30T34 | From 30 to 34 years | 22793 |
| Y55T59 | From 55 to 59 years | 22792 |
| Y60T64 | From 60 to 64 years | 22772 |
| Y15T19 | From 15 to 19 years | 22632 |
| Y65T69 | From 65 to 69 years | 10633 |
| Y70T74 | From 70 to 74 years | 9697 |
| Y_GE75 | 75 years or over | 7214 |
| Y_GE55 | 55 years or over | 2152 |
| Y65T74 | From 65 to 74 years | 2000 |
| Y_GE70 | 70 years or over | 740 |
MEASURE
Code
FTPT_COMMON_INC %>%
  group_by(MEASURE, Measure) %>%
  summarise(Nobs = n()) %>%
  arrange(-Nobs) %>%
print_table_conditional()| MEASURE | Measure | Nobs |
|---|---|---|
| EMP | Employment | 320149 |
| EMP_PT | Part-time employment | 106697 |
WORKER_STATUS
Code
FTPT_COMMON_INC %>%
  left_join(WORKER_STATUS, by = "WORKER_STATUS") %>%
  group_by(WORKER_STATUS, Worker_status) %>%
  summarise(Nobs = n()) %>%
  arrange(-Nobs) %>%
print_table_conditional()| WORKER_STATUS | Worker_status | Nobs |
|---|---|---|
| _T | Total | 210474 |
| ICSE93_1 | Employees | 206872 |
| ICSE93_2T5 | Self-employed | 9364 |
| _U | No data/unknown | 136 |
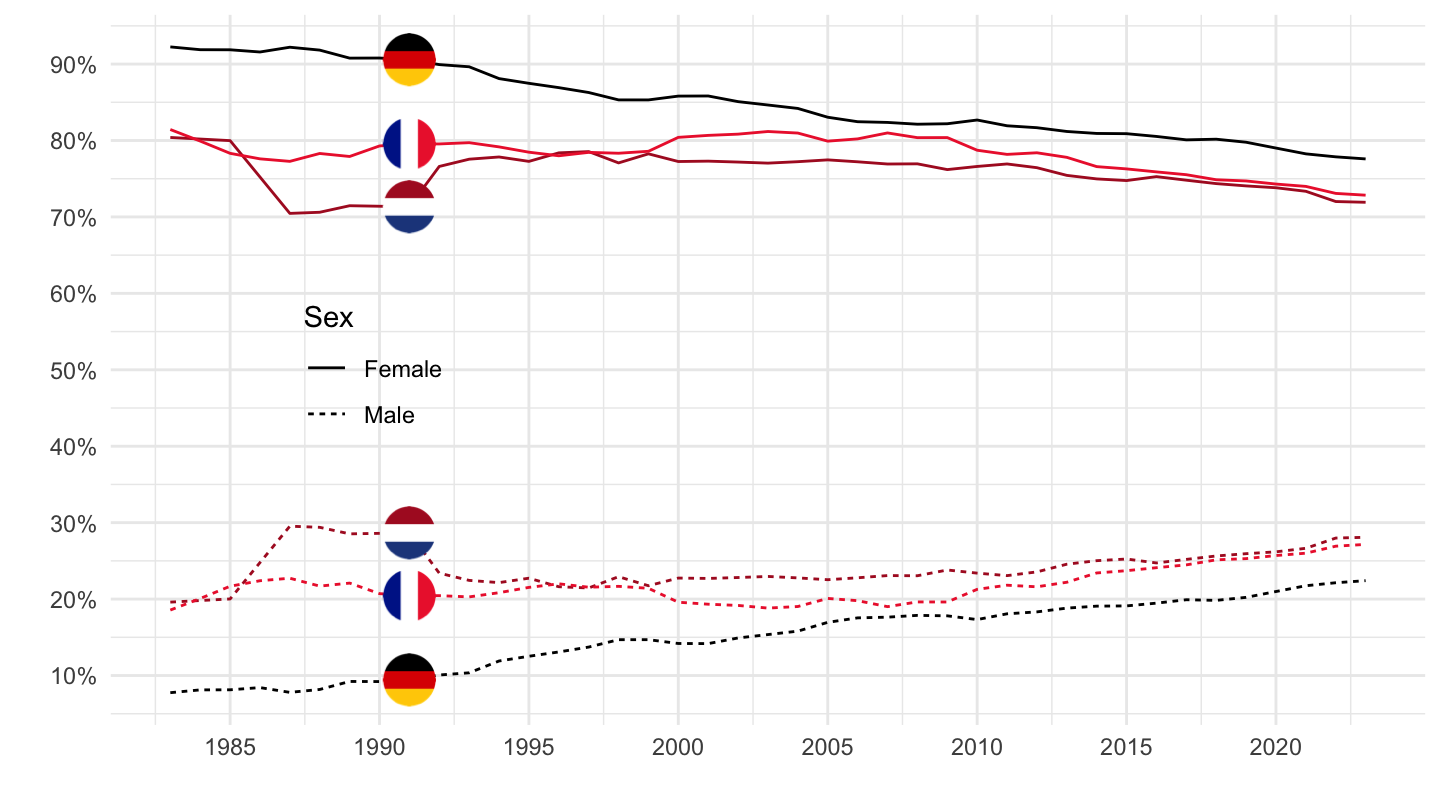
Part-time employment rate
Table
Code
FTPT_COMMON_INC %>%
  filter(MEASURE == "EMP_PT",
         AGE == "Y15T64",
         obsTime == "2023",
         WORKER_STATUS == "_T") %>%
  select_if(~ n_distinct(.) > 1) %>%
  arrange(-obsValue) %>%
  spread(SEX, obsValue) %>%
  arrange(-F) %>%
  print_table_conditional()
France, Netherlands, Germany, Eurozone
Code
FTPT_COMMON_INC %>%
  filter(MEASURE == "EMP_PT",
         REF_AREA %in% c("FRA", "NLD", "DEU", "EA20"),
         AGE == "Y15T64",
         WORKER_STATUS == "_T") %>%
  year_to_date() %>%
  arrange(desc(date)) %>%
  mutate(Ref_area = ifelse(REF_AREA == "EA20", "Europe", Ref_area)) %>%
  group_by(Ref_area) %>%
  arrange(date) %>%
  left_join(colors, by = c("Ref_area" = "country")) %>%
  mutate(obsValue = obsValue/100) %>%
  ggplot + geom_line(aes(x = date, y = obsValue, color = color, linetype = Sex)) +
  scale_color_identity() + add_6flags + theme_minimal() + xlab("") + ylab("") +
  scale_x_date(breaks = seq(1960, 2100, 5) %>% paste0("-01-01") %>% as.Date,
               labels = date_format("%Y")) +
  theme(legend.position = c(0.2, 0.5)) +
  scale_y_continuous(labels = scales::percent_format(),
                     breaks = 0.01*seq(0, 100, 10))