Code
:: i_am ("data/insee/logement-meubles-petite-couronne.qmd" )source (here:: here ("_rinit.R" ))invisible (Sys.setlocale ("LC_TIME" , "fr_FR.UTF-8" ))invisible (Sys.setenv (TZ = "Europe/Paris" ))# cd ~/iCloud/website/data/insee; /usr/local/bin/R -e 'quarto::quarto_render("logement-meubles-petite-couronne.qmd")' # sh ~/iCloud/website/website_short.sh; open https://fgeerolf.com/data/insee/logement-meubles-petite-couronne.html # Données : cd ~/iCloud/website/data/insee; Rscript --vanilla logement_meubles_iris.R source (here:: here ("data" , "insee" , "_iris_meubles.R" )) # wkb2sfc(), iris_meubles_sf(), zones_meubles_sf() :: opts_chunk$ set (echo = TRUE , message = FALSE , warning = FALSE ,fig.width = 8 , fig.height = 7.5 , dpi = 150 )<- c ("75" , "92" , "93" , "94" )<- c (` 75 ` = "Paris" , ` 92 ` = "Hauts-de-Seine" ,` 93 ` = "Seine-Saint-Denis" , ` 94 ` = "Val-de-Marne" )<- here:: here ("data" , "insee" , "logement_meubles_iris.parquet" )<- arrow:: read_parquet (iris_path) |> dplyr:: filter (DEP %in% deps)<- iris_meubles_sf (deps) |> dplyr:: mutate (DEP = substr (COMMUNE, 1 , 2 ))<- zones_meubles_sf (deps) |> :: mutate (nom_zone = dplyr:: if_else (== "75" , paste0 (as.integer (substr (ZONE, 4 , 5 )), "e arr." ), LIBCOM))<- function (name = "Part \n meublé" ) {scale_fill_viridis_c (option = "rocket" , direction = - 1 , name = name,labels = scales:: percent, limits = c (0 , NA ))<- theme_void (base_size = 12 ) + theme (plot.title = element_text (face = "bold" ),plot.subtitle = element_text (colour = "grey35" ),legend.position = "right" )
Même construction que pour Paris seul , étendue à la petite couronne : Paris (75), Hauts-de-Seine (92), Seine-Saint-Denis (93) et Val-de-Marne (94). Le recensement de la population identifie, pour chaque logement occupé à titre de résidence principale, un statut d’occupation détaillé (STOCD) qui distingue les logements loués vides non HLM (21) et loués meublés ou chambres d’hôtel (23). Le locatif privé est la somme des deux, et la part des meublés son poids dans cet ensemble :
\[
\text{part meublé} = \frac{\text{loué meublé}}{\text{loué vide non HLM} + \text{loué meublé}}
\]
Source : fichier détail logement du recensement de la population 2021 (Insee), agrégé par IRIS (2685 IRIS avec au moins un logement locatif privé recensé).
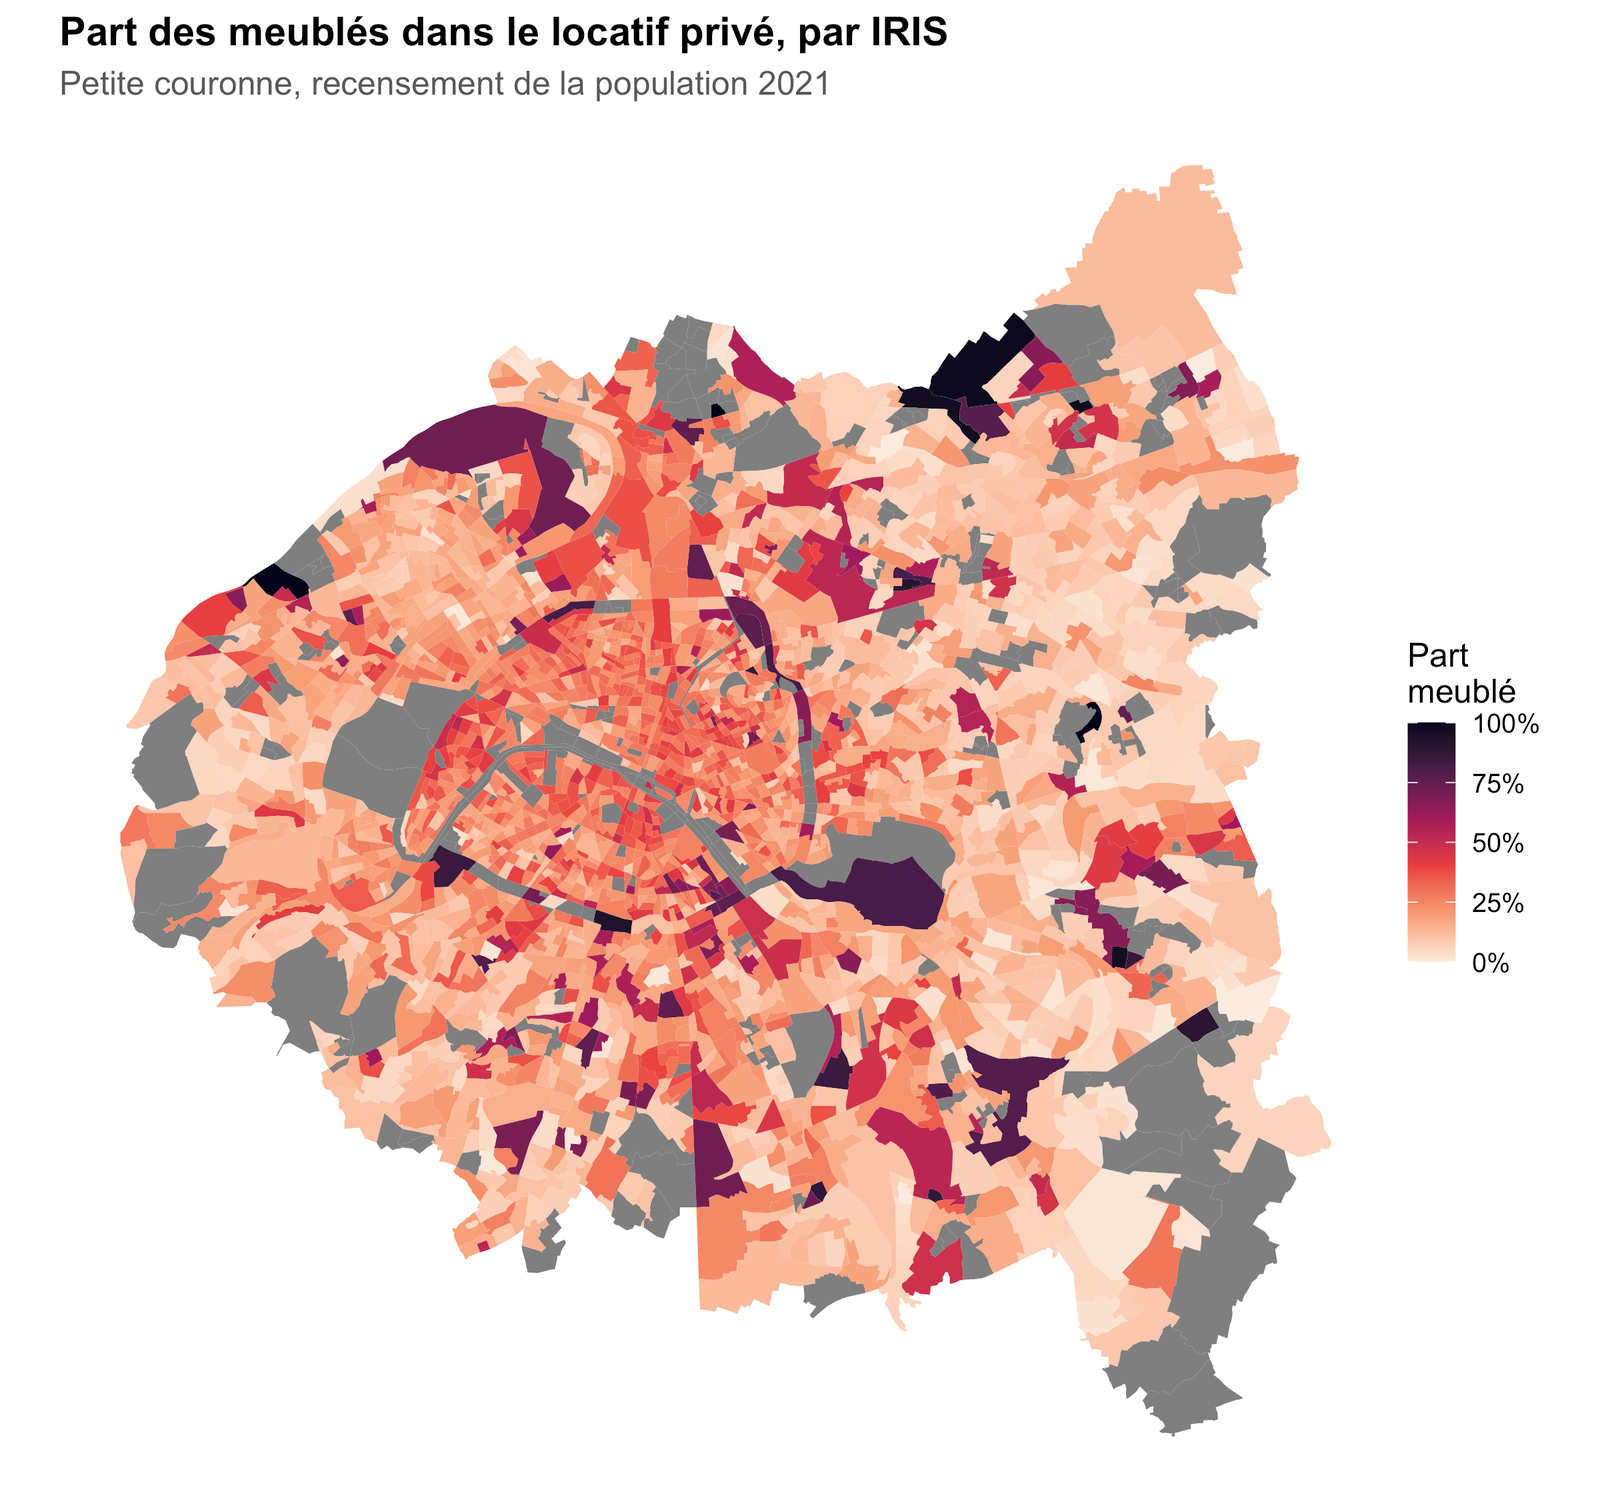
Carte par IRIS
Le gradient est net : la part de meublés est la plus élevée au centre de Paris, décroît vers sa périphérie, puis chute nettement au-delà du périphérique.
Code
|> ggplot () + geom_sf (aes (fill = part_meuble), colour = NA ) + fill_meuble () + labs (title = "Part des meublés dans le locatif privé, par IRIS" ,subtitle = "Petite couronne, recensement de la population 2021" ) +
Carte interactive
Survol pour le détail par IRIS. Les IRIS grisés n’ont pas de logement locatif privé significatif recensé, ou une estimation jugée peu fiable (moins de 30 logements locatifs privés dans l’échantillon).
Code
<- colorNumeric ("rocket" , domain = iris_pc$ part_meuble, na.color = "#d9d9d9" )leaflet (iris_pc, options = leafletOptions (minZoom = 10 )) |> meubles_basemap () |> addPolygons (fillColor = ~ pal (part_meuble), fillOpacity = 0.8 ,color = "white" , weight = 0.3 ,highlightOptions = highlightOptions (weight = 2 , color = "#333" , bringToFront = TRUE ),label = ~ sprintf ("%s (%s), %s — %s" , LIB_IRIS, CODE_IRIS, LIBCOM,ifelse (is.na (part_meuble), "n.d." , scales:: percent (part_meuble, 0.1 ))),popup = ~ sprintf ("<b>%s</b><br>IRIS %s, %s<br>Part meublé : <b>%s</b><br>Logements locatifs privés recensés : %s" ,ifelse (is.na (part_meuble), "n.d." , scales:: percent (part_meuble, 0.1 )),ifelse (is.na (n_locatif_prive), "n.d." , n_locatif_prive))|> addLegend ("bottomright" , pal = pal, values = ~ part_meuble,title = "Part \n meublé" , opacity = 0.9 )
Carte par arrondissement / commune
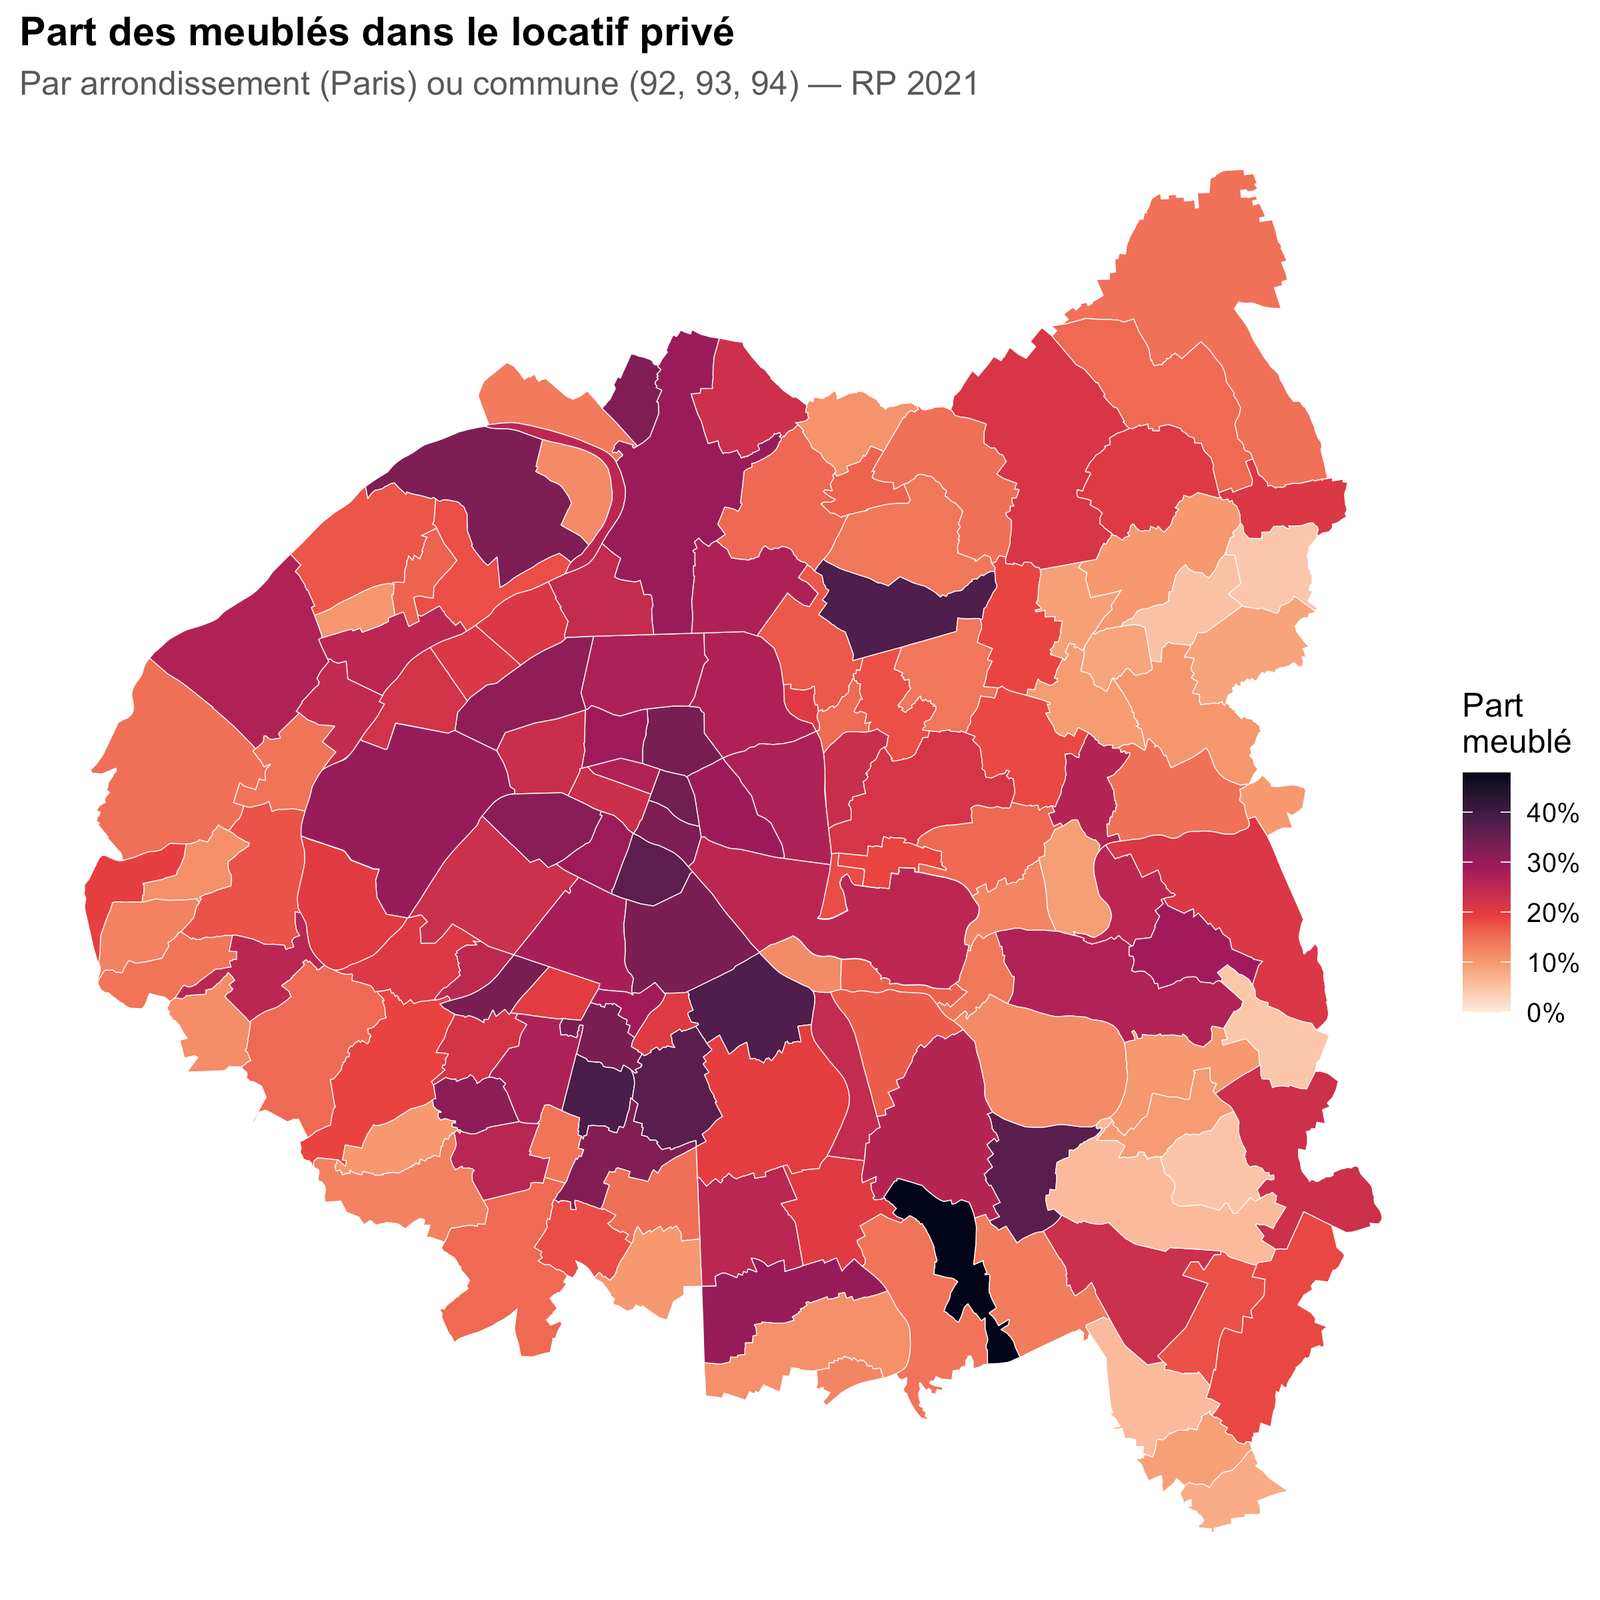
Paris est découpée par arrondissement, les trois autres départements par commune.
Code
|> ggplot () + geom_sf (aes (fill = part_meuble), colour = "white" , linewidth = 0.15 ) + fill_meuble () + labs (title = "Part des meublés dans le locatif privé" ,subtitle = "Par arrondissement (Paris) ou commune (92, 93, 94) — RP 2021" ) +
Carte interactive
Code
<- colorNumeric ("rocket" , domain = zones_pc$ part_meuble, na.color = "#d9d9d9" )leaflet (zones_pc, options = leafletOptions (minZoom = 10 )) |> meubles_basemap () |> addPolygons (fillColor = ~ pal_zone (part_meuble), fillOpacity = 0.8 ,color = "white" , weight = 1 ,highlightOptions = highlightOptions (weight = 2.5 , color = "#333" , bringToFront = TRUE ),label = ~ sprintf ("%s — %s" , nom_zone,ifelse (is.na (part_meuble), "n.d." , scales:: percent (part_meuble, 0.1 ))),popup = ~ sprintf ("<b>%s</b><br>Part meublé : <b>%s</b><br>Logements locatifs privés recensés : %s" ,ifelse (is.na (part_meuble), "n.d." , scales:: percent (part_meuble, 0.1 )),ifelse (is.na (n_locatif_prive), "n.d." , n_locatif_prive))|> addLegend ("bottomright" , pal = pal_zone, values = ~ part_meuble,title = "Part \n meublé" , opacity = 0.9 )
Classement des arrondissements et communes
Code
|> :: st_drop_geometry () |> :: filter (! is.na (part_meuble)) |> :: transmute (Département = noms_dep[DEP], Zone = nom_zone,` Locatif privé ` = n_locatif_prive,` Part meublé ` = part_meuble) |> :: arrange (dplyr:: desc (` Part meublé ` )) |> :: mutate (Rang = dplyr:: row_number (), .before = 1 ) |> :: gt () |> :: fmt_percent (columns = ` Part meublé ` , decimals = 1 ) |> :: fmt_number (columns = ` Locatif privé ` , decimals = 0 ) |> :: data_color (columns = ` Part meublé ` , palette = "OrRd" ) |> :: opt_interactive (use_search = TRUE , use_compact_mode = TRUE ,page_size_default = 15 , page_size_values = c (10 , 15 , 25 , 50 )) |> :: tab_footnote (gt:: md (paste0 ("Recensement de la population 2021 (Insee), fichier détail logement — " ,"locatif privé = loué vide non HLM + loué meublé (`STOCD` 21 et 23)." ))) |> :: tab_options (table.width = "100%" )
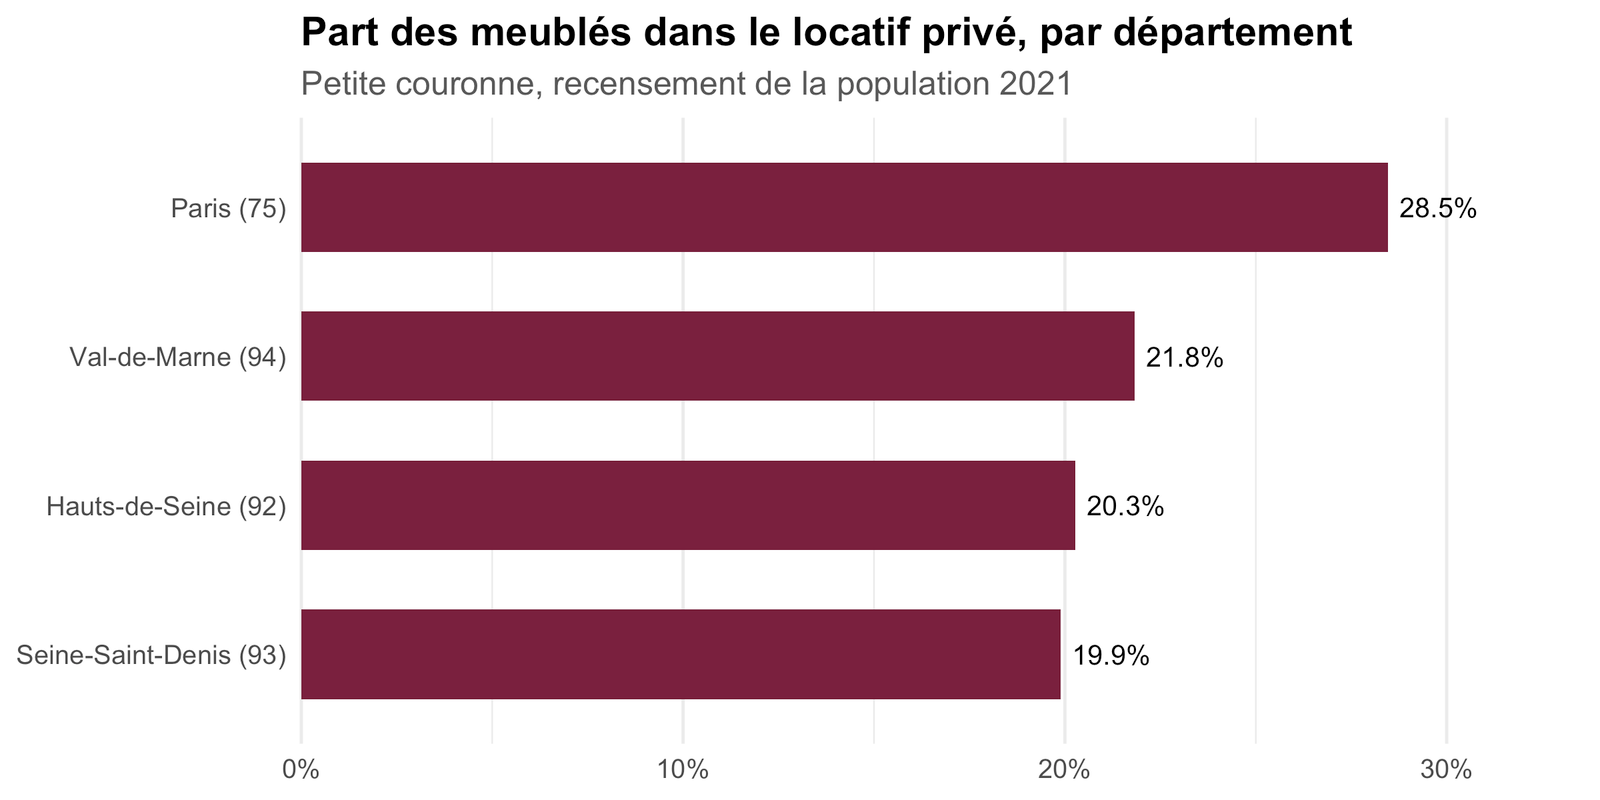
Par département
Code
|> :: group_by (DEP) |> :: summarise (w_meuble = sum (w_meuble), w_locatif_prive = sum (w_locatif_prive),n_locatif_prive = sum (n_locatif_prive), .groups = "drop" ) |> :: mutate (part_meuble = w_meuble / w_locatif_prive,= paste0 (noms_dep[DEP], " (" , DEP, ")" )) |> :: arrange (dplyr:: desc (part_meuble)) |> ggplot (aes (forcats:: fct_reorder (Département, part_meuble), part_meuble)) + geom_col (fill = "#7a1f3d" , width = 0.6 ) + geom_text (aes (label = scales:: percent (part_meuble, 0.1 )), hjust = - 0.15 , size = 3.5 ) + coord_flip (clip = "off" ) + scale_y_continuous (labels = scales:: percent, expand = expansion (mult = c (0 , 0.18 ))) + labs (title = "Part des meublés dans le locatif privé, par département" ,subtitle = "Petite couronne, recensement de la population 2021" , x = NULL , y = NULL ) + theme_minimal (base_size = 12 ) + theme (plot.title = element_text (face = "bold" ),plot.subtitle = element_text (colour = "grey35" ),panel.grid.major.y = element_blank ())
Source & données
Code
:: tibble (` ` = c ("Jeu de données" , "Producteur" , "Fichiers" , "Géométries IRIS" ,"Géométries communes" , "Mise à jour" , "Observations" ),` ` = c ("[Logements ordinaires en 2021 — Fichier détail](https://www.insee.fr/fr/statistiques/8268903)" ,"Insee — Recensement de la population 2021" ,sprintf ("`data/insee/logement_meubles_iris.parquet` (%s ko)" ,round (file.size (iris_path) / 1024 )),"IGN, contours IRIS (Géoplateforme, WFS `data.geopf.fr`)" ,"IGN, Admin Express communes (Géoplateforme, WFS `data.geopf.fr`) + arrondissements de Paris (opendata.paris.fr)" ,format (as.Date (file.mtime (iris_path)), "%d %B %Y" ),sprintf ("%s IRIS, %s logements locatifs privés recensés au total" ,nrow (iris_stats), sum (iris_stats$ n_locatif_prive))|> :: gt () |> :: fmt_markdown (columns = ` ` ) |> :: tab_options (table.width = "100%" , column_labels.hidden = TRUE )
Jeu de données
Logements ordinaires en 2021 — Fichier détail
Producteur
Insee — Recensement de la population 2021
Fichiers
data/insee/logement_meubles_iris.parquet (118 ko)
Géométries IRIS
IGN, contours IRIS (Géoplateforme, WFS data.geopf.fr)
Géométries communes
IGN, Admin Express communes (Géoplateforme, WFS data.geopf.fr) + arrondissements de Paris (opendata.paris.fr)
Mise à jour
24 septembre 2026
Observations
2685 IRIS, 455699 logements locatifs privés recensés au total