Loyers

Data - Olap

Loyers

Tableau

Code
loyers_agglo_paris %>%
  mutate(OBS_VALUE = 100*cumprod(1+value/100),
         year = year+1) %>%
  print_table_conditional()
year value OBS_VALUE
2002 3.9 103.9000
2003 4.9 108.9911
2004 3.8 113.1328
2005 4.1 117.7712
2006 4.6 123.1887
2007 3.2 127.1307
2008 3.8 131.9617
2009 3.1 136.0525
2010 2.9 139.9980
2011 1.8 142.5180
2012 2.6 146.2235
2013 2.8 150.3177
2014 2.3 153.7750
2015 0.8 155.0052
2016 0.5 155.7802
2017 0.1 155.9360
2018 0.8 157.1835
2019 1.5 159.5413
2020 1.7 162.2535
2021 1.2 164.2005
2022 0.8 165.5141
2023 2.4 169.4864
2024 2.9 174.4016
2025 2.5 178.7616

Toutes

Code
loyers_agglo_paris %>%
  mutate(OBS_VALUE = 100*cumprod(1+value/100),
         year = year+1) %>%
  add_row(year = 2001, OBS_VALUE = 100) %>%
  mutate(date = paste0(year, "-01-01") %>% as.Date) %>%
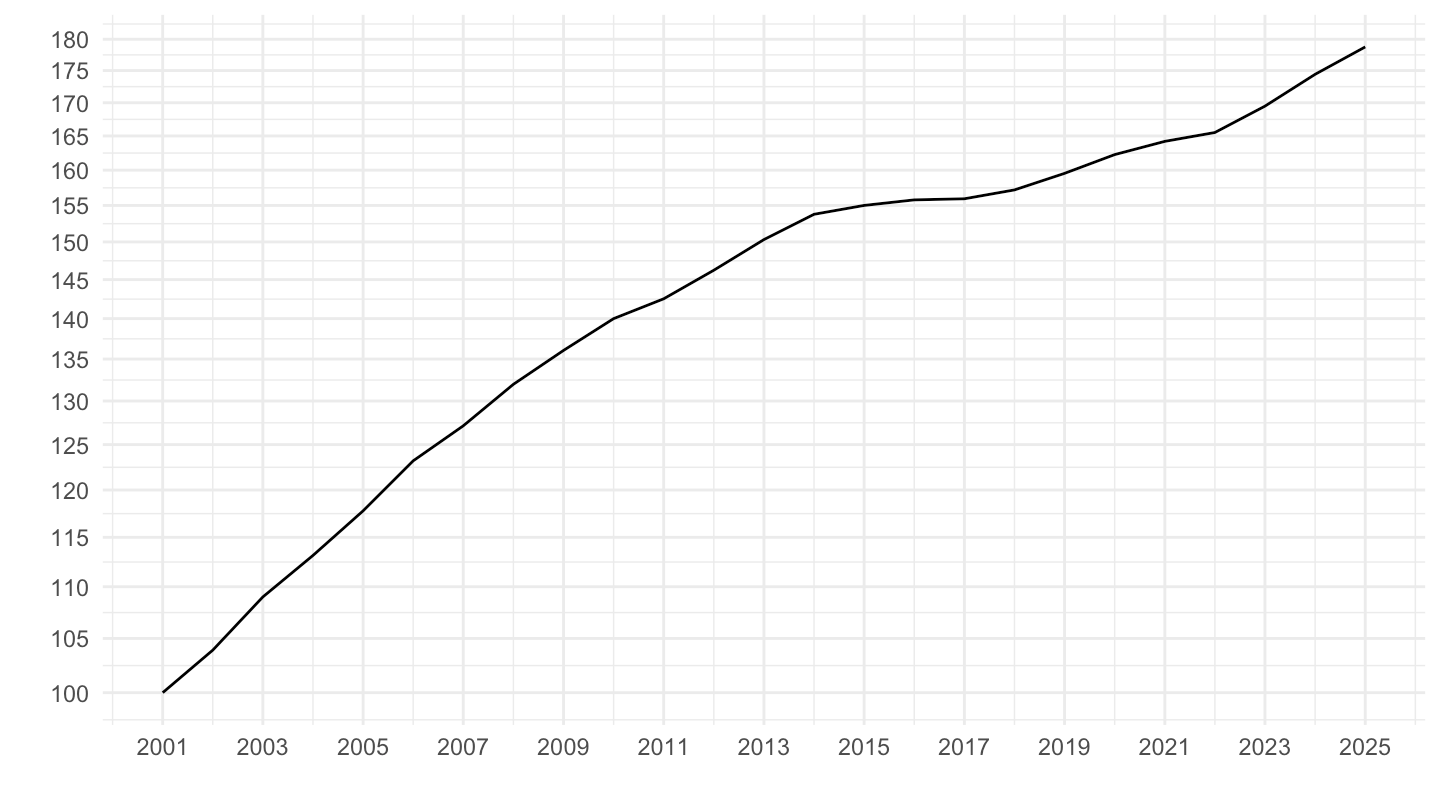
  mutate(variable = "Indice des loyers, source: Observatoire des Loyers de l'Agglomération Parisienne") %>%
  ggplot + geom_line(aes(x = date, y = OBS_VALUE)) +
  theme_minimal() + xlab("") + ylab("") +
  scale_y_log10(breaks = seq(100, 200, 5)) +
  scale_x_date(breaks = seq(2001, 2100, 2) %>% paste0("-01-01") %>% as.Date,
               labels = date_format("%Y")) +
  theme(legend.position = c(0.15, 0.8),
        legend.title = element_blank())