Level of GDP per capita and productivity - PDB_LV
Data - OECD
Info
Data on productivity
LAST_COMPILE
| LAST_COMPILE |
|---|
| 2024-07-01 |
Last
| obsTime | Nobs |
|---|---|
| 2023 | 14 |
| 2022 | 1216 |
| 2021 | 1229 |
Nobs
Code
PDB_LV %>%
  left_join(PDB_LV_var$SUBJECT, by = "SUBJECT") %>%
  group_by(SUBJECT, Subject, MEASURE) %>%
  summarise(Nobs = n()) %>%
  arrange(-Nobs) %>%
print_table_conditional()| SUBJECT | Subject | MEASURE | Nobs |
|---|---|---|---|
| T_POPTOT | Total population; persons; thousands | PEHRS | 2661 |
| T_EMPTO | Total employment (number of persons employed); thousands | PEHRS | 2395 |
| T_GDP | Gross Domestic Product (GDP); millions | CPC | 2287 |
| T_GDP | Gross Domestic Product (GDP); millions | PCTUS | 2287 |
| T_GDPPOP | GDP per head of population | CPC | 2287 |
| T_GDPPOP | GDP per head of population | PCTUS | 2287 |
| T_GDP | Gross Domestic Product (GDP); millions | VPVOB | 2286 |
| T_GDPPOP | GDP per head of population | VPVOB | 2286 |
| T_GPGDPO | Gap in GDP per capita with respect to the USA | GAP | 2234 |
| T_GDPEMP | GDP per person employed | CPC | 2231 |
| T_GDPEMP | GDP per person employed | PCTUS | 2231 |
| T_GDPEMP | GDP per person employed | VPVOB | 2223 |
| T_GDP | Gross Domestic Product (GDP); millions | C | 2215 |
| T_GDPEMP | GDP per person employed | C | 2137 |
| T_GDPPOP | GDP per head of population | C | 2123 |
| T_HRSAV | Average hours worked per person employed | PEHRS | 1985 |
| T_HRSTO | Hours worked for total employment; millions | PEHRS | 1984 |
| T_GDPHRS | GDP per hour worked | CPC | 1960 |
| T_GDPHRS | GDP per hour worked | PCTUS | 1960 |
| T_GDPHRS | GDP per hour worked | VPVOB | 1953 |
| T_HRSPOP | Labour utilisation (hours worked per head of population) | PEHRS | 1950 |
| T_HRSPOP | Labour utilisation (hours worked per head of population) | PCTUS | 1949 |
| T_GPHRPO | Gap in labour utilisation with respect to the USA | GAP | 1929 |
| T_GPGDHR | Gap in GDP per hour worked with respect to the USA | GAP | 1907 |
| T_GDPHRS | GDP per hour worked | C | 1890 |
| T_GNIHRS | Gross national income per hour worked | CPC | 1727 |
SUBJECT
Code
PDB_LV %>%
  left_join(PDB_LV_var$SUBJECT, by = "SUBJECT") %>%
  group_by(SUBJECT, Subject) %>%
  summarise(Nobs = n()) %>%
  arrange(-Nobs) %>%
print_table_conditional()| SUBJECT | Subject | Nobs |
|---|---|---|
| T_GDP | Gross Domestic Product (GDP); millions | 9075 |
| T_GDPPOP | GDP per head of population | 8983 |
| T_GDPEMP | GDP per person employed | 8822 |
| T_GDPHRS | GDP per hour worked | 7763 |
| T_HRSPOP | Labour utilisation (hours worked per head of population) | 3899 |
| T_POPTOT | Total population; persons; thousands | 2661 |
| T_EMPTO | Total employment (number of persons employed); thousands | 2395 |
| T_GPGDPO | Gap in GDP per capita with respect to the USA | 2234 |
| T_HRSAV | Average hours worked per person employed | 1985 |
| T_HRSTO | Hours worked for total employment; millions | 1984 |
| T_GPHRPO | Gap in labour utilisation with respect to the USA | 1929 |
| T_GPGDHR | Gap in GDP per hour worked with respect to the USA | 1907 |
| T_GNIHRS | Gross national income per hour worked | 1727 |
MEASURE
Code
PDB_LV %>%
  left_join(PDB_LV_var$MEASURE, by = "MEASURE") %>%
  group_by(MEASURE, Measure) %>%
  summarise(Nobs = n()) %>%
  arrange(-Nobs) %>%
print_table_conditional()| MEASURE | Measure | Nobs |
|---|---|---|
| PEHRS | Persons/Hours | 10975 |
| PCTUS | As % of the USA (USA=100) | 10714 |
| CPC | USD, current prices, current PPPs | 10492 |
| VPVOB | USD, constant prices, 2015 PPPs | 8748 |
| C | National currency, current prices | 8365 |
| GAP | Gap in % points | 6070 |
T_HRSPOP - Labour utilisation (hours worked per head of population)
PCTUS - As % of the USA (USA=100)
Code
PDB_LV %>%
  filter(SUBJECT == "T_HRSPOP",
         MEASURE == "PCTUS",
         LOCATION %in% c("ITA", "DEU", "GRC", "ESP", "PRT", "FRA")) %>%
  year_to_date %>%
  filter(date >= as.Date("2000-01-01")) %>%
  left_join(PDB_LV_var$LOCATION, by = "LOCATION") %>%
  group_by(LOCATION) %>%
  arrange(date) %>%
  left_join(colors, by = c("Location" = "country")) %>%
  mutate(obsValue = obsValue / 100) %>%
  ggplot(.) + geom_line(aes(x = date, y = obsValue, color = color)) +
  theme_minimal() + xlab("") + ylab("") + scale_color_identity() + add_6flags +
  scale_x_date(breaks = seq(1960, 2100, 2) %>% paste0("-01-01") %>% as.Date,
               labels = date_format("%Y")) +
  theme(legend.position = c(0.25, 0.9),
        legend.title = element_blank(),
        legend.direction = "horizontal") +
  scale_y_continuous(breaks = 0.01*seq(0, 200, 5),
                labels = percent_format(acc = 1))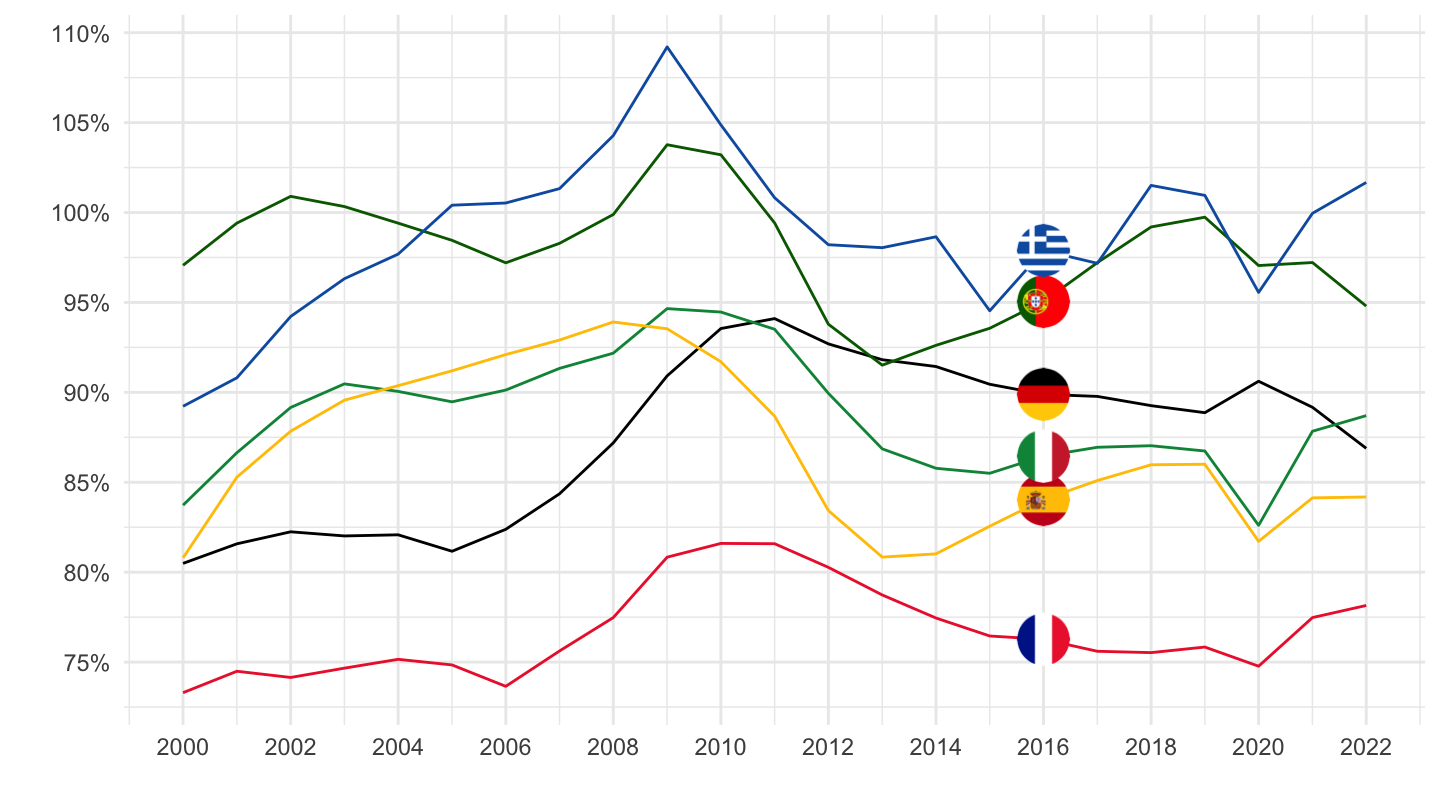
PEHRS - Persons/Hours
Code
PDB_LV %>%
  filter(SUBJECT == "T_HRSPOP",
         MEASURE == "PEHRS",
         LOCATION %in% c("ITA", "DEU", "GRC", "ESP", "PRT", "FRA")) %>%
  year_to_date %>%
  #filter(date >= as.Date("2000-01-01")) %>%
  left_join(PDB_LV_var$LOCATION, by = "LOCATION") %>%
  group_by(LOCATION) %>%
  arrange(date) %>%
  left_join(colors, by = c("Location" = "country")) %>%
  ggplot(.) + geom_line(aes(x = date, y = obsValue, color = color)) +
  theme_minimal() + xlab("") + ylab("") + scale_color_identity() + add_6flags +
  scale_x_date(breaks = seq(1960, 2100, 5) %>% paste0("-01-01") %>% as.Date,
               labels = date_format("%Y")) +
  theme(legend.position = c(0.25, 0.9),
        legend.title = element_blank(),
        legend.direction = "horizontal") +
  scale_y_continuous(breaks =seq(0, 20000, 25),
                     labels = dollar_format(acc = 1, p = "", su = "h"))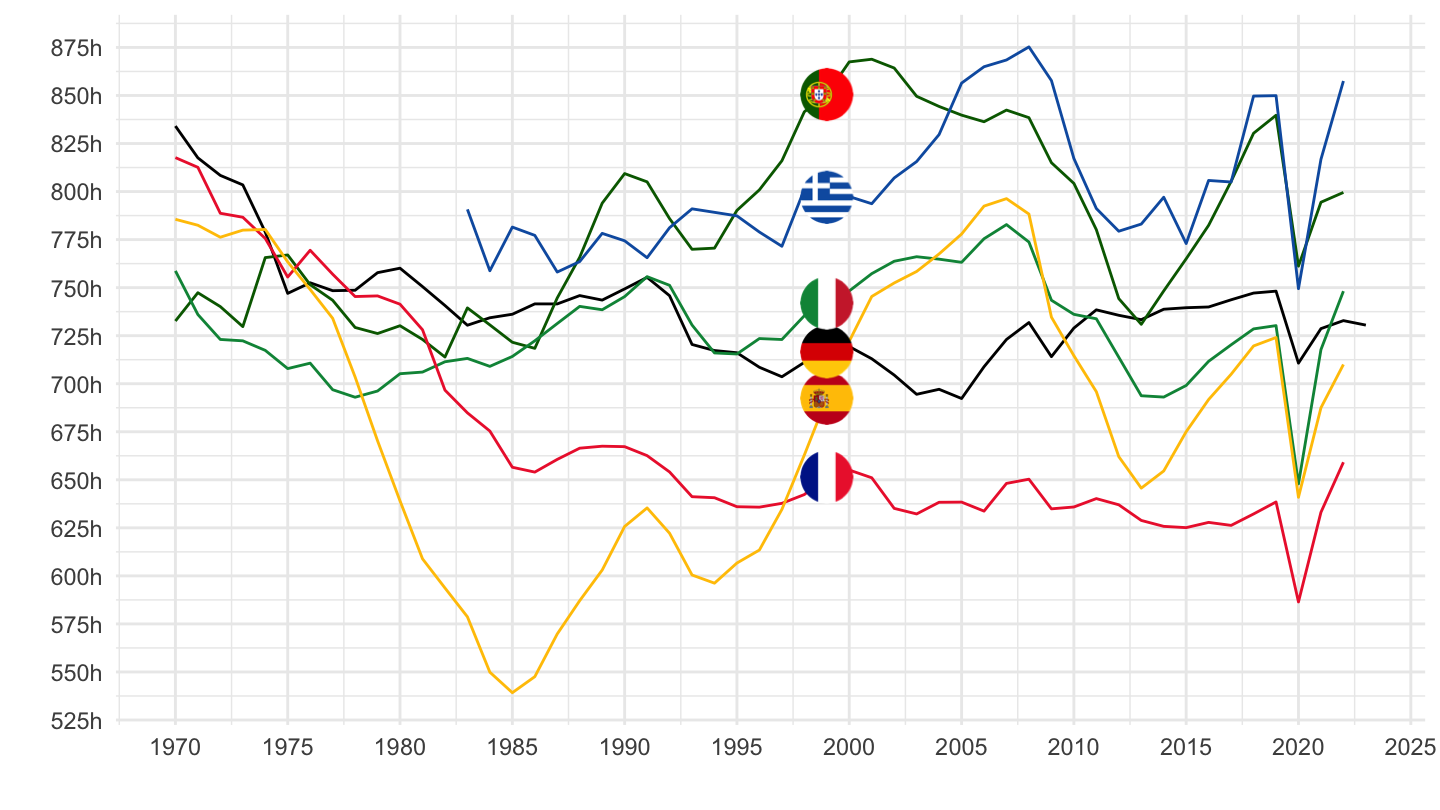
T_HRSAV - Average hours worked per person employed
PEHRS - Persons/Hours
Code
PDB_LV %>%
  filter(SUBJECT == "T_HRSAV",
         MEASURE == "PEHRS",
         LOCATION %in% c("ITA", "DEU", "GRC", "ESP", "PRT", "FRA")) %>%
  year_to_date %>%
  #filter(date >= as.Date("2000-01-01")) %>%
  left_join(PDB_LV_var$LOCATION, by = "LOCATION") %>%
  group_by(LOCATION) %>%
  arrange(date) %>%
  left_join(colors, by = c("Location" = "country")) %>%
  ggplot(.) + geom_line(aes(x = date, y = obsValue, color = color)) +
  theme_minimal() + xlab("") + ylab("") + scale_color_identity() +add_6flags +
  scale_x_date(breaks = seq(1960, 2100, 5) %>% paste0("-01-01") %>% as.Date,
               labels = date_format("%Y")) +
  theme(legend.position = c(0.25, 0.9),
        legend.title = element_blank(),
        legend.direction = "horizontal") +
  scale_y_continuous(breaks =seq(0, 20000, 25),
                     labels = dollar_format(acc = 1, p = "", su = "h"))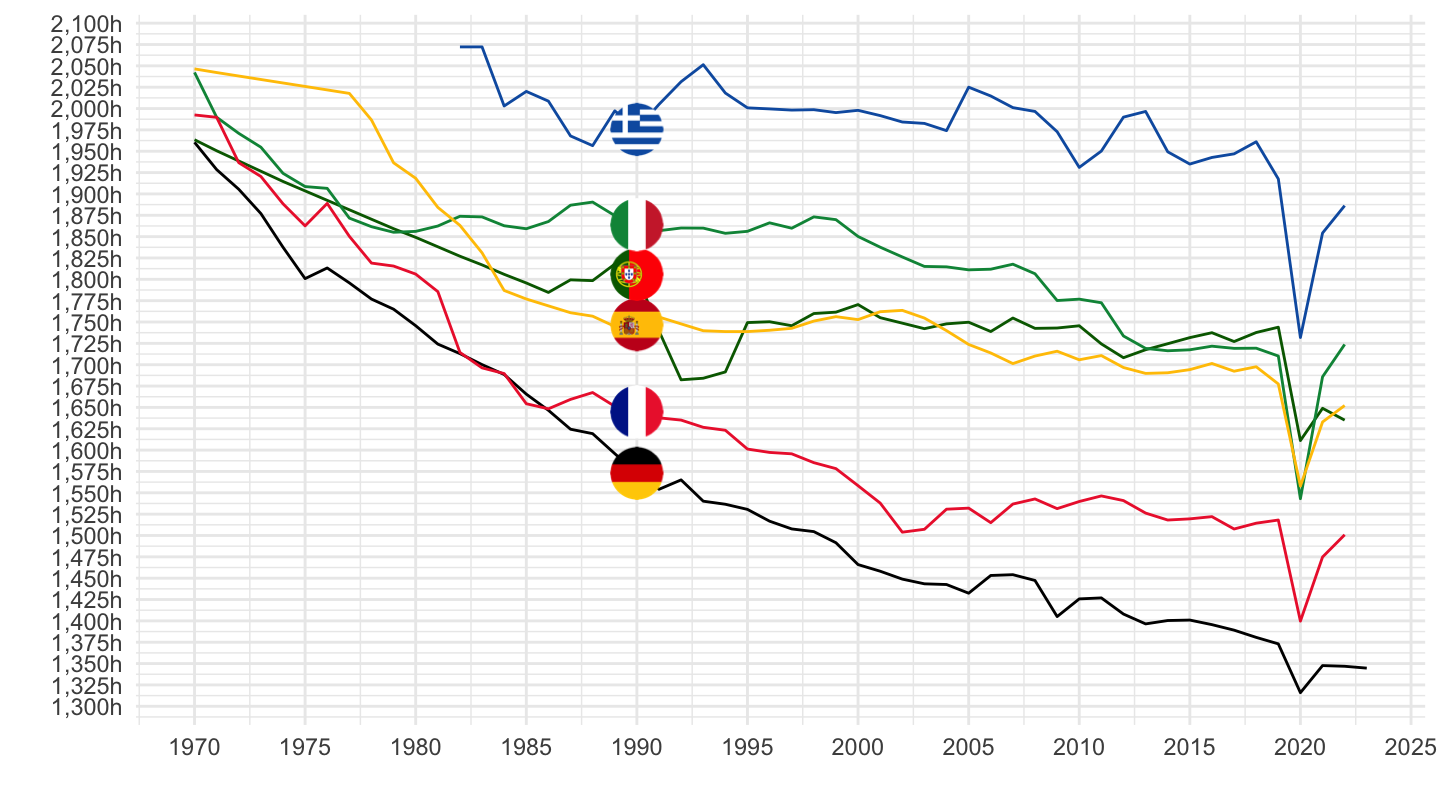
GDP per person employed - T_GDPEMP
VPVOB = USD, constant prices, 2015 PPPs
Code
PDB_LV %>%
  filter(SUBJECT == "T_GDPEMP",
         MEASURE == "VPVOB",
         LOCATION %in% c("ITA", "DEU", "GRC", "ESP", "PRT", "FRA")) %>%
  year_to_date %>%
  filter(date >= as.Date("2000-01-01")) %>%
  left_join(PDB_LV_var$LOCATION, by = "LOCATION") %>%
  group_by(LOCATION) %>%
  arrange(date) %>%
  left_join(colors, by = c("Location" = "country")) %>%
  mutate(obsValue = obsValue / 1000) %>%
  ggplot(.) + geom_line(aes(x = date, y = obsValue, color = color)) +
  theme_minimal() + xlab("") + ylab("GDP Per Person Employed") + scale_color_identity() + add_6flags +
  scale_x_date(breaks = seq(1960, 2100, 2) %>% paste0("-01-01") %>% as.Date,
               labels = date_format("%Y")) +
  theme(legend.position = c(0.25, 0.9),
        legend.title = element_blank(),
        legend.direction = "horizontal") +
  scale_y_log10(breaks = seq(0, 200, 5),
                labels = dollar_format(su = "k", acc = 1))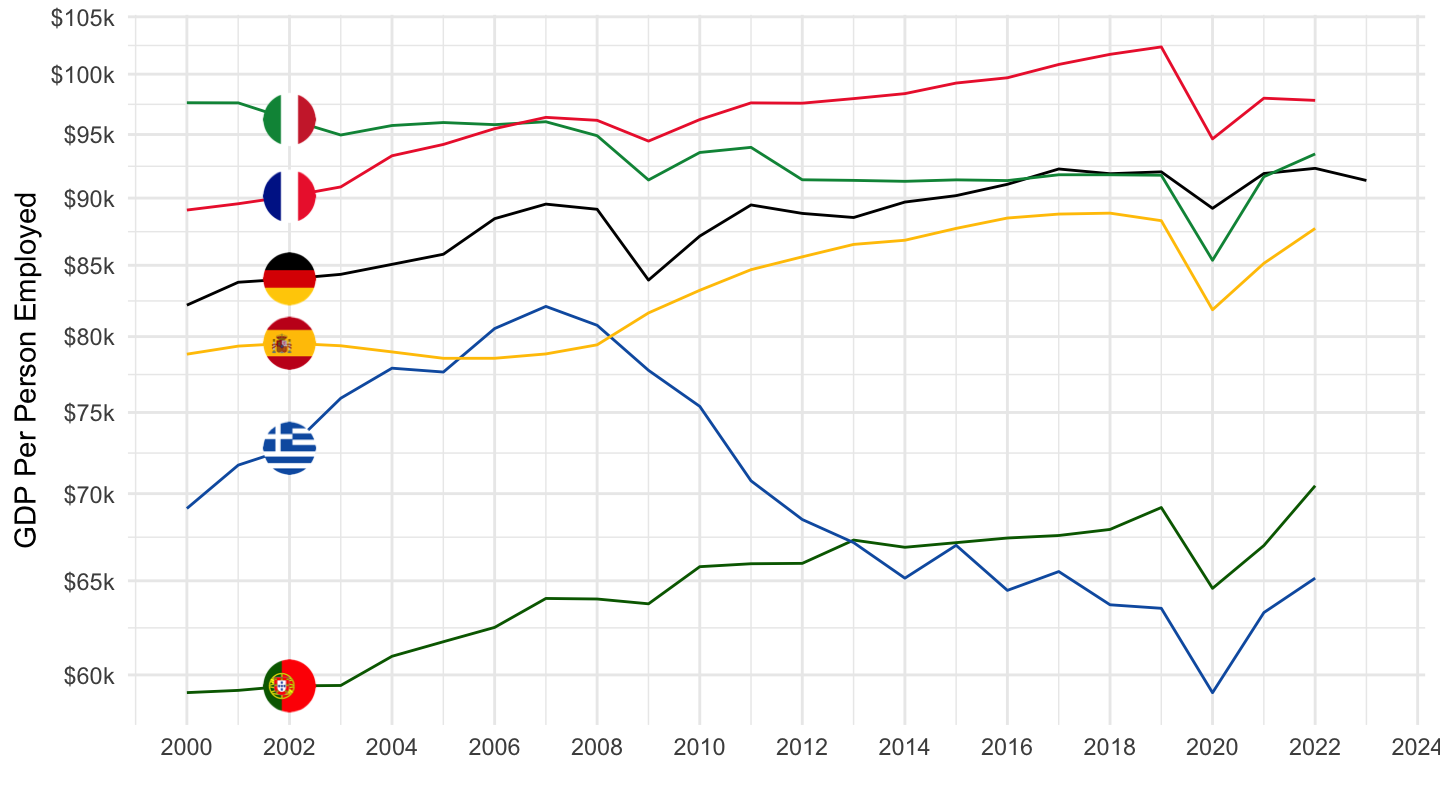
GDP Per head, Heterogeneity in EU
VPVOB = USD, constant prices, 2015 PPPs
Code
PDB_LV %>%
  filter(SUBJECT == "T_GDPPOP",
         MEASURE == "VPVOB",
         LOCATION %in% c("ITA", "DEU", "GRC", "ESP", "PRT", "FRA")) %>%
  year_to_date %>%
  filter(date >= as.Date("2000-01-01")) %>%
  left_join(PDB_LV_var$LOCATION, by = "LOCATION") %>%
  group_by(LOCATION) %>%
  arrange(date) %>%
  left_join(colors, by = c("Location" = "country")) %>%
  mutate(obsValue = obsValue/1000) %>%
  ggplot(.) + geom_line(aes(x = date, y = obsValue, color = color)) +
  theme_minimal() + xlab("") + ylab("") + scale_color_identity() +add_6flags +
  scale_x_date(breaks = seq(1960, 2100, 2) %>% paste0("-01-01") %>% as.Date,
               labels = date_format("%Y")) +
  theme(legend.position = c(0.25, 0.9),
        legend.title = element_blank(),
        legend.direction = "horizontal") +
  scale_y_log10(breaks = seq(0, 200, 5),
                labels = dollar_format(su = "k", acc = 1))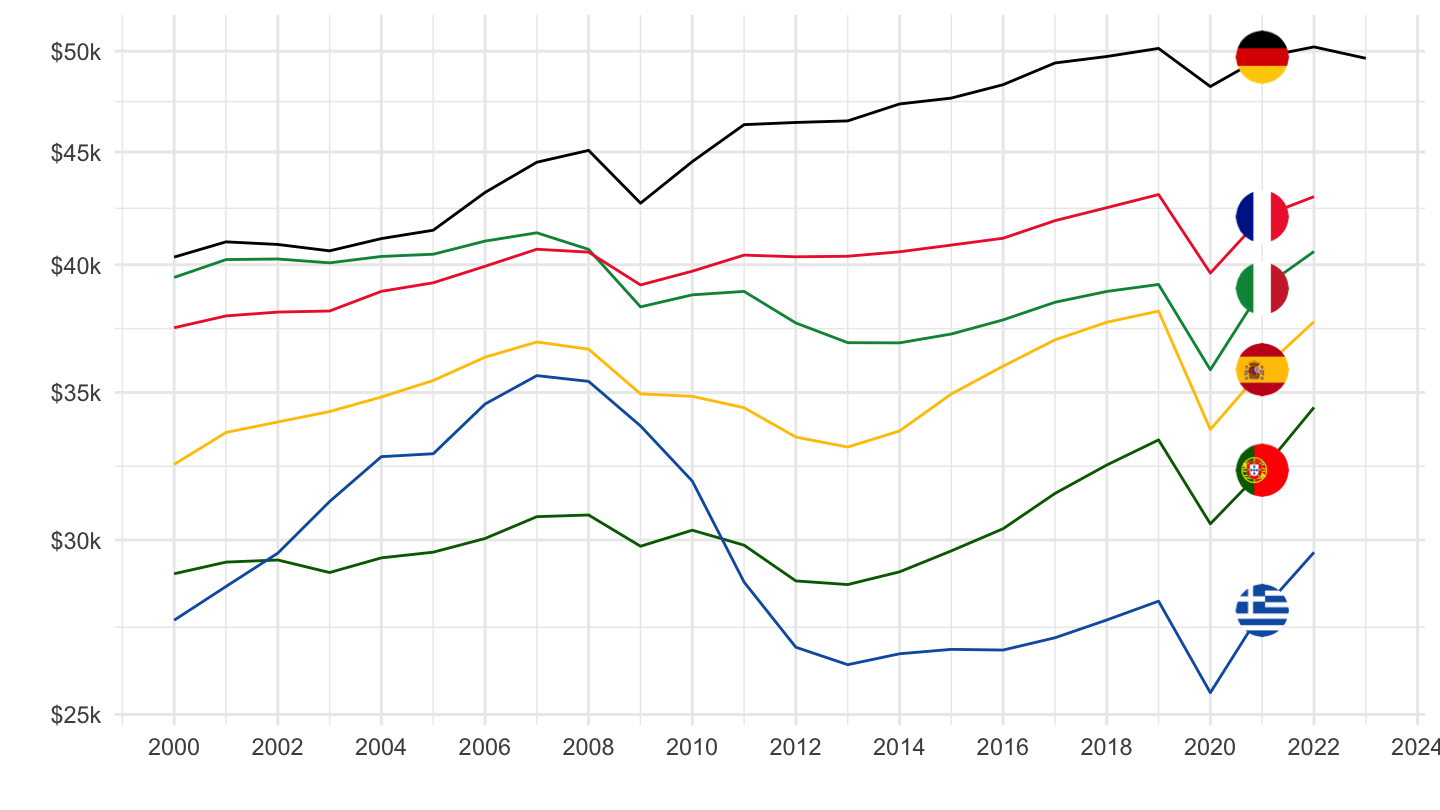
100
Code
PDB_LV %>%
  filter(SUBJECT == "T_GDPPOP",
         MEASURE == "VPVOB",
         LOCATION %in% c("ITA", "DEU", "GRC", "ESP", "PRT", "FRA")) %>%
  year_to_date %>%
  filter(date >= as.Date("2000-01-01")) %>%
  left_join(PDB_LV_var$LOCATION, by = "LOCATION") %>%
  group_by(LOCATION) %>%
  arrange(date) %>%
  mutate(obsValue = 100 * obsValue / obsValue[date == as.Date("2007-01-01")]) %>%
  left_join(colors, by = c("Location" = "country")) %>%
  ggplot(.) + geom_line(aes(x = date, y = obsValue, color = color)) +
  theme_minimal() + xlab("") + ylab("") + scale_color_identity() +add_6flags +
  scale_x_date(breaks = seq(1960, 2100, 2) %>% paste0("-01-01") %>% as.Date,
               labels = date_format("%Y")) +
  theme(legend.position = c(0.25, 0.9),
        legend.title = element_blank(),
        legend.direction = "horizontal") +
  scale_y_log10(breaks = seq(70, 200, 5))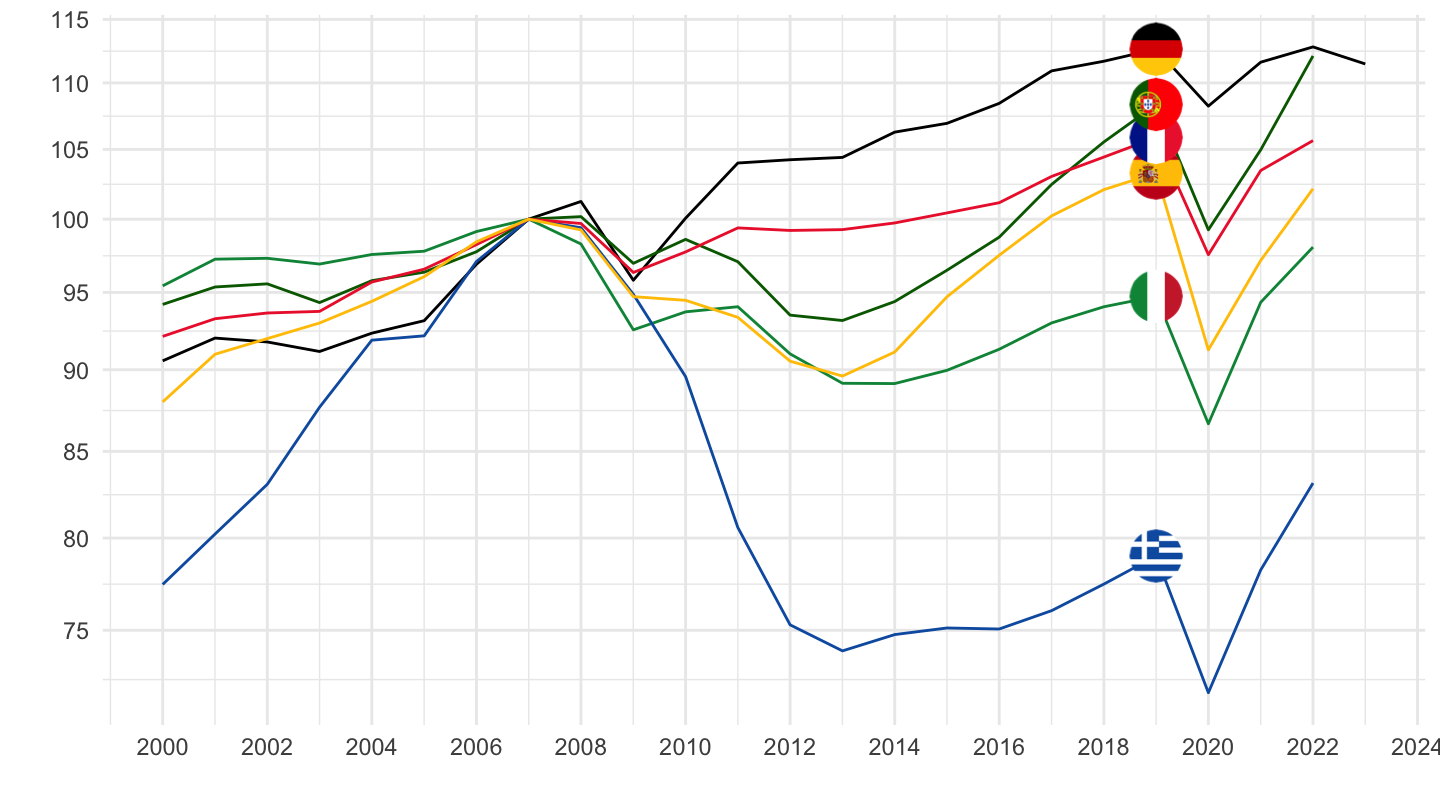
GDP per hour worked, Heterogeneity in EU
Norway, Germany, Greece, United States, United Kingdom, France
in $
Code
PDB_LV %>%
  filter(SUBJECT == "T_GDPHRS",
         MEASURE == "VPVOB",
         LOCATION %in% c("NOR", "DEU", "GRC", "USA", "GBR", "FRA")) %>%
  year_to_date %>%
  left_join(PDB_LV_var$LOCATION, by = "LOCATION") %>%
  group_by(LOCATION) %>%
  arrange(date) %>%
  left_join(colors, by = c("Location" = "country")) %>%
  ggplot(.) + geom_line(aes(x = date, y = obsValue, color = color)) +
  theme_minimal() + xlab("") + ylab("USD, constant prices, 2015 PPPs") + scale_color_identity() + add_6flags +
  scale_x_date(breaks = seq(1960, 2100, 5) %>% paste0("-01-01") %>% as.Date,
               labels = date_format("%Y")) +
  theme(legend.position = c(0.25, 0.9),
        legend.title = element_blank(),
        legend.direction = "horizontal") +
  scale_y_continuous(breaks = seq(0, 200, 5),
                labels = dollar_format(p = "$", su = "/h"))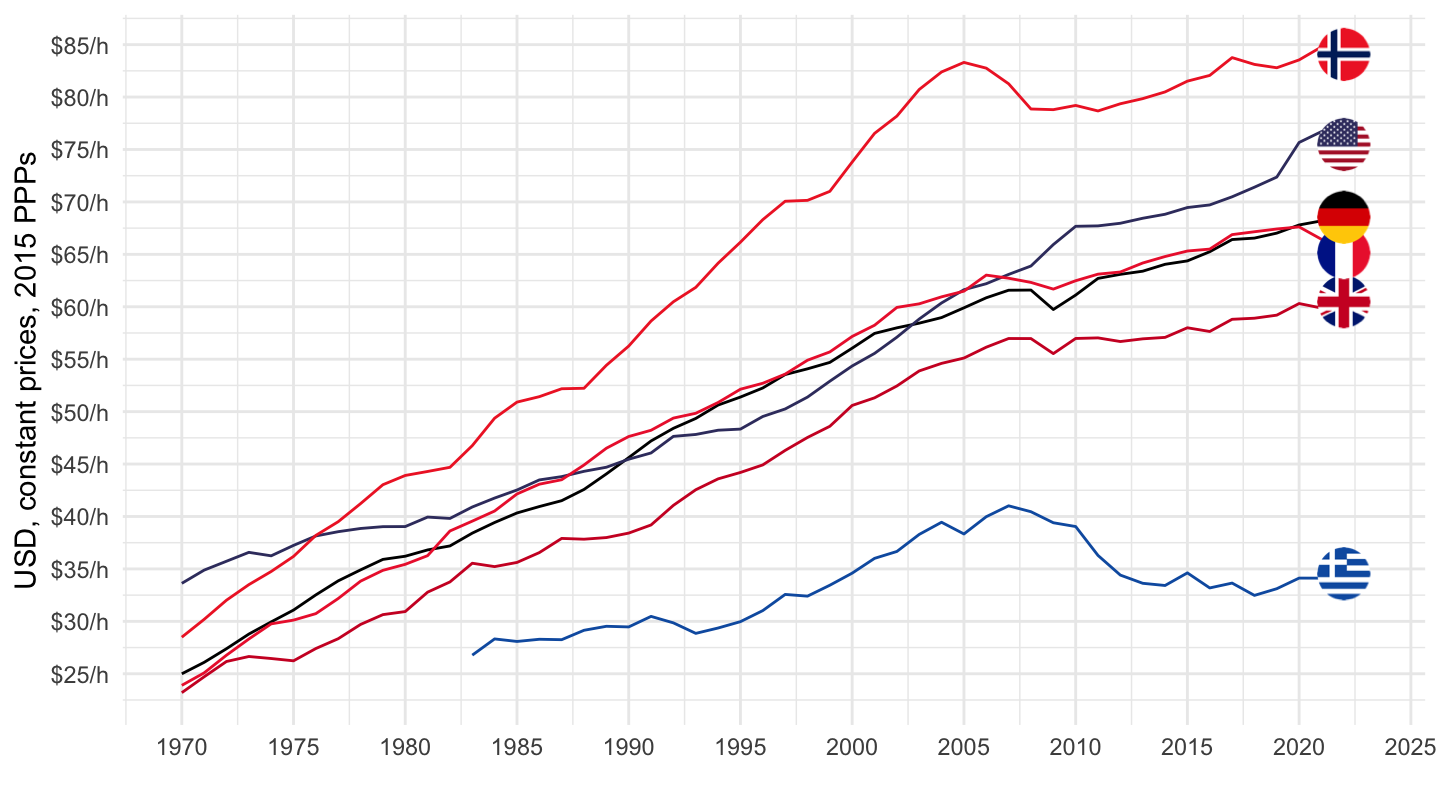
Set Countries
in $
Code
PDB_LV %>%
  filter(SUBJECT == "T_GDPHRS",
         MEASURE == "VPVOB",
         LOCATION %in% c("ITA", "DEU", "GRC", "ESP", "PRT", "FRA")) %>%
  year_to_date %>%
  left_join(PDB_LV_var$LOCATION, by = "LOCATION") %>%
  group_by(LOCATION) %>%
  arrange(date) %>%
  left_join(colors, by = c("Location" = "country")) %>%
  ggplot(.) + geom_line(aes(x = date, y = obsValue, color = color)) +
  theme_minimal() + xlab("") + ylab("USD, constant prices, 2015 PPPs") + scale_color_identity() +add_6flags +
  scale_x_date(breaks = seq(1960, 2100, 5) %>% paste0("-01-01") %>% as.Date,
               labels = date_format("%Y")) +
  theme(legend.position = c(0.25, 0.9),
        legend.title = element_blank(),
        legend.direction = "horizontal") +
  scale_y_continuous(breaks = seq(0, 200, 5),
                labels = dollar_format(p = "$", su = "/h"))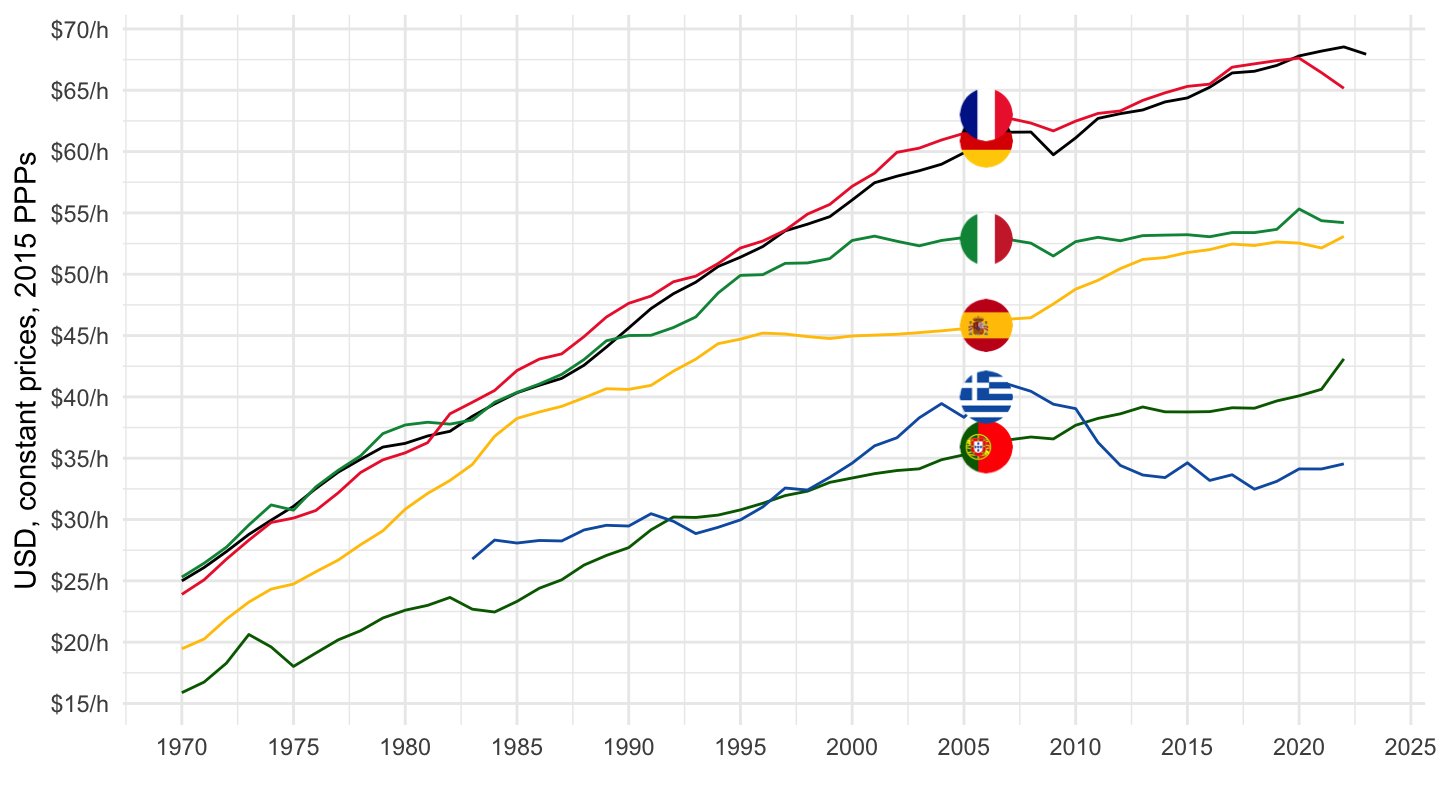
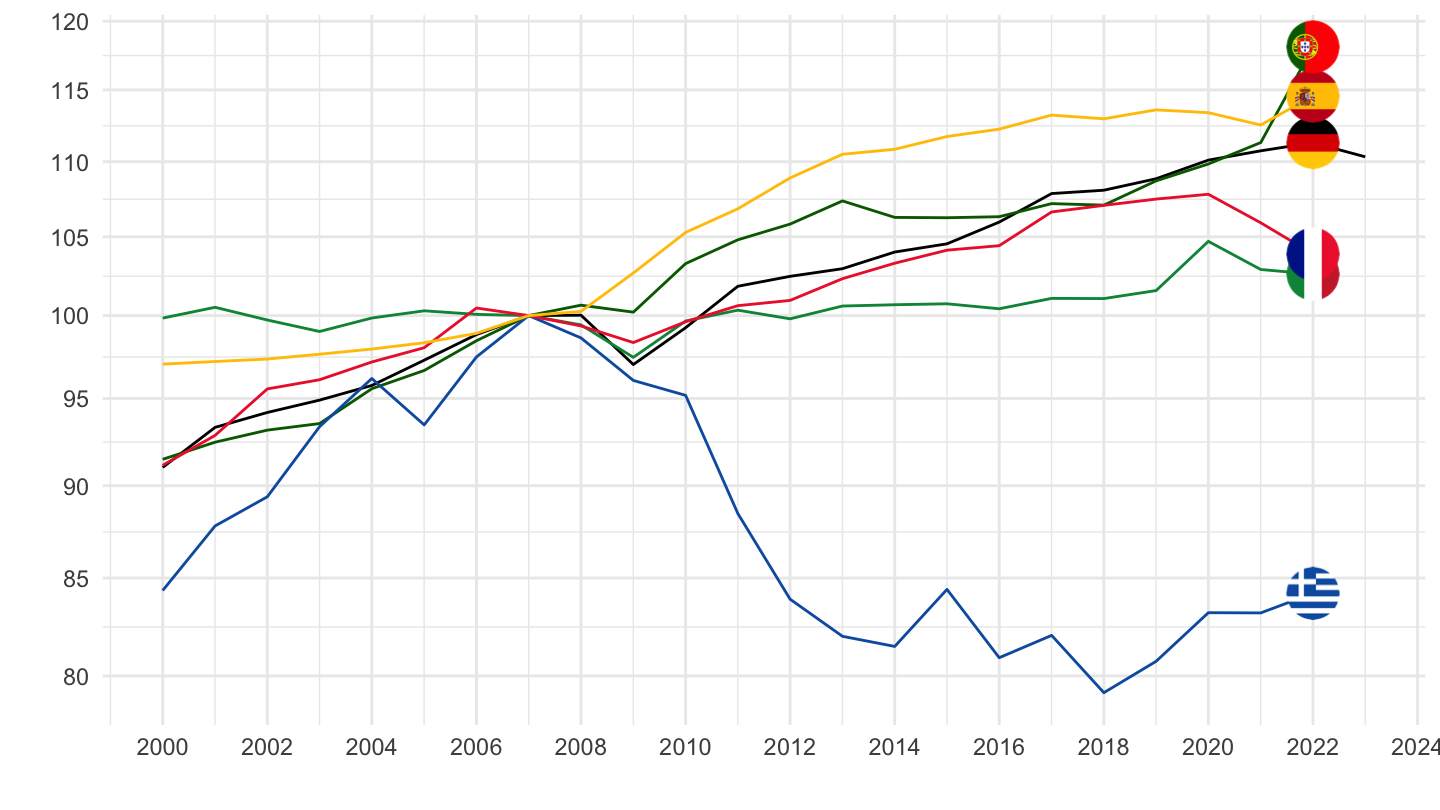
Base 100 = 2007
Code
PDB_LV %>%
  filter(SUBJECT == "T_GDPHRS",
         MEASURE == "VPVOB",
         LOCATION %in% c("ITA", "DEU", "GRC", "ESP", "PRT", "FRA")) %>%
  year_to_date %>%
  filter(date >= as.Date("2000-01-01")) %>%
  left_join(PDB_LV_var$LOCATION, by = "LOCATION") %>%
  group_by(LOCATION) %>%
  arrange(date) %>%
  mutate(obsValue = 100 * obsValue / obsValue[date == as.Date("2007-01-01")]) %>%
  left_join(colors, by = c("Location" = "country")) %>%
  ggplot(.) + geom_line(aes(x = date, y = obsValue, color = color)) +
  theme_minimal() + xlab("") + ylab("") + scale_color_identity() +add_6flags +
  scale_x_date(breaks = seq(1960, 2100, 2) %>% paste0("-01-01") %>% as.Date,
               labels = date_format("%Y")) +
  theme(legend.position = c(0.25, 0.9),
        legend.title = element_blank(),
        legend.direction = "horizontal") +
  scale_y_log10(breaks = seq(70, 200, 5))