Productivity by industry (ISIC Rev.4) - PDBI_I4
Data - OECD
Info
Data on productivity
LAST_COMPILE
| LAST_COMPILE |
|---|
| 2026-07-24 |
Last
| obsTime | Nobs |
|---|---|
| 2022 | 7524 |
| 2021 | 10174 |
| 2020 | 10571 |
SUBJECT
Code
PDBI_I4 %>%
  left_join(PDBI_I4_var$SUBJECT, by = "SUBJECT") %>%
  group_by(SUBJECT, Subject) %>%
  summarise(nobs = n()) %>%
  arrange(-nobs) %>%
print_table_conditional()| SUBJECT | Subject | nobs |
|---|---|---|
| I4_ANA_GVA | Gross value added, constant prices | 42756 |
| I4_ANA_EMPTO | Total employment (number of persons employed) | 32233 |
| I4_ANA_GVAEMP | Gross value added per person employed, constant prices | 32233 |
| I4_ANA_LCEMP | Labour compensation per employee | 30260 |
| I4_ANA_ULCE | Unit Labour Costs, employment based | 30260 |
| I4_ANA_GVAHRS | Gross value added per hour worked, constant prices | 28809 |
| I4_ANA_HRSAV | Average hours worked per person employed | 28809 |
| I4_ANA_HRSTO | Total hours worked | 28809 |
| I4_ANA_LCHRS | Labour compensation per hour worked | 28797 |
| I4_ANA_ULCH | Unit Labour Costs | 27483 |
| I4_ANA_CONILPEMP | Industry contribution to business sector labour productivity; employment based | 12338 |
| I4_ANA_CONILPHRS | Industry contribution to business sector labour productivity | 11166 |
MEASURE
Code
PDBI_I4 %>%
  left_join(PDBI_I4_var$MEASURE, by = "MEASURE") %>%
  group_by(MEASURE, Measure) %>%
  summarise(nobs = n()) %>%
  arrange(-nobs) %>%
print_table_conditional()| MEASURE | Measure | nobs |
|---|---|---|
| 2015Y | Index | 157565 |
| GRW | Annual growth/change | 152884 |
| PPT | Annual industry contribution, percentage points | 23504 |
ACTIVITY
Code
PDBI_I4 %>%
  left_join(PDBI_I4_var$ACTIVITY, by = "ACTIVITY") %>%
  group_by(ACTIVITY, Activity) %>%
  summarise(nobs = n()) %>%
  arrange(-nobs) %>%
print_table_conditional()| ACTIVITY | Activity | nobs |
|---|---|---|
| A_U | Total | 30207 |
| B_E | Industry including energy | 27995 |
| F | Construction | 27995 |
| G_I | Wholesale retail trade accommodation food services, transportation and storage | 27969 |
| J | Information and communication | 27918 |
| K | Financial and insurance activities | 27840 |
| C | Manufacturing | 27797 |
| BNEXCL | Non-agriculture business sector excluding real estate | 27687 |
| GNEXCL | Business sector services excluding real estate | 27671 |
| MN | Professional, scientific and technical activities, Administrative and support service activities | 27630 |
| BDE | Mining and utilities | 27626 |
| A | Agriculture, forestry and fishing | 25618 |
LOCATION
Code
PDBI_I4 %>%
  left_join(PDBI_I4_var$LOCATION, by = "LOCATION") %>%
  group_by(LOCATION, Location) %>%
  summarise(Nobs = n()) %>%
  arrange(-Nobs) %>%
  mutate(Flag = gsub(" ", "-", str_to_lower(gsub(" ", "-", Location))),
         Flag = paste0('<img src="../../icon/flag/vsmall/', Flag, '.png" alt="Flag">')) %>%
  select(Flag, everything()) %>%
  {if (is_html_output()) datatable(., filter = 'top', rownames = F, escape = F) else .}
Unit Labour Costs
Table
Code
PDBI_I4 %>%
  left_join(PDBI_I4_var$LOCATION, by = "LOCATION") %>%
  filter(SUBJECT == "I4_ANA_ULCH",
         ACTIVITY == "A_U") %>%
  year_to_date() %>%
  group_by(LOCATION, Location) %>%
  summarise(Nobs = n(),
            date1 = first(date),
            date2 = last(date)) %>%
  arrange(-Nobs) %>%
  mutate(Flag = gsub(" ", "-", str_to_lower(gsub(" ", "-", Location))),
         Flag = paste0('<img src="../../icon/flag/vsmall/', Flag, '.png" alt="Flag">')) %>%
  select(Flag, everything()) %>%
  {if (is_html_output()) datatable(., filter = 'top', rownames = F, escape = F) else .}
France, Germany
All
Code
PDBI_I4 %>%
  filter(SUBJECT == "I4_ANA_ULCH", # I4_ANA_ULCH: Unit Labour Costs
         MEASURE == "2015Y", # 2010Y: Index
         ACTIVITY == "A_U",
         LOCATION %in% c("FRA", "DEU", "ITA")) %>%
  left_join(PDBI_I4_var$LOCATION, by = "LOCATION") %>%
  left_join(colors, by = c("Location" = "country")) %>%
  year_to_date %>%
  arrange(Location) %>%
  ggplot(.) + geom_line(aes(x = date, y = obsValue, color = color)) +
  scale_color_identity() + add_3flags + theme_minimal() +
  scale_x_date(breaks = seq(1920, 2100, 5) %>% paste0("-01-01") %>% as.Date,
               labels = date_format("%Y")) +
  scale_y_log10(breaks = seq(0, 200, 10)) +
  ylab("Unit Labour Costs") + xlab("")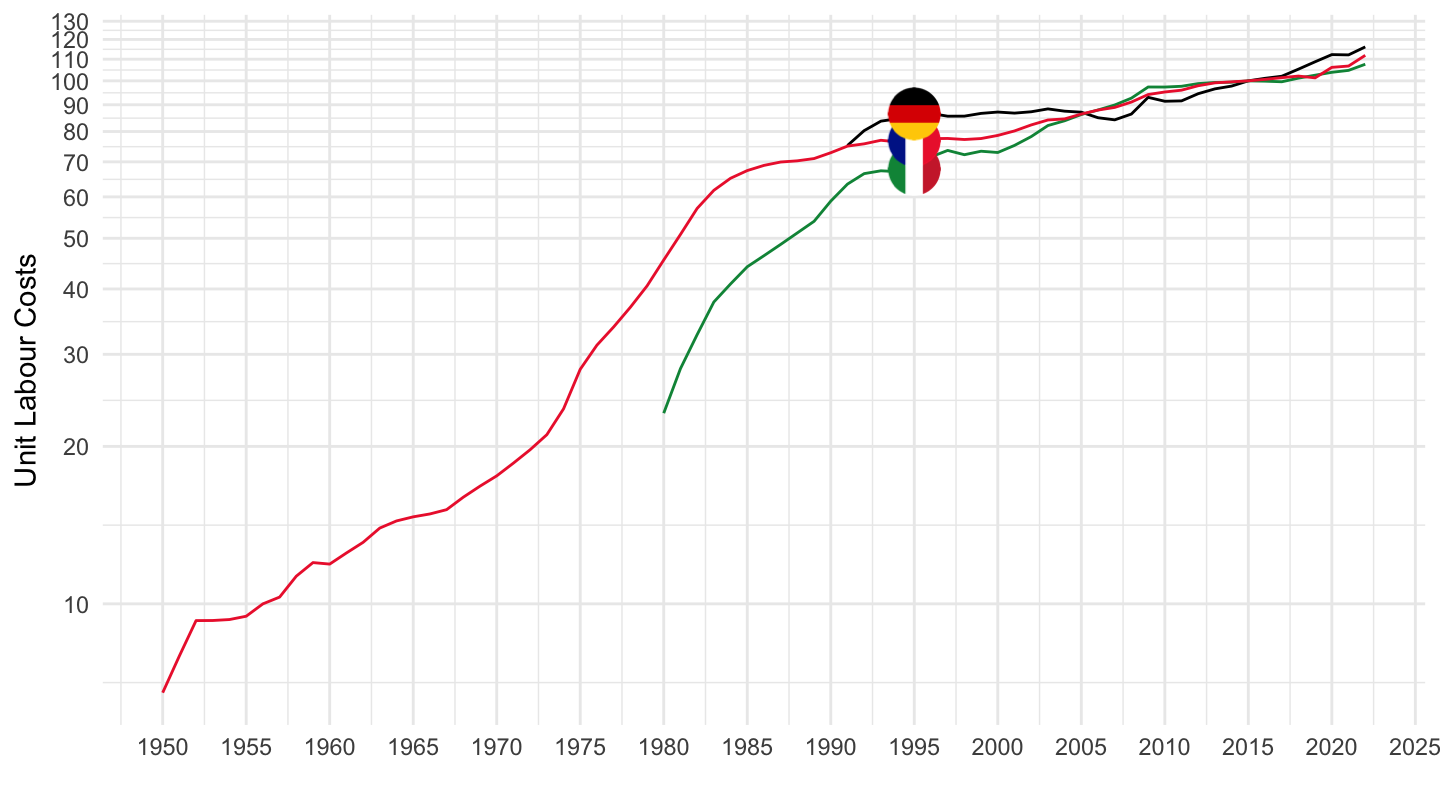
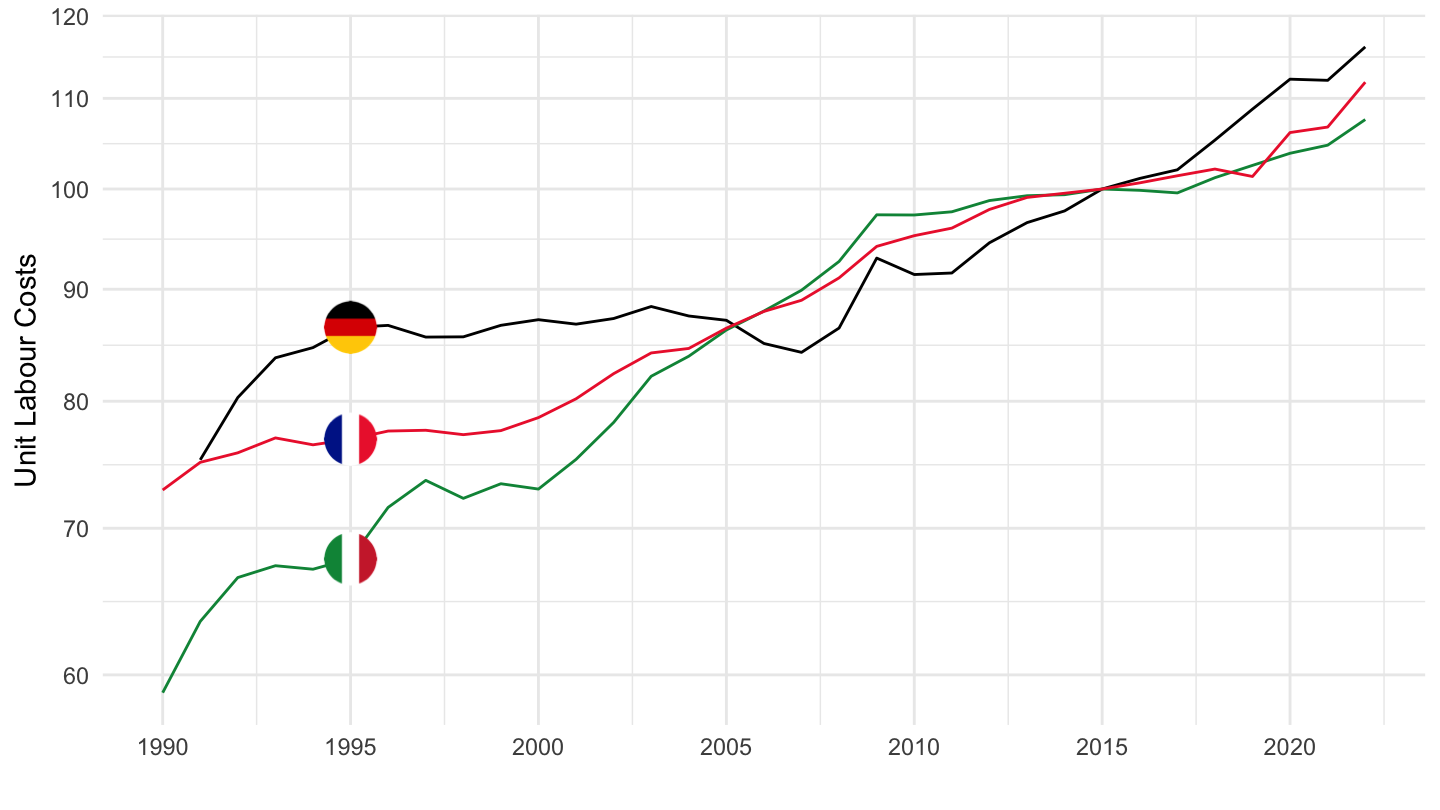
1990-
Code
PDBI_I4 %>%
  filter(SUBJECT == "I4_ANA_ULCH", # I4_ANA_ULCH: Unit Labour Costs
         MEASURE == "2015Y", # 2010Y: Index
         ACTIVITY == "A_U",
         LOCATION %in% c("FRA", "DEU", "ITA")) %>%
  left_join(PDBI_I4_var$LOCATION, by = "LOCATION") %>%
  left_join(colors, by = c("Location" = "country")) %>%
  year_to_date %>%
  filter(year(date) >= 1990) %>%
  arrange(Location) %>%
  ggplot(.) + geom_line(aes(x = date, y = obsValue, color = color)) +
  scale_color_identity() + add_3flags + theme_minimal() +
  scale_x_date(breaks = seq(1920, 2100, 5) %>% paste0("-01-01") %>% as.Date,
               labels = date_format("%Y")) +
  scale_y_log10(breaks = seq(0, 200, 10)) +
  ylab("Unit Labour Costs") + xlab("")