Economic Outlook No 114 - November 2023

Data - OECD

Code
source("../../code/R-markdown/init_oecd.R")
The following packages are a base install and will not be unloaded:

The following packages were not previously loaded:

Le chargement a nécessité le package : tidyverse
── Attaching core tidyverse packages ──────────────────────── tidyverse 2.0.0 ──
✔ dplyr     1.1.4     ✔ readr     2.1.5
✔ forcats   1.0.0     ✔ stringr   1.5.1
✔ ggplot2   3.5.2     ✔ tibble    3.3.0
✔ lubridate 1.9.4     ✔ tidyr     1.3.1
✔ purrr     1.1.0     
── Conflicts ────────────────────────────────────────── tidyverse_conflicts() ──
✖ dplyr::filter() masks stats::filter()
✖ dplyr::lag()    masks stats::lag()
ℹ Use the conflicted package (<http://conflicted.r-lib.org/>) to force all conflicts to become errors
Le chargement a nécessité le package : RPostgres

Le chargement a nécessité le package : scales


Attachement du package : 'scales'


L'objet suivant est masqué depuis 'package:purrr':

    discard


L'objet suivant est masqué depuis 'package:readr':

    col_factor


Le chargement a nécessité le package : knitr

Le chargement a nécessité le package : kableExtra


Attachement du package : 'kableExtra'


L'objet suivant est masqué depuis 'package:dplyr':

    group_rows


Le chargement a nécessité le package : DT

Le chargement a nécessité le package : viridis

Le chargement a nécessité le package : viridisLite


Attachement du package : 'viridis'


L'objet suivant est masqué depuis 'package:scales':

    viridis_pal


Le chargement a nécessité le package : ggrepel

Le chargement a nécessité le package : rsdmx

Le chargement a nécessité le package : mFilter

Le chargement a nécessité le package : OECD

Le chargement a nécessité le package : stargazer


Please cite as: 


 Hlavac, Marek (2022). stargazer: Well-Formatted Regression and Summary Statistics Tables.

 R package version 5.2.3. https://CRAN.R-project.org/package=stargazer 


Le chargement a nécessité le package : choroplethr

Le chargement a nécessité le package : choroplethrMaps

Le chargement a nécessité le package : pander

Le chargement a nécessité le package : AER

Le chargement a nécessité le package : car

Le chargement a nécessité le package : carData


Attachement du package : 'car'


L'objet suivant est masqué depuis 'package:dplyr':

    recode


L'objet suivant est masqué depuis 'package:purrr':

    some


Le chargement a nécessité le package : lmtest

Le chargement a nécessité le package : zoo


Attachement du package : 'zoo'


Les objets suivants sont masqués depuis 'package:base':

    as.Date, as.Date.numeric


Le chargement a nécessité le package : sandwich

Le chargement a nécessité le package : survival

Le chargement a nécessité le package : latex2exp

Le chargement a nécessité le package : pracma


Attachement du package : 'pracma'


L'objet suivant est masqué depuis 'package:car':

    logit


L'objet suivant est masqué depuis 'package:purrr':

    cross


Le chargement a nécessité le package : ggimage
Code
load_data("oecd/EO110_INTERNET.RData")
load_data("oecd/EO111_INTERNET.RData")
load_data("oecd/EO112_INTERNET.RData")
load_data("oecd/EO113_INTERNET.RData")
load_data("oecd/EO114_INTERNET.RData")
load_data("oecd/EO114_INTERNET_var2.RData")
load_data("us/nber_recessions.RData")
Info

source dataset .html .RData
oecd EO 2024-06-01 2025-09-29
oecd EO114_INTERNET 2025-08-25 2023-12-08

LAST_DOWNLOAD

source dataset .html .RData
oecd EO 2024-06-01 2025-09-29
oecd EO108_INTERNET 2024-04-16 2020-12-05
oecd EO109_INTERNET 2024-04-16 2023-03-18
oecd EO110_INTERNET 2024-04-16 2023-03-18
oecd EO111_INTERNET 2025-09-29 2023-03-18
oecd EO112_INTERNET 2024-04-16 2023-03-18
oecd EO113_INTERNET 2024-04-16 2023-06-07
oecd EO114_INTERNET 2025-08-25 2023-12-08

LAST_COMPILE

LAST_COMPILE
2025-09-29

Last

obsTime Nobs
2025-Q4 4047

VARIABLE

Code
EO114_INTERNET %>%
  left_join(EO114_INTERNET_var$VARIABLE, by = "VARIABLE") %>%
  mutate(Variable = Variable %>% substr(., 1, 120)) %>%
  group_by(VARIABLE, Variable) %>%
  summarise(Nobs = n()) %>%
  arrange(-Nobs) %>%
  {if (is_html_output()) datatable(., filter = 'top', rownames = F) else .}

FREQUENCY

Code
EO114_INTERNET %>%
  left_join(EO114_INTERNET_var$FREQUENCY, by = "FREQUENCY") %>%
  group_by(FREQUENCY, Frequency) %>%
  summarise(Nobs = n()) %>%
  arrange(-Nobs) %>%
  {if (is_html_output()) print_table(.) else .}
FREQUENCY Frequency Nobs
Q Quarterly 812205
A Annual 406678

Vintages

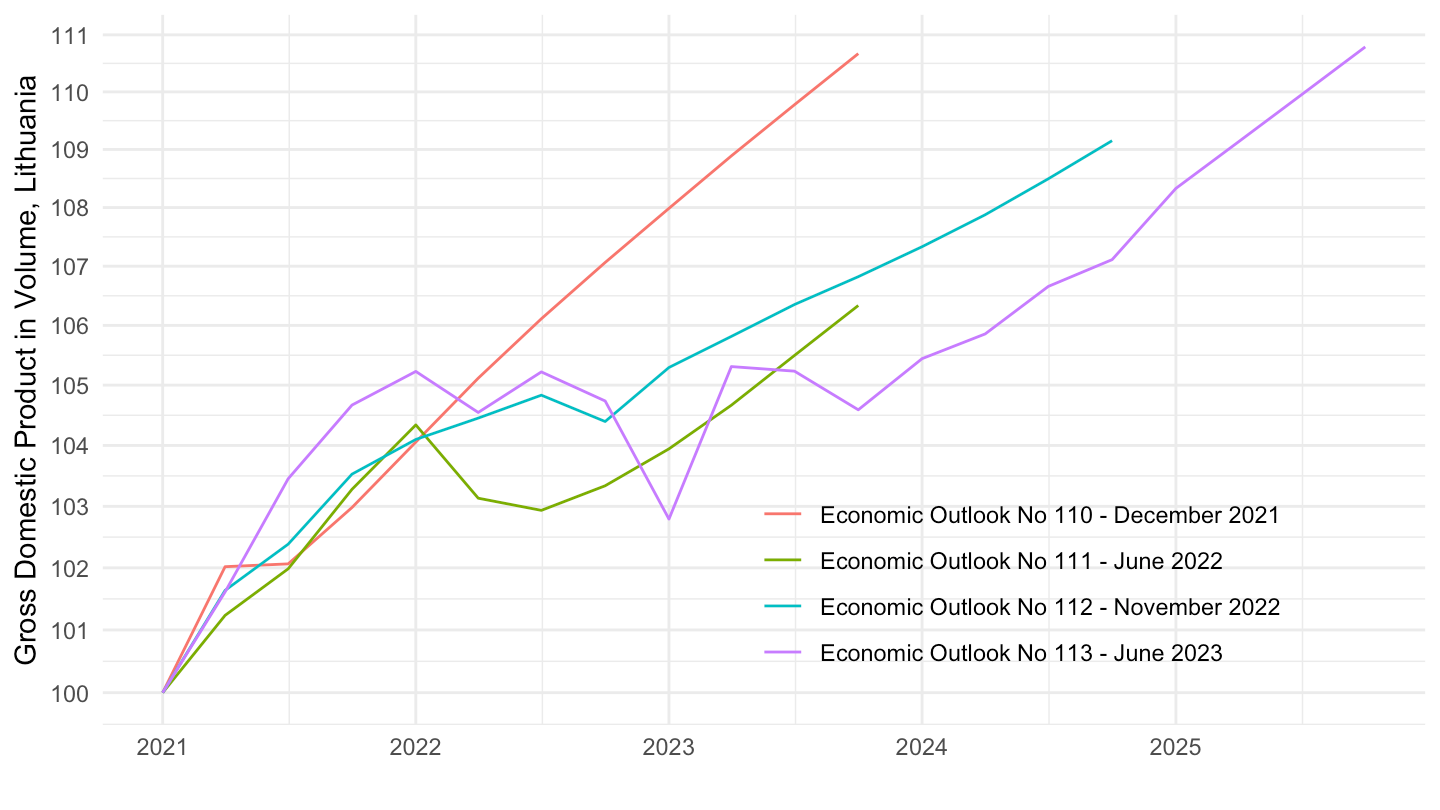
Lithuania

Code
EO110_INTERNET %>%
  mutate(vintage = "Economic Outlook No 110 - December 2021") %>%
  bind_rows(EO111_INTERNET %>%
              mutate(vintage = "Economic Outlook No 111 - June 2022")) %>%
  bind_rows(EO112_INTERNET %>%
              mutate(vintage = "Economic Outlook No 112 - November 2022")) %>%
  bind_rows(EO114_INTERNET %>%
              mutate(vintage = "Economic Outlook No 113 - June 2023")) %>%
  filter(VARIABLE == "GDPV", 
         LOCATION == "LTU",
         FREQUENCY == "Q") %>%
  quarter_to_date() %>%
  filter(date >= as.Date("2021-01-01")) %>%
  group_by(vintage) %>%
  mutate(obsValue = 100*obsValue/obsValue[date == as.Date("2021-01-01")]) %>%
  ggplot + geom_line(aes(x = date, y = obsValue, color = vintage)) +
  xlab("") + ylab("Gross Domestic Product in Volume, Lithuania") + theme_minimal() +
  scale_x_date(breaks = seq(1920, 2100, 1) %>% paste0("-01-01") %>% as.Date,
               labels = date_format("%Y")) +
  theme(legend.position = c(0.7, 0.2),
        legend.title = element_blank()) +
  scale_y_log10(breaks = seq(20, 200, 1))

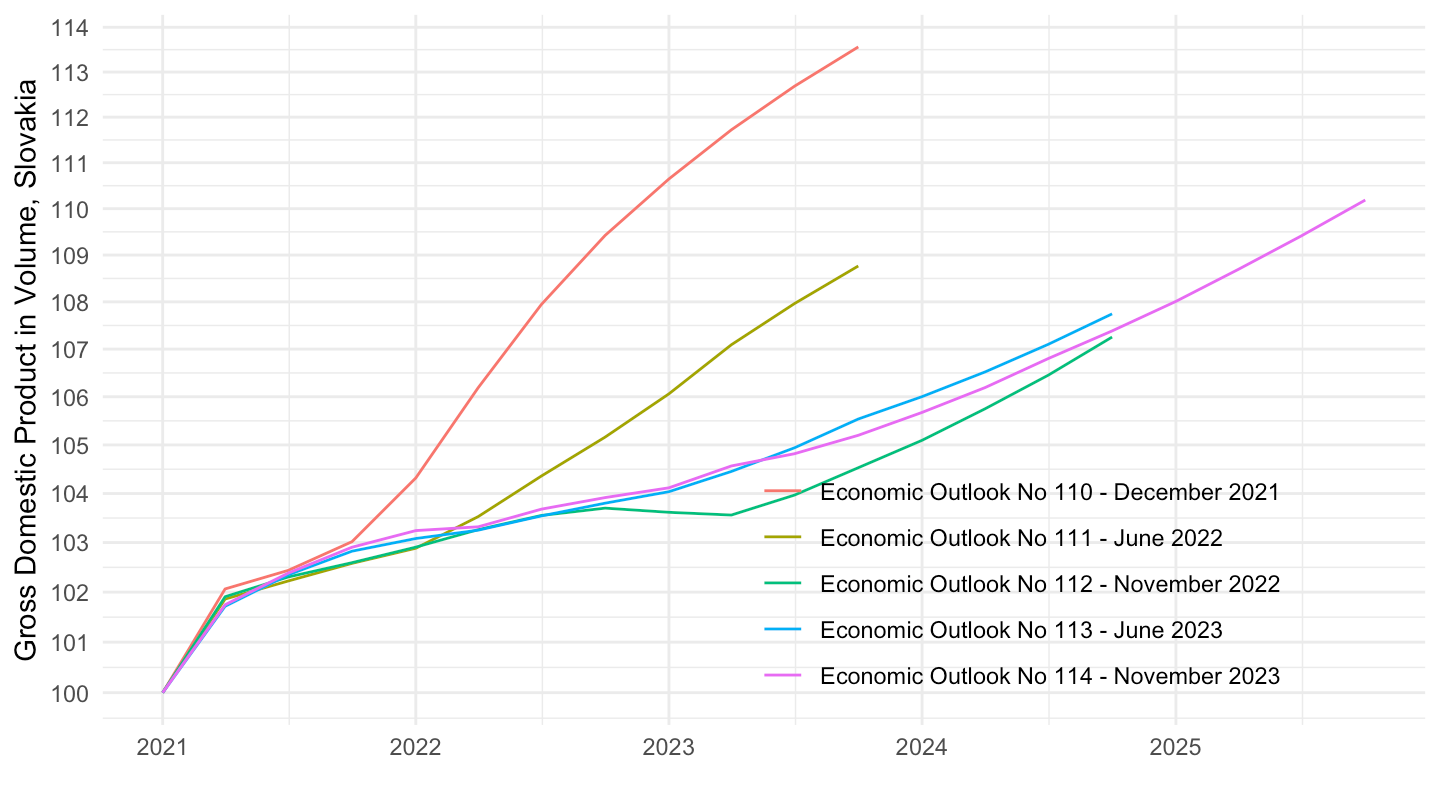
Slovakia

Code
EO110_INTERNET %>%
  mutate(vintage = "Economic Outlook No 110 - December 2021") %>%
  bind_rows(EO111_INTERNET %>%
              mutate(vintage = "Economic Outlook No 111 - June 2022")) %>%
  bind_rows(EO112_INTERNET %>%
              mutate(vintage = "Economic Outlook No 112 - November 2022")) %>%
  bind_rows(EO113_INTERNET %>%
              mutate(vintage = "Economic Outlook No 113 - June 2023")) %>%
  bind_rows(EO114_INTERNET %>%
              mutate(vintage = "Economic Outlook No 114 - November 2023")) %>%
  filter(VARIABLE == "GDPV", 
         LOCATION == "SVK",
         FREQUENCY == "Q") %>%
  quarter_to_date() %>%
  filter(date >= as.Date("2021-01-01")) %>%
  group_by(vintage) %>%
  mutate(obsValue = 100*obsValue/obsValue[date == as.Date("2021-01-01")]) %>%
  ggplot + geom_line(aes(x = date, y = obsValue, color = vintage)) +
  xlab("") + ylab("Gross Domestic Product in Volume, Slovakia") + theme_minimal() +
  scale_x_date(breaks = seq(1920, 2100, 1) %>% paste0("-01-01") %>% as.Date,
               labels = date_format("%Y")) +
  theme(legend.position = c(0.7, 0.2),
        legend.title = element_blank()) +
  scale_y_log10(breaks = seq(20, 200, 1))

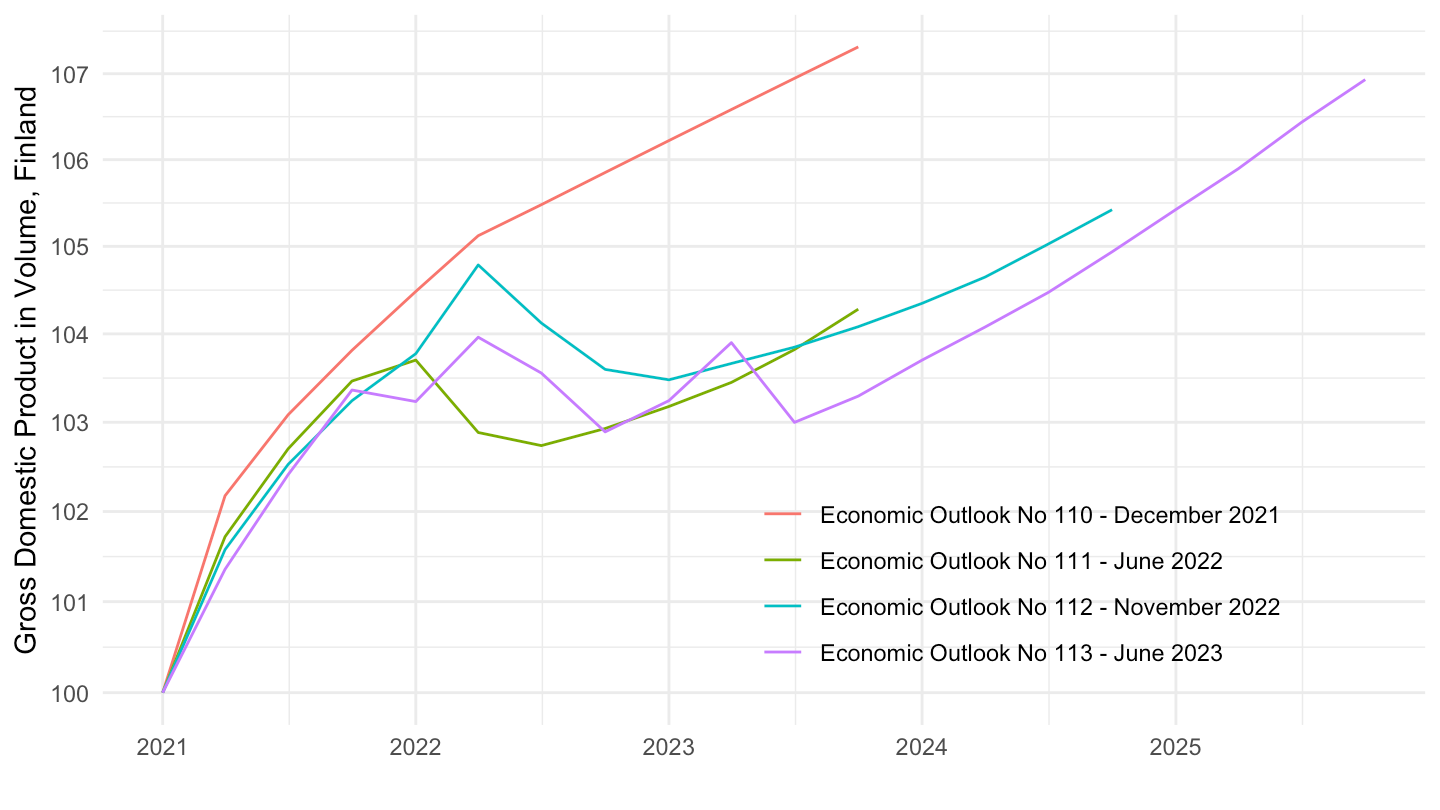
Finland

Code
EO110_INTERNET %>%
  mutate(vintage = "Economic Outlook No 110 - December 2021") %>%
  bind_rows(EO111_INTERNET %>%
              mutate(vintage = "Economic Outlook No 111 - June 2022")) %>%
  bind_rows(EO112_INTERNET %>%
              mutate(vintage = "Economic Outlook No 112 - November 2022")) %>%
  bind_rows(EO114_INTERNET %>%
              mutate(vintage = "Economic Outlook No 113 - June 2023")) %>%
  filter(VARIABLE == "GDPV", 
         LOCATION == "FIN",
         FREQUENCY == "Q") %>%
  quarter_to_date() %>%
  filter(date >= as.Date("2021-01-01")) %>%
  group_by(vintage) %>%
  mutate(obsValue = 100*obsValue/obsValue[date == as.Date("2021-01-01")]) %>%
  ggplot + geom_line(aes(x = date, y = obsValue, color = vintage)) +
  xlab("") + ylab("Gross Domestic Product in Volume, Finland") + theme_minimal() +
  scale_x_date(breaks = seq(1920, 2100, 1) %>% paste0("-01-01") %>% as.Date,
               labels = date_format("%Y")) +
  theme(legend.position = c(0.7, 0.2),
        legend.title = element_blank()) +
  scale_y_log10(breaks = seq(20, 200, 1))

Germany - Vintages

SubList

Code
EO114_INTERNET %>%
              mutate(vintage = "EO No 113 - June 2023") %>%
  bind_rows(EO110_INTERNET %>%
              mutate(vintage = "EO No 110 - December 2021")) %>%
  filter(LOCATION == "DEU",
         obsTime == "2023-Q1",
         VARIABLE %in% c("GDPV", "ITV", "CPV", "CGV", "MGSV", "XGSV"),
         FREQUENCY == "Q") %>%
  left_join(EO114_INTERNET_var$VARIABLE, by = "VARIABLE") %>%
  select(VARIABLE, Variable, UNIT, vintage, obsValue) %>%
  spread(vintage, obsValue) %>%
  mutate(`Change (%)` = round(100*(`EO No 113 - June 2023`/`EO No 110 - December 2021`-1), 2)) %>%
  print_table_conditional()
VARIABLE Variable UNIT EO No 110 - December 2021 EO No 113 - June 2023 Change (%)
CGV Government final consumption expenditure, volume EUR 7.079714e+11 6.923404e+11 -2.21
CPV Private final consumption expenditure, volume EUR 1.764611e+12 1.692254e+12 -4.10
GDPV Gross domestic product, volume, market prices EUR 3.360288e+12 3.263130e+12 -2.89
ITV Gross fixed capital formation, total, volume EUR 7.141888e+11 6.638904e+11 -7.04
MGSV Imports of goods and services, volume (national accounts basis) EUR 1.476323e+12 1.474305e+12 -0.14
XGSV Exports of goods and services, volume (national accounts basis) EUR 1.634885e+12 1.638713e+12 0.23

List

Code
EO114_INTERNET %>%
              mutate(vintage = "EO No 113 - June 2023") %>%
  bind_rows(EO110_INTERNET %>%
              mutate(vintage = "EO No 110 - December 2021")) %>%
  filter(LOCATION == "DEU",
         obsTime == "2023-Q1",
         FREQUENCY == "Q") %>%
  left_join(EO114_INTERNET_var$VARIABLE, by = "VARIABLE") %>%
  select(VARIABLE, Variable, UNIT, vintage, obsValue) %>%
  spread(vintage, obsValue) %>%
  mutate(`Change (%)` = round(100*(`EO No 113 - June 2023`/`EO No 110 - December 2021`-1), 2)) %>%
  print_table_conditional()

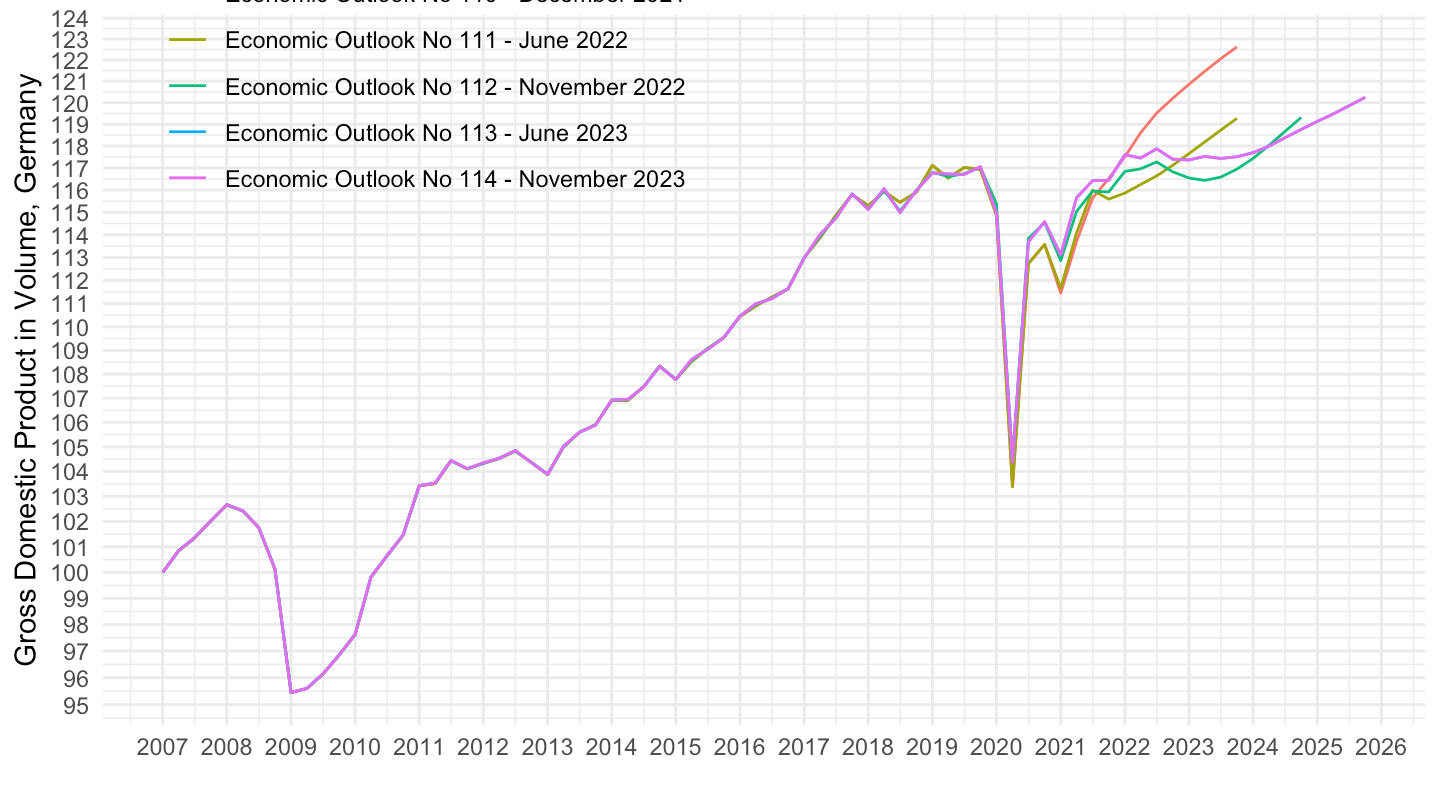
GDP in Volume

Since 2014Q1

Code
EO110_INTERNET %>%
  mutate(vintage = "Economic Outlook No 110 - December 2021") %>%
  bind_rows(EO111_INTERNET %>%
              mutate(vintage = "Economic Outlook No 111 - June 2022")) %>%
  bind_rows(EO112_INTERNET %>%
              mutate(vintage = "Economic Outlook No 112 - November 2022")) %>%
  bind_rows(EO114_INTERNET %>%
              mutate(vintage = "Economic Outlook No 113 - June 2023")) %>%
  bind_rows(EO114_INTERNET %>%
              mutate(vintage = "Economic Outlook No 114 - November 2023")) %>%
  filter(VARIABLE == "GDPV", 
         LOCATION == "DEU",
         FREQUENCY == "Q") %>%
  quarter_to_date() %>%
  filter(date >= as.Date("2007-01-01")) %>%
  group_by(vintage) %>%
  mutate(obsValue = 100*obsValue/obsValue[date == as.Date("2007-01-01")]) %>%
  ggplot + geom_line(aes(x = date, y = obsValue, color = vintage)) +
  xlab("") + ylab("Gross Domestic Product in Volume, Germany") + theme_minimal() +
  scale_x_date(breaks = seq(1920, 2100, 1) %>% paste0("-01-01") %>% as.Date,
               labels = date_format("%Y")) +
  theme(legend.position = c(0.25, 0.9),
        legend.title = element_blank()) +
  scale_y_log10(breaks = seq(20, 200, 1))

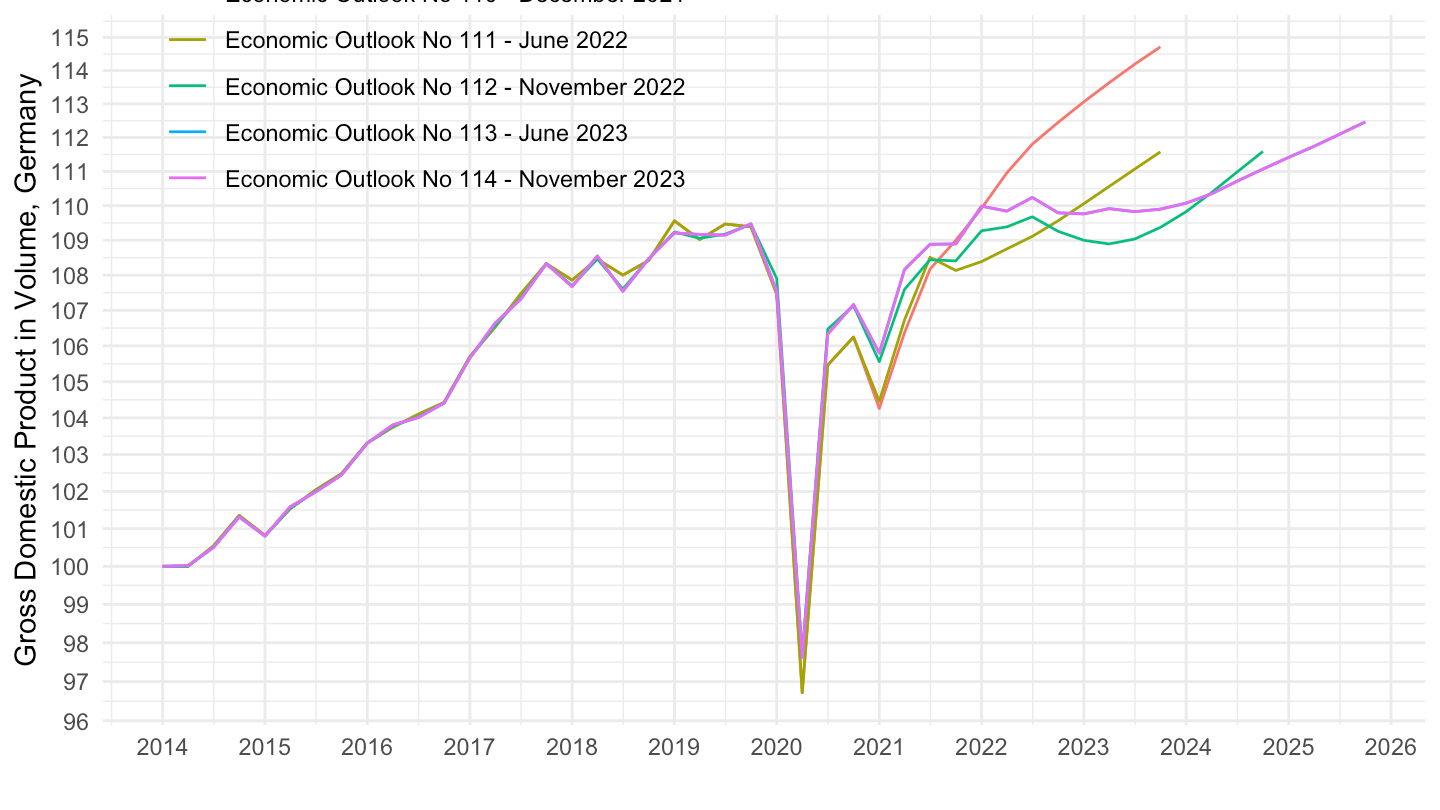
Since 2014Q1

Code
EO110_INTERNET %>%
  mutate(vintage = "Economic Outlook No 110 - December 2021") %>%
  bind_rows(EO111_INTERNET %>%
              mutate(vintage = "Economic Outlook No 111 - June 2022")) %>%
  bind_rows(EO112_INTERNET %>%
              mutate(vintage = "Economic Outlook No 112 - November 2022")) %>%
  bind_rows(EO114_INTERNET %>%
              mutate(vintage = "Economic Outlook No 113 - June 2023")) %>%
  bind_rows(EO114_INTERNET %>%
              mutate(vintage = "Economic Outlook No 114 - November 2023")) %>%
  filter(VARIABLE == "GDPV", 
         LOCATION == "DEU",
         FREQUENCY == "Q") %>%
  quarter_to_date() %>%
  filter(date >= as.Date("2014-01-01")) %>%
  group_by(vintage) %>%
  mutate(obsValue = 100*obsValue/obsValue[date == as.Date("2014-01-01")]) %>%
  ggplot + geom_line(aes(x = date, y = obsValue, color = vintage)) +
  xlab("") + ylab("Gross Domestic Product in Volume, Germany") + theme_minimal() +
  scale_x_date(breaks = seq(1920, 2100, 1) %>% paste0("-01-01") %>% as.Date,
               labels = date_format("%Y")) +
  theme(legend.position = c(0.25, 0.9),
        legend.title = element_blank()) +
  scale_y_log10(breaks = seq(20, 200, 1))

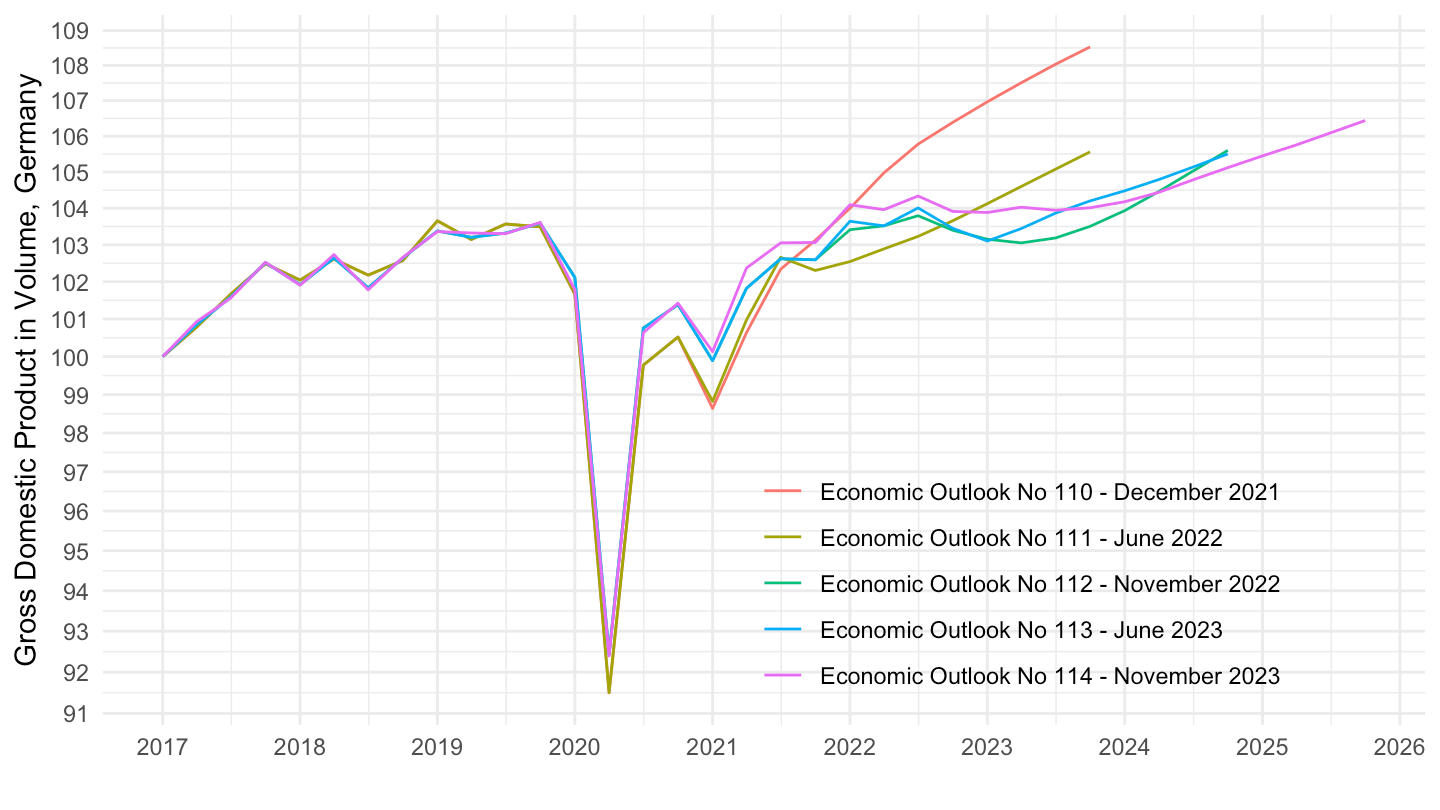
Since 2017Q1

Code
EO110_INTERNET %>%
  mutate(vintage = "Economic Outlook No 110 - December 2021") %>%
  bind_rows(EO111_INTERNET %>%
              mutate(vintage = "Economic Outlook No 111 - June 2022")) %>%
  bind_rows(EO112_INTERNET %>%
              mutate(vintage = "Economic Outlook No 112 - November 2022")) %>%
  bind_rows(EO113_INTERNET %>%
              mutate(vintage = "Economic Outlook No 113 - June 2023")) %>%
  bind_rows(EO114_INTERNET %>%
              mutate(vintage = "Economic Outlook No 114 - November 2023")) %>%
  filter(VARIABLE == "GDPV", 
         LOCATION == "DEU",
         FREQUENCY == "Q") %>%
  quarter_to_date() %>%
  filter(date >= as.Date("2017-01-01")) %>%
  group_by(vintage) %>%
  mutate(obsValue = 100*obsValue/obsValue[date == as.Date("2017-01-01")]) %>%
  ggplot + geom_line(aes(x = date, y = obsValue, color = vintage)) +
  xlab("") + ylab("Gross Domestic Product in Volume, Germany") + theme_minimal() +
  scale_x_date(breaks = seq(1920, 2100, 1) %>% paste0("-01-01") %>% as.Date,
               labels = date_format("%Y")) +
  theme(legend.position = c(0.7, 0.2),
        legend.title = element_blank()) +
  scale_y_log10(breaks = seq(20, 200, 1))

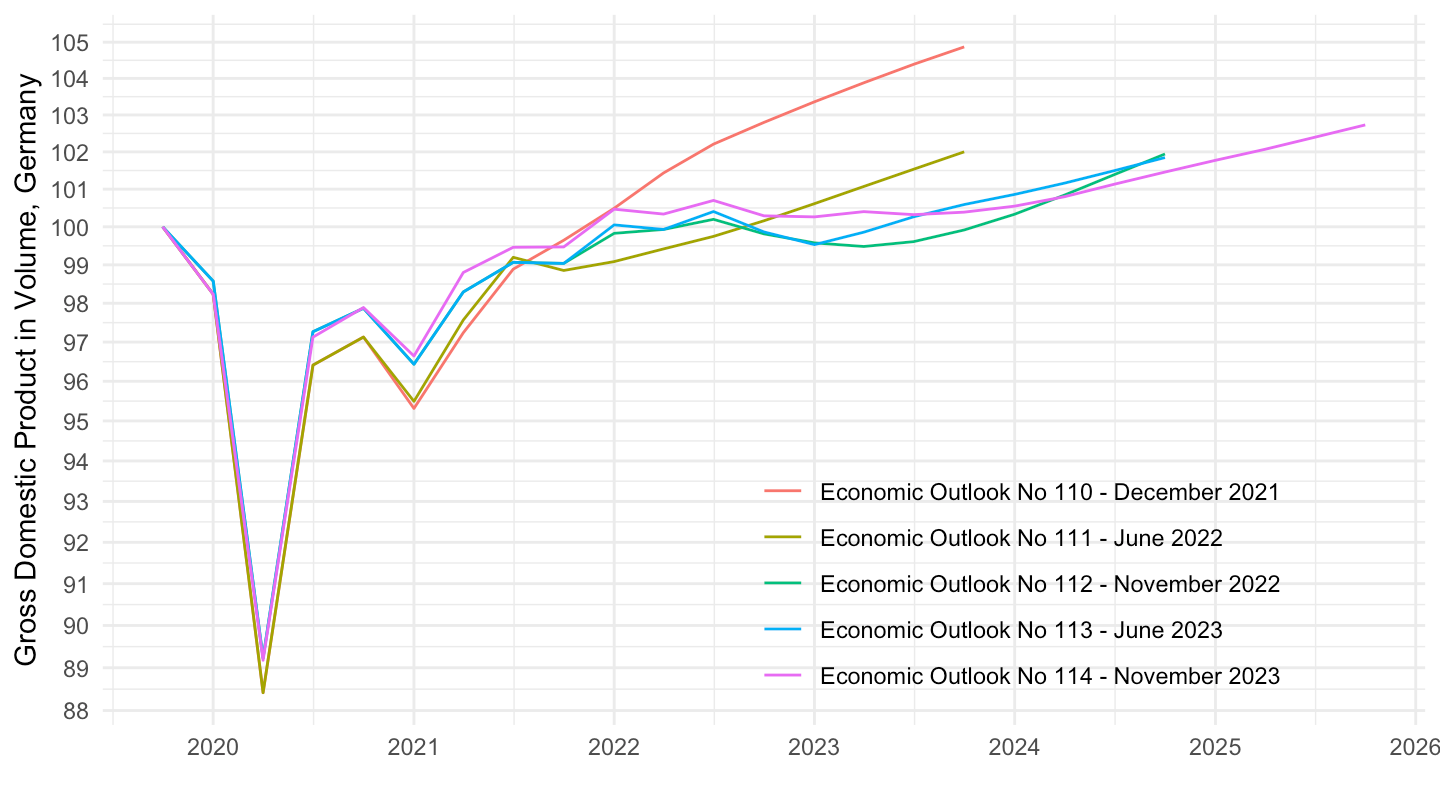
Since 2019Q4

Code
EO110_INTERNET %>%
  mutate(vintage = "Economic Outlook No 110 - December 2021") %>%
  bind_rows(EO111_INTERNET %>%
              mutate(vintage = "Economic Outlook No 111 - June 2022")) %>%
  bind_rows(EO112_INTERNET %>%
              mutate(vintage = "Economic Outlook No 112 - November 2022")) %>%
  bind_rows(EO113_INTERNET %>%
              mutate(vintage = "Economic Outlook No 113 - June 2023")) %>%
  bind_rows(EO114_INTERNET %>%
              mutate(vintage = "Economic Outlook No 114 - November 2023")) %>%
  filter(VARIABLE == "GDPV", 
         LOCATION == "DEU",
         FREQUENCY == "Q") %>%
  quarter_to_date() %>%
  filter(date >= as.Date("2019-10-01")) %>%
  group_by(vintage) %>%
  mutate(obsValue = 100*obsValue/obsValue[date == as.Date("2019-10-01")]) %>%
  ggplot + geom_line(aes(x = date, y = obsValue, color = vintage)) +
  xlab("") + ylab("Gross Domestic Product in Volume, Germany") + theme_minimal() +
  scale_x_date(breaks = seq(1920, 2100, 1) %>% paste0("-01-01") %>% as.Date,
               labels = date_format("%Y")) +
  theme(legend.position = c(0.7, 0.2),
        legend.title = element_blank()) +
  scale_y_log10(breaks = seq(20, 200, 1))

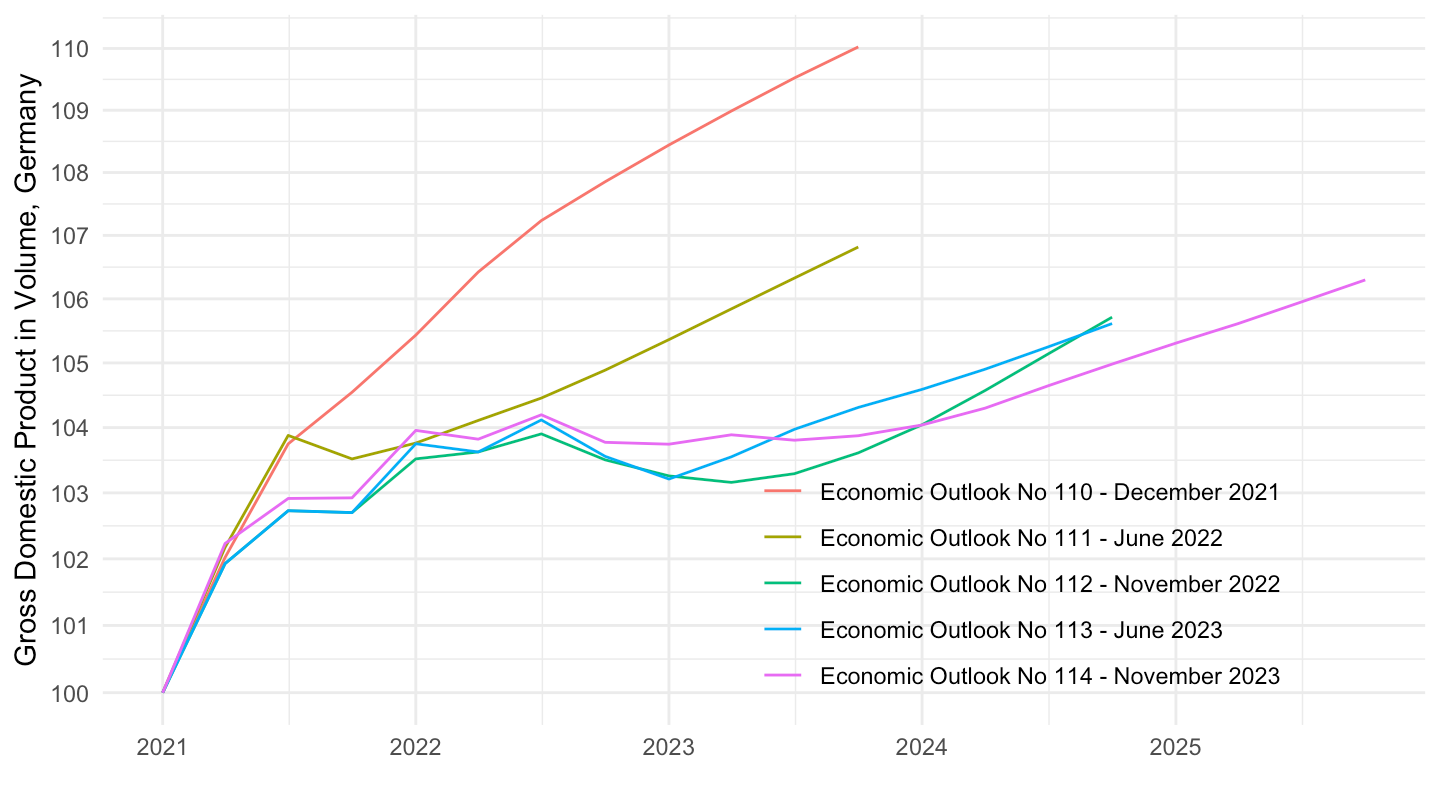
Since 2021

Code
EO110_INTERNET %>%
  mutate(vintage = "Economic Outlook No 110 - December 2021") %>%
  bind_rows(EO111_INTERNET %>%
              mutate(vintage = "Economic Outlook No 111 - June 2022")) %>%
  bind_rows(EO112_INTERNET %>%
              mutate(vintage = "Economic Outlook No 112 - November 2022")) %>%
  bind_rows(EO113_INTERNET %>%
              mutate(vintage = "Economic Outlook No 113 - June 2023")) %>%
  bind_rows(EO114_INTERNET %>%
              mutate(vintage = "Economic Outlook No 114 - November 2023")) %>%
  filter(VARIABLE == "GDPV", 
         LOCATION == "DEU",
         FREQUENCY == "Q") %>%
  quarter_to_date() %>%
  filter(date >= as.Date("2021-01-01")) %>%
  group_by(vintage) %>%
  mutate(obsValue = 100*obsValue/obsValue[date == as.Date("2021-01-01")]) %>%
  ggplot + geom_line(aes(x = date, y = obsValue, color = vintage)) +
  xlab("") + ylab("Gross Domestic Product in Volume, Germany") + theme_minimal() +
  scale_x_date(breaks = seq(1920, 2100, 1) %>% paste0("-01-01") %>% as.Date,
               labels = date_format("%Y")) +
  theme(legend.position = c(0.7, 0.2),
        legend.title = element_blank()) +
  scale_y_log10(breaks = seq(20, 200, 1))

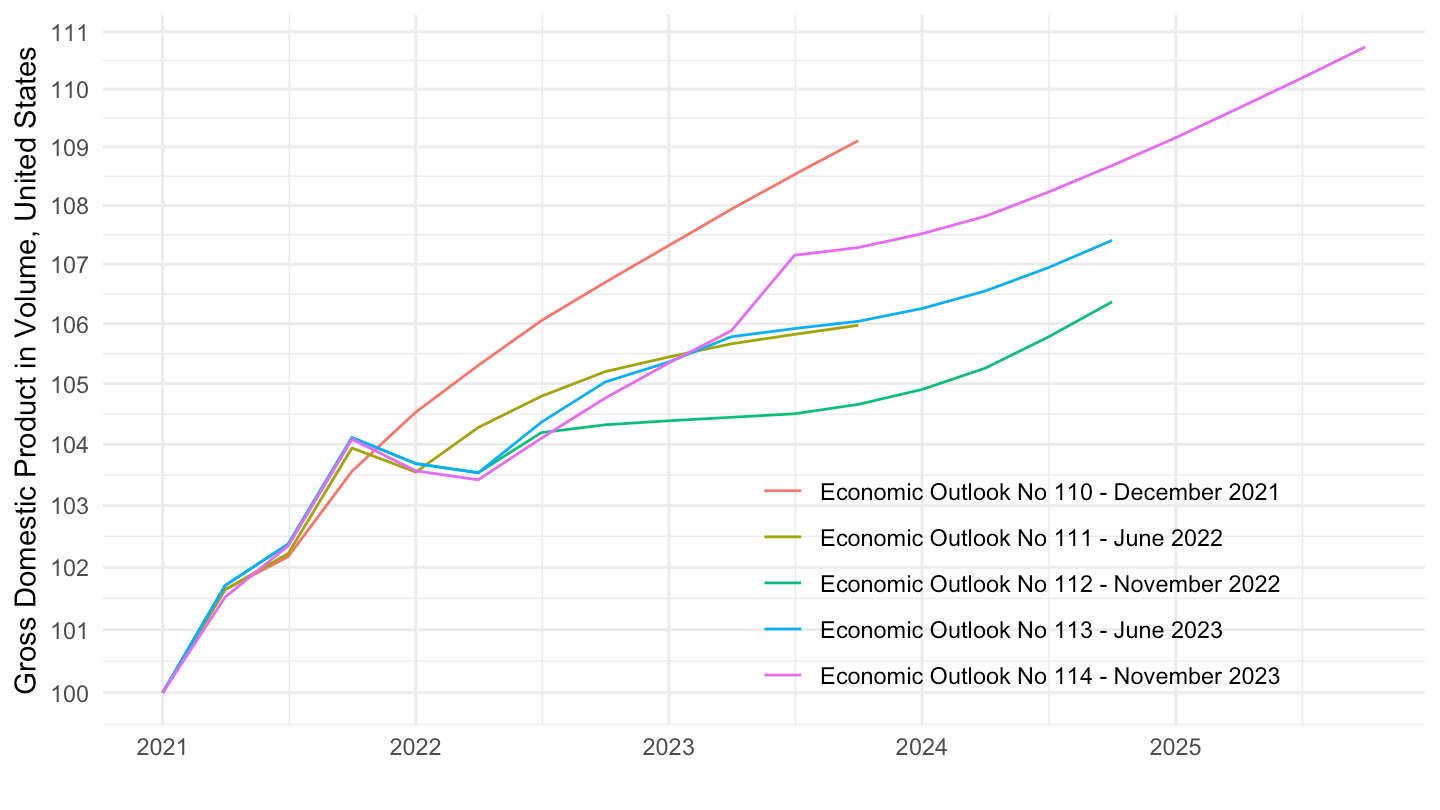
U.S. Since 2021

Code
EO110_INTERNET %>%
  mutate(vintage = "Economic Outlook No 110 - December 2021") %>%
  bind_rows(EO111_INTERNET %>%
              mutate(vintage = "Economic Outlook No 111 - June 2022")) %>%
  bind_rows(EO112_INTERNET %>%
              mutate(vintage = "Economic Outlook No 112 - November 2022")) %>%
  bind_rows(EO113_INTERNET %>%
              mutate(vintage = "Economic Outlook No 113 - June 2023")) %>%
  bind_rows(EO114_INTERNET %>%
              mutate(vintage = "Economic Outlook No 114 - November 2023")) %>%
  filter(VARIABLE == "GDPV", 
         LOCATION == "USA",
         FREQUENCY == "Q") %>%
  quarter_to_date() %>%
  filter(date >= as.Date("2021-01-01")) %>%
  group_by(vintage) %>%
  mutate(obsValue = 100*obsValue/obsValue[date == as.Date("2021-01-01")]) %>%
  ggplot + geom_line(aes(x = date, y = obsValue, color = vintage)) +
  xlab("") + ylab("Gross Domestic Product in Volume, United States") + theme_minimal() +
  scale_x_date(breaks = seq(1920, 2100, 1) %>% paste0("-01-01") %>% as.Date,
               labels = date_format("%Y")) +
  theme(legend.position = c(0.7, 0.2),
        legend.title = element_blank()) +
  scale_y_log10(breaks = seq(20, 200, 1))

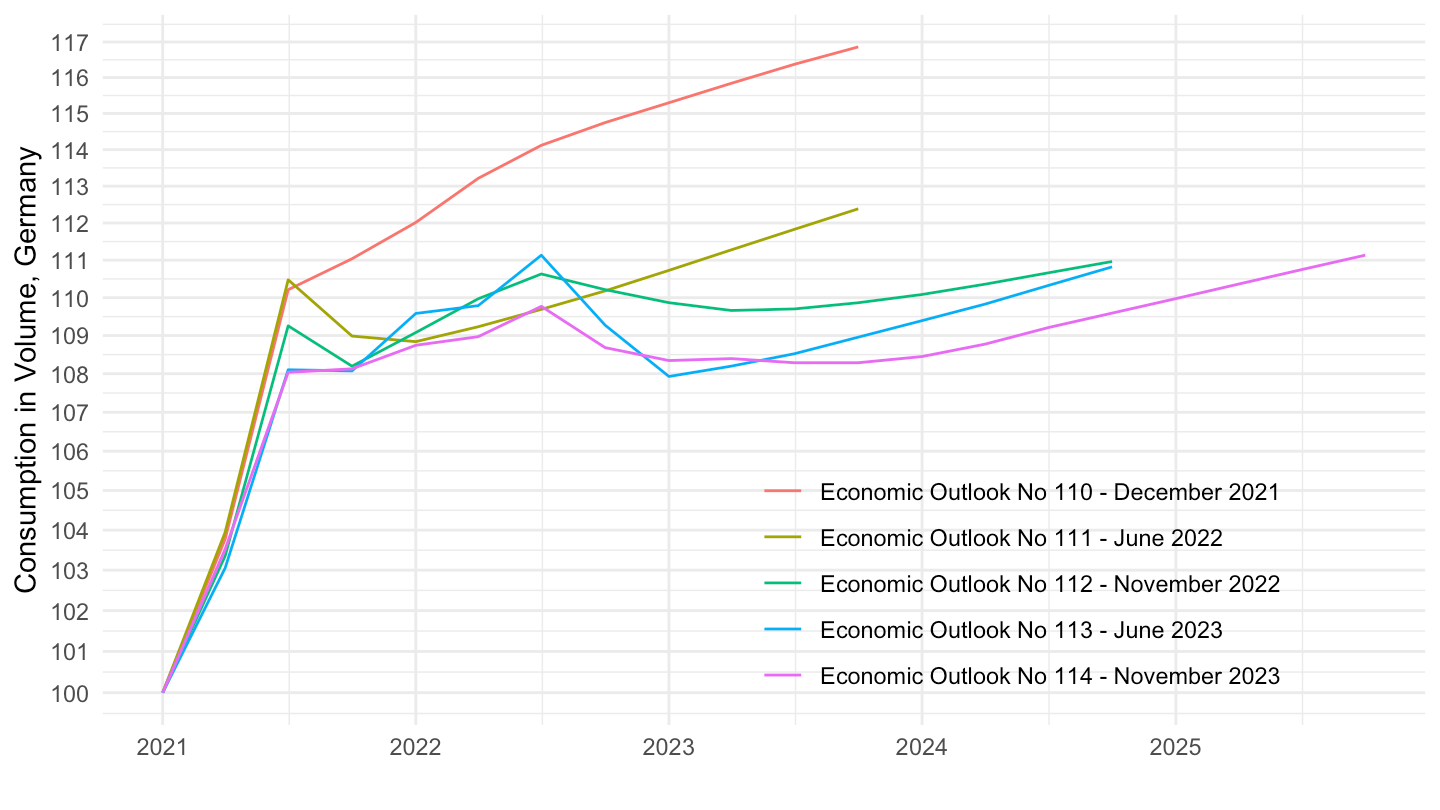
Consumption in Volume

Code
EO110_INTERNET %>%
  mutate(vintage = "Economic Outlook No 110 - December 2021") %>%
  bind_rows(EO111_INTERNET %>%
              mutate(vintage = "Economic Outlook No 111 - June 2022")) %>%
  bind_rows(EO112_INTERNET %>%
              mutate(vintage = "Economic Outlook No 112 - November 2022")) %>%
  bind_rows(EO113_INTERNET %>%
              mutate(vintage = "Economic Outlook No 113 - June 2023")) %>%
  bind_rows(EO114_INTERNET %>%
              mutate(vintage = "Economic Outlook No 114 - November 2023")) %>%
  filter(VARIABLE == "CPV", 
         LOCATION == "DEU",
         FREQUENCY == "Q") %>%
  quarter_to_date() %>%
  filter(date >= as.Date("2021-01-01")) %>%
  group_by(vintage) %>%
  mutate(obsValue = 100*obsValue/obsValue[date == as.Date("2021-01-01")]) %>%
  ggplot + geom_line(aes(x = date, y = obsValue, color = vintage)) +
  xlab("") + ylab("Consumption in Volume, Germany") + theme_minimal() +
  scale_x_date(breaks = seq(1920, 2100, 1) %>% paste0("-01-01") %>% as.Date,
               labels = date_format("%Y")) +
  theme(legend.position = c(0.7, 0.2),
        legend.title = element_blank()) +
  scale_y_log10(breaks = seq(20, 200, 1))

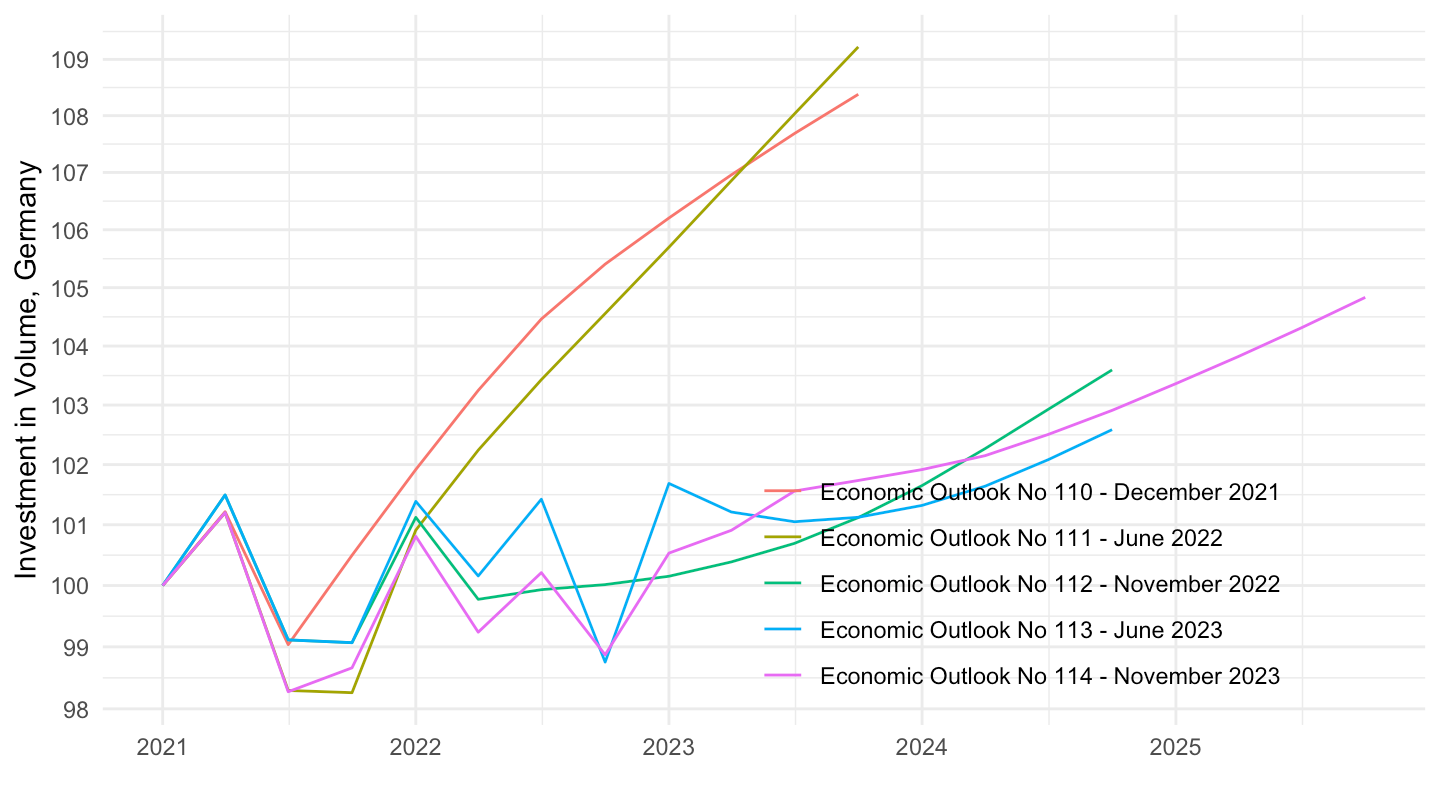
Investment in Volume

Code
EO110_INTERNET %>%
  mutate(vintage = "Economic Outlook No 110 - December 2021") %>%
  bind_rows(EO111_INTERNET %>%
              mutate(vintage = "Economic Outlook No 111 - June 2022")) %>%
  bind_rows(EO112_INTERNET %>%
              mutate(vintage = "Economic Outlook No 112 - November 2022")) %>%
  bind_rows(EO113_INTERNET %>%
              mutate(vintage = "Economic Outlook No 113 - June 2023")) %>%
  bind_rows(EO114_INTERNET %>%
              mutate(vintage = "Economic Outlook No 114 - November 2023")) %>%
  filter(VARIABLE == "ITV", 
         LOCATION == "DEU",
         FREQUENCY == "Q") %>%
  quarter_to_date() %>%
  filter(date >= as.Date("2021-01-01")) %>%
  group_by(vintage) %>%
  mutate(obsValue = 100*obsValue/obsValue[date == as.Date("2021-01-01")]) %>%
  ggplot + geom_line(aes(x = date, y = obsValue, color = vintage)) +
  xlab("") + ylab("Investment in Volume, Germany") + theme_minimal() +
  scale_x_date(breaks = seq(1920, 2100, 1) %>% paste0("-01-01") %>% as.Date,
               labels = date_format("%Y")) +
  theme(legend.position = c(0.7, 0.2),
        legend.title = element_blank()) +
  scale_y_log10(breaks = seq(20, 200, 1))

GDP in Volume

Growth revisions by country for 2023-Q1

Table

Code
EO110_INTERNET %>%
  mutate(vintage = "2021-12") %>%
  bind_rows(EO111_INTERNET %>%
              mutate(vintage = "2022-06")) %>%
  bind_rows(EO112_INTERNET %>%
              mutate(vintage = "2022-11")) %>%
  bind_rows(EO113_INTERNET %>%
              mutate(vintage = "2023-06")) %>%
  bind_rows(EO114_INTERNET %>%
              mutate(vintage = "2023-11")) %>%
  left_join(EO114_INTERNET_var$LOCATION, by = "LOCATION") %>%
  filter(VARIABLE == "GDPV", 
         obsTime == "2023-Q1",
         FREQUENCY == "Q") %>%
  select(vintage, Location, obsValue) %>%
  group_by(Location) %>%
  arrange(vintage) %>%
  mutate(obsValue = 100*obsValue/obsValue[1]) %>%
  spread(vintage, obsValue) %>%
  arrange(`2023-06`) %>%
  print_table_conditional()

Output Gap (% of GDP)

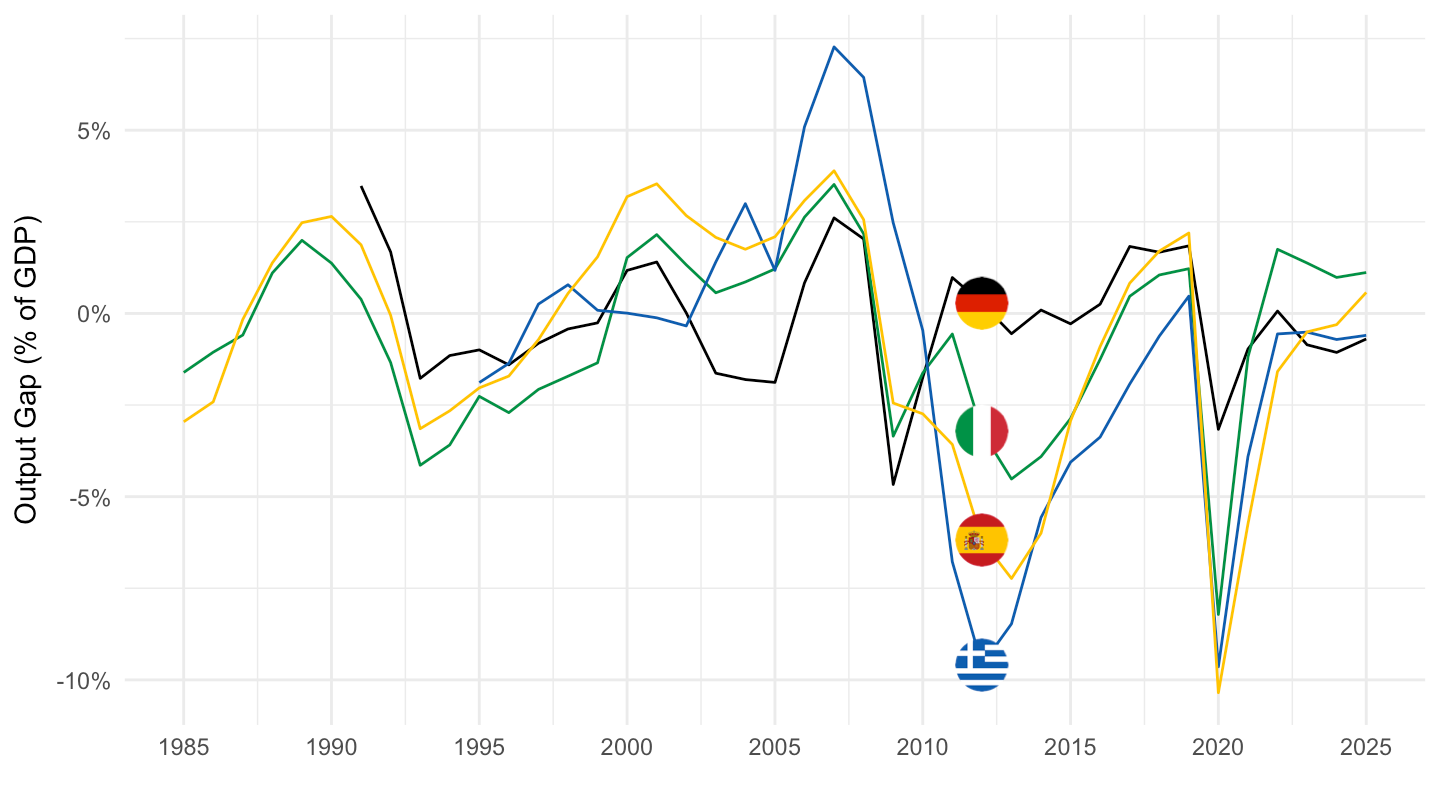
Germany, Spain, Greece, Italy

Code
EO114_INTERNET %>%
  filter(FREQUENCY == "A",
         VARIABLE == "GAP",
         LOCATION %in% c("DEU", "ESP", "GRC", "ITA")) %>%
  left_join(EO114_INTERNET_var$LOCATION, by = "LOCATION") %>%
  year_to_date %>%
  select(Location, date, obsValue) %>%
  arrange(Location, date) %>%
  mutate(obsValue = obsValue/100) %>%
  left_join(colors, by = c("Location" = "country")) %>%
  ggplot() + 
  geom_line(aes(x = date, y = obsValue, color = color)) +
  theme_minimal() + scale_color_identity() + add_4flags +
  scale_x_date(breaks = seq(1920, 2100, 5) %>% paste0("-01-01") %>% as.Date,
               labels = date_format("%Y")) +
  scale_y_continuous(breaks = 0.01*seq(-60, 60, 5),
                     labels = scales::percent_format(accuracy = 1)) +
  ylab("Output Gap (% of GDP)") + xlab("")

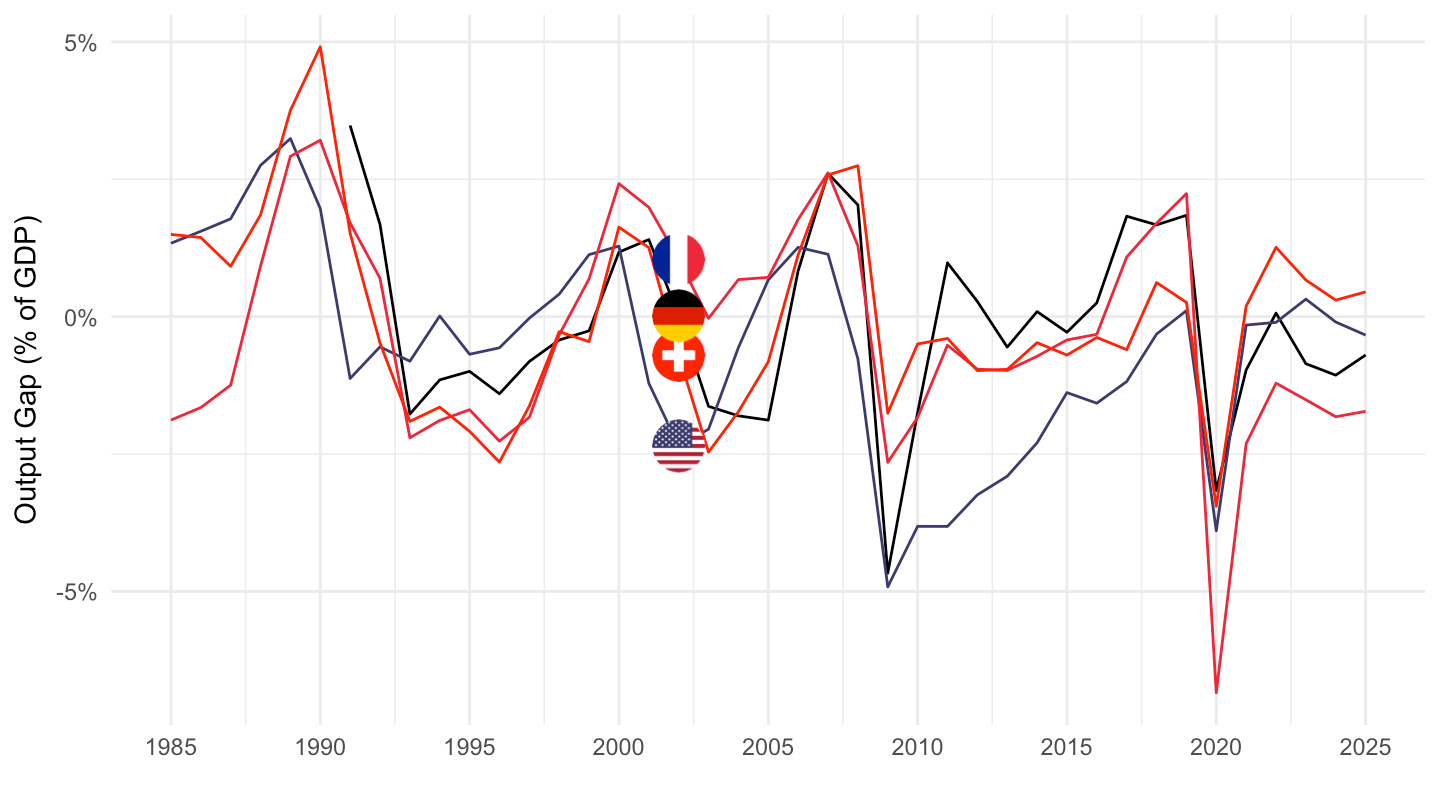
United States, France, Germany, Switzerland

Code
EO114_INTERNET %>%
  filter(FREQUENCY == "A",
         VARIABLE == "GAP",
         LOCATION %in% c("CHE", "FRA", "DEU", "USA")) %>%
  left_join(EO114_INTERNET_var$LOCATION, by = "LOCATION") %>%
  year_to_date %>%
  select(Location, date, obsValue) %>%
  arrange(Location, date) %>%
  mutate(obsValue = obsValue/100) %>%
  left_join(colors, by = c("Location" = "country")) %>%
  ggplot() + 
  geom_line(aes(x = date, y = obsValue, color = color)) +
  theme_minimal() + scale_color_identity() + add_4flags +
  scale_x_date(breaks = seq(1920, 2100, 5) %>% paste0("-01-01") %>% as.Date,
               labels = date_format("%Y")) +
  scale_y_continuous(breaks = 0.01*seq(-60, 60, 5),
                     labels = scales::percent_format(accuracy = 1)) +
  ylab("Output Gap (% of GDP)") + xlab("")

Unemployment Rate

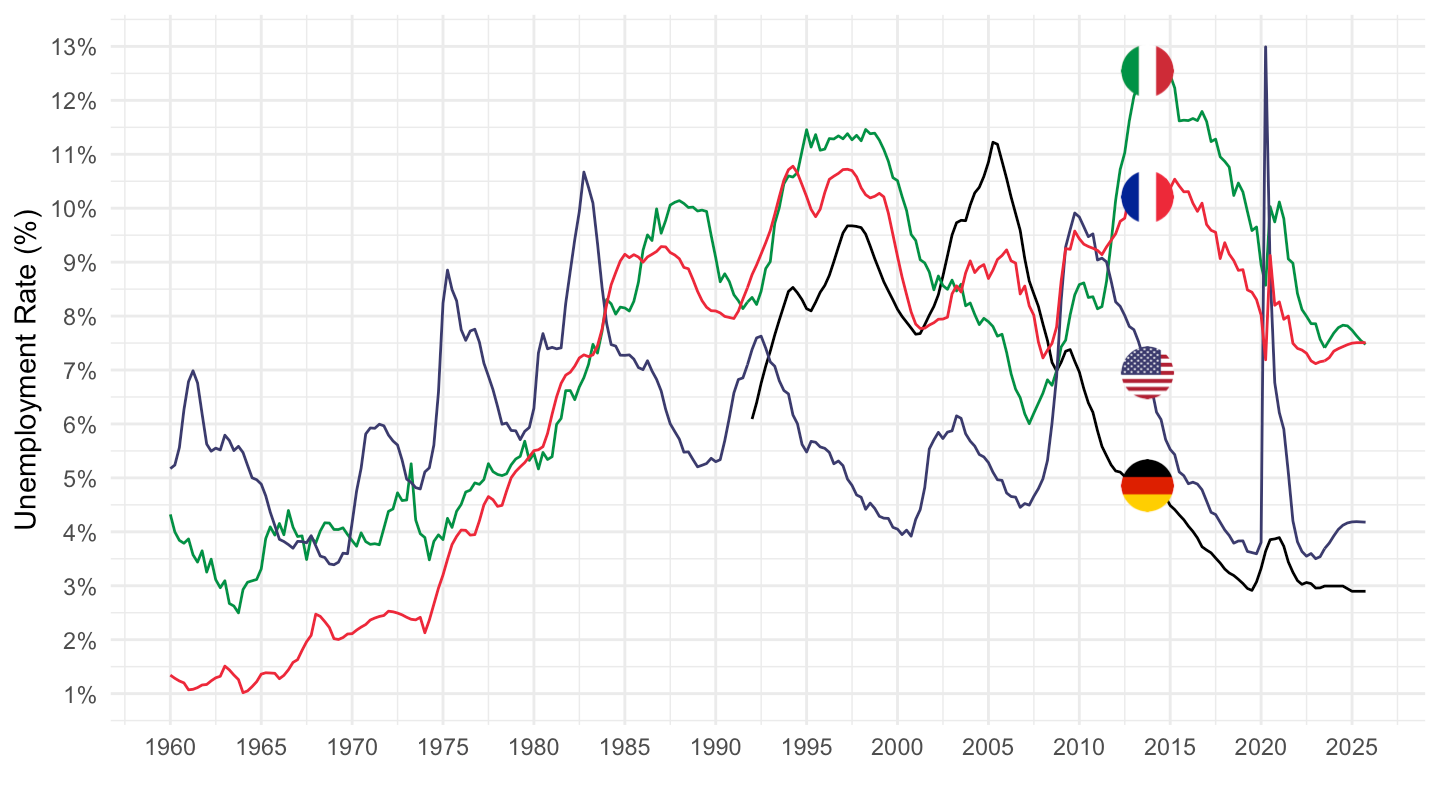
Germany, Spain, Greece, Italy

All

Code
EO114_INTERNET %>%
  filter(FREQUENCY == "Q",
         VARIABLE == "UNR",
         LOCATION %in% c("DEU", "ITA", "FRA", "USA")) %>%
  left_join(EO114_INTERNET_var$LOCATION, by = "LOCATION") %>%
  quarter_to_date %>%
  select(Location, date, obsValue) %>%
  arrange(Location, date) %>%
  mutate(obsValue = obsValue/100) %>%
  left_join(colors, by = c("Location" = "country")) %>%
  ggplot() + 
  geom_line(aes(x = date, y = obsValue, color = color)) +
  theme_minimal() + scale_color_identity() + add_4flags +
  scale_x_date(breaks = seq(1920, 2100, 5) %>% paste0("-01-01") %>% as.Date,
               labels = date_format("%Y")) +
  scale_y_continuous(breaks = 0.01*seq(-60, 60, 1),
                     labels = scales::percent_format(accuracy = 1)) +
  ylab("Unemployment Rate (%)") + xlab("")

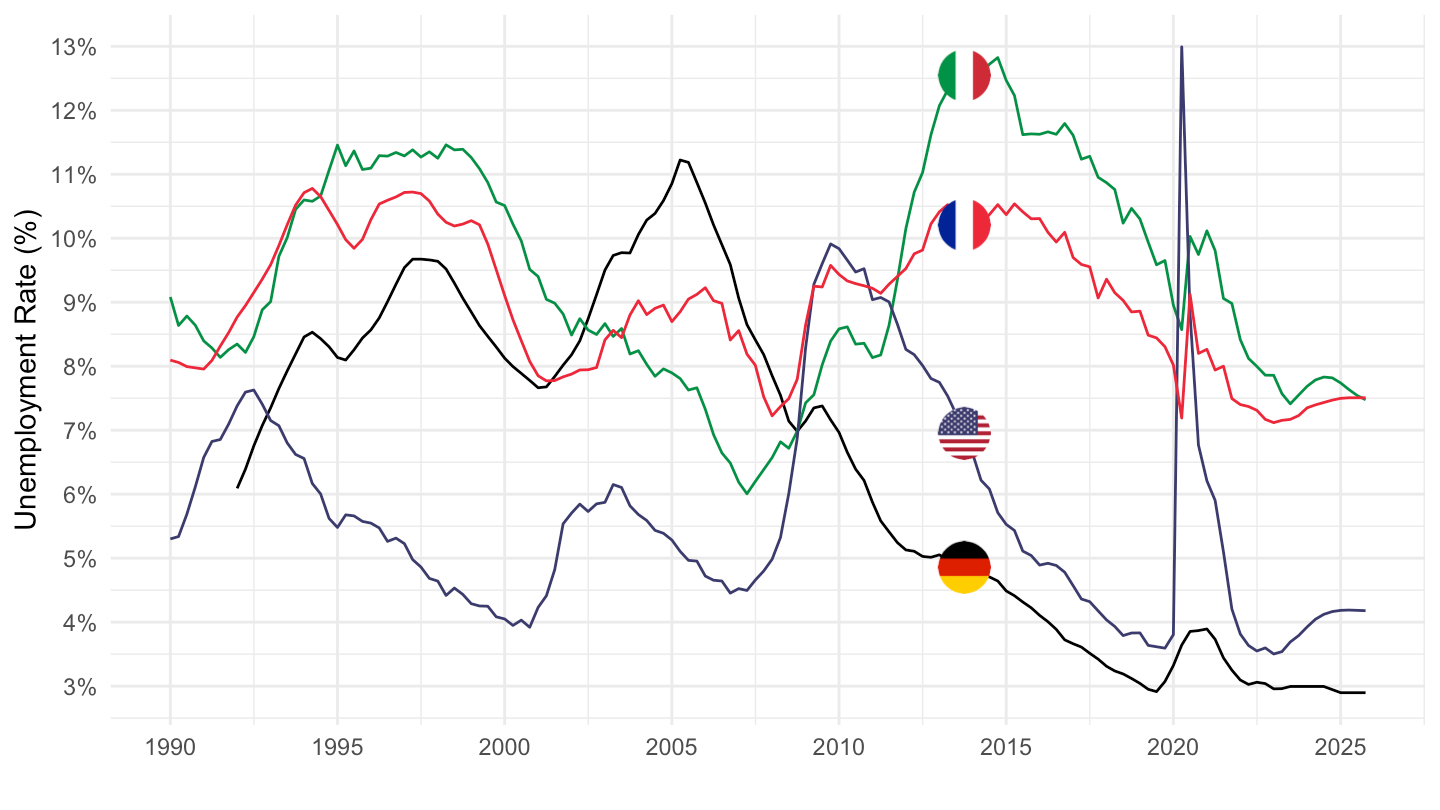
1990-

Code
EO114_INTERNET %>%
  filter(FREQUENCY == "Q",
         VARIABLE == "UNR",
         LOCATION %in% c("DEU", "ITA", "FRA", "USA")) %>%
  left_join(EO114_INTERNET_var$LOCATION, by = "LOCATION") %>%
  quarter_to_date %>%
  filter(date >= as.Date("1990-01-01")) %>%
  select(Location, date, obsValue) %>%
  arrange(Location, date) %>%
  mutate(obsValue = obsValue/100) %>%
  left_join(colors, by = c("Location" = "country")) %>%
  ggplot() + 
  geom_line(aes(x = date, y = obsValue, color = color)) +
  theme_minimal() + scale_color_identity() + add_4flags +
  scale_x_date(breaks = seq(1920, 2100, 5) %>% paste0("-01-01") %>% as.Date,
               labels = date_format("%Y")) +
  scale_y_continuous(breaks = 0.01*seq(-60, 60, 1),
                     labels = scales::percent_format(accuracy = 1)) +
  ylab("Unemployment Rate (%)") + xlab("")

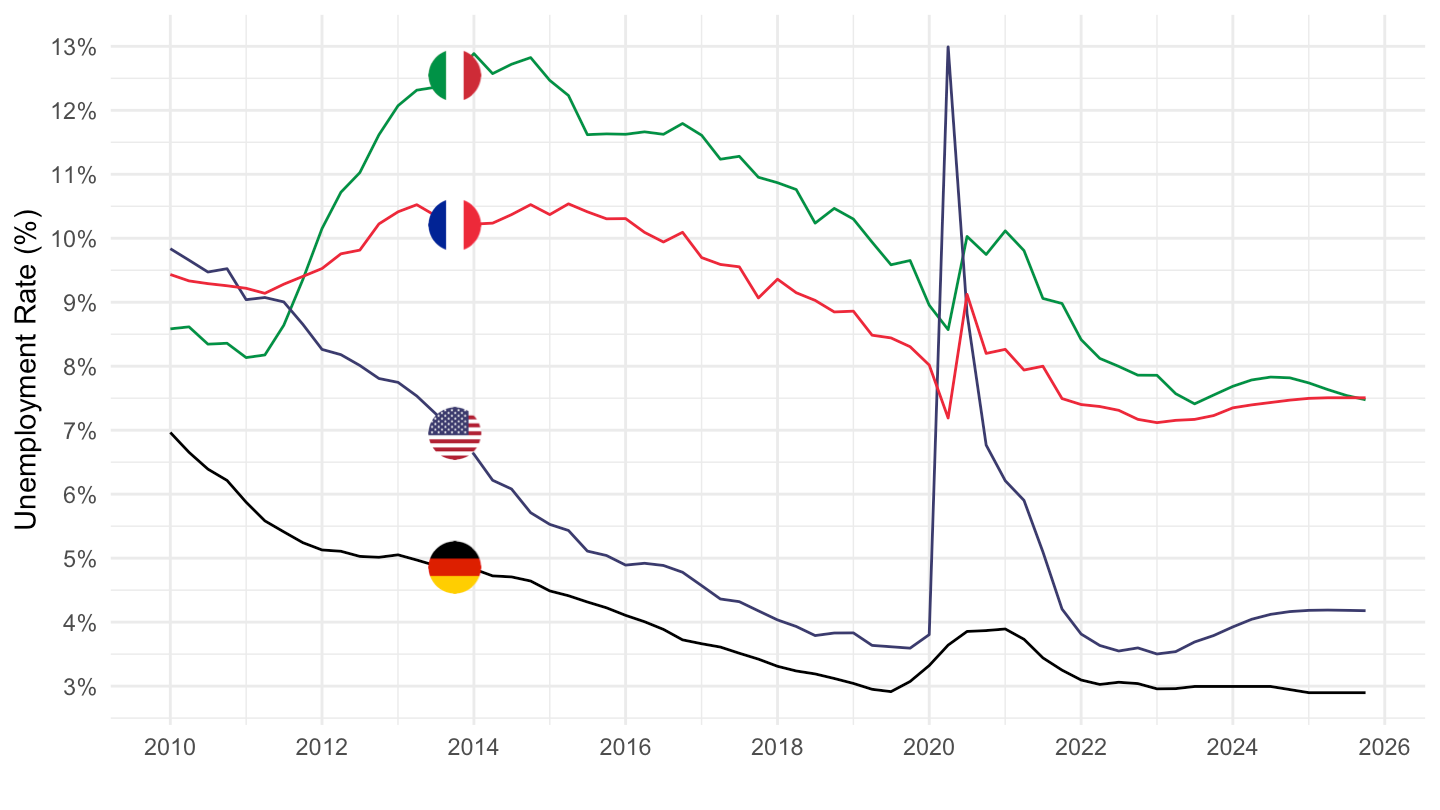
2010-

Code
EO114_INTERNET %>%
  filter(FREQUENCY == "Q",
         VARIABLE == "UNR",
         LOCATION %in% c("DEU", "ITA", "FRA", "USA")) %>%
  left_join(EO114_INTERNET_var$LOCATION, by = "LOCATION") %>%
  quarter_to_date %>%
  filter(date >= as.Date("2010-01-01")) %>%
  select(Location, date, obsValue) %>%
  arrange(Location, date) %>%
  mutate(obsValue = obsValue/100) %>%
  left_join(colors, by = c("Location" = "country")) %>%
  ggplot() + 
  geom_line(aes(x = date, y = obsValue, color = color)) +
  theme_minimal() + scale_color_identity() + add_4flags +
  scale_x_date(breaks = seq(1920, 2100, 2) %>% paste0("-01-01") %>% as.Date,
               labels = date_format("%Y")) +
  scale_y_continuous(breaks = 0.01*seq(-60, 60, 1),
                     labels = scales::percent_format(accuracy = 1)) +
  ylab("Unemployment Rate (%)") + xlab("")