Last observation: Q4 2023 (N = 3841) · 2023 (N = 8798)
First observation: 1960 (N = 1569) · Q1 1960 (N = 1100)
Last data update: 02 août 2026, 08:58
Last compile: 09 oct. 2026, 23:07
EO110_INTERNET |>
  filter(FREQUENCY == "A",
         VARIABLE == "GAP",
         LOCATION %in% c("DEU", "ESP", "GRC", "ITA")) |>
  left_join(EO110_INTERNET_var$LOCATION, by = "LOCATION") |>
  year_to_date() |>
  select(Location, date, obsValue) |>
  arrange(Location, date) |>
  mutate(obsValue = obsValue/100) |>
  add_flag_color("Location") |>
  ggplot() +
  geom_line(aes(x = date, y = obsValue, color = color)) +
  theme_minimal() + scale_color_identity() + add_4flags +
  scale_x_date(breaks = seq(1920, 2100, 5) |> paste0("-01-01") |> as.Date(),
               labels = date_format("%Y")) +
  scale_y_continuous(breaks = 0.01*seq(-60, 60, 5),
                     labels = scales::percent_format(accuracy = 1)) +
  ylab("Output Gap (% of GDP)") + xlab("")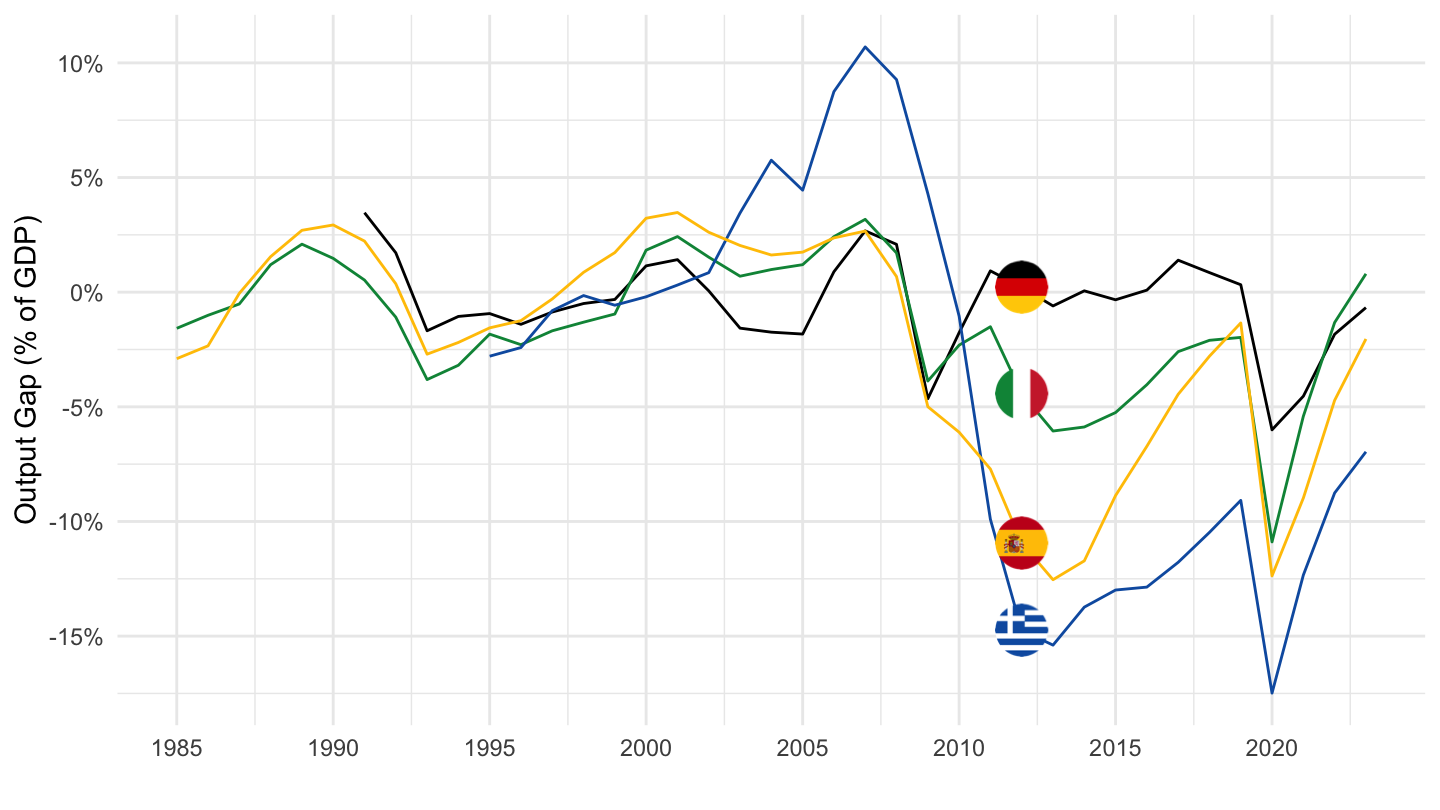
EO110_INTERNET |>
  filter(FREQUENCY == "A",
         VARIABLE == "GAP",
         LOCATION %in% c("CHE", "FRA", "DEU", "USA")) |>
  left_join(EO110_INTERNET_var$LOCATION, by = "LOCATION") |>
  year_to_date() |>
  select(Location, date, obsValue) |>
  arrange(Location, date) |>
  mutate(obsValue = obsValue/100) |>
  add_flag_color("Location") |>
  ggplot() +
  geom_line(aes(x = date, y = obsValue, color = color)) +
  theme_minimal() + scale_color_identity() + add_4flags +
  scale_x_date(breaks = seq(1920, 2100, 5) |> paste0("-01-01") |> as.Date(),
               labels = date_format("%Y")) +
  scale_y_continuous(breaks = 0.01*seq(-60, 60, 5),
                     labels = scales::percent_format(accuracy = 1)) +
  ylab("Output Gap (% of GDP)") + xlab("")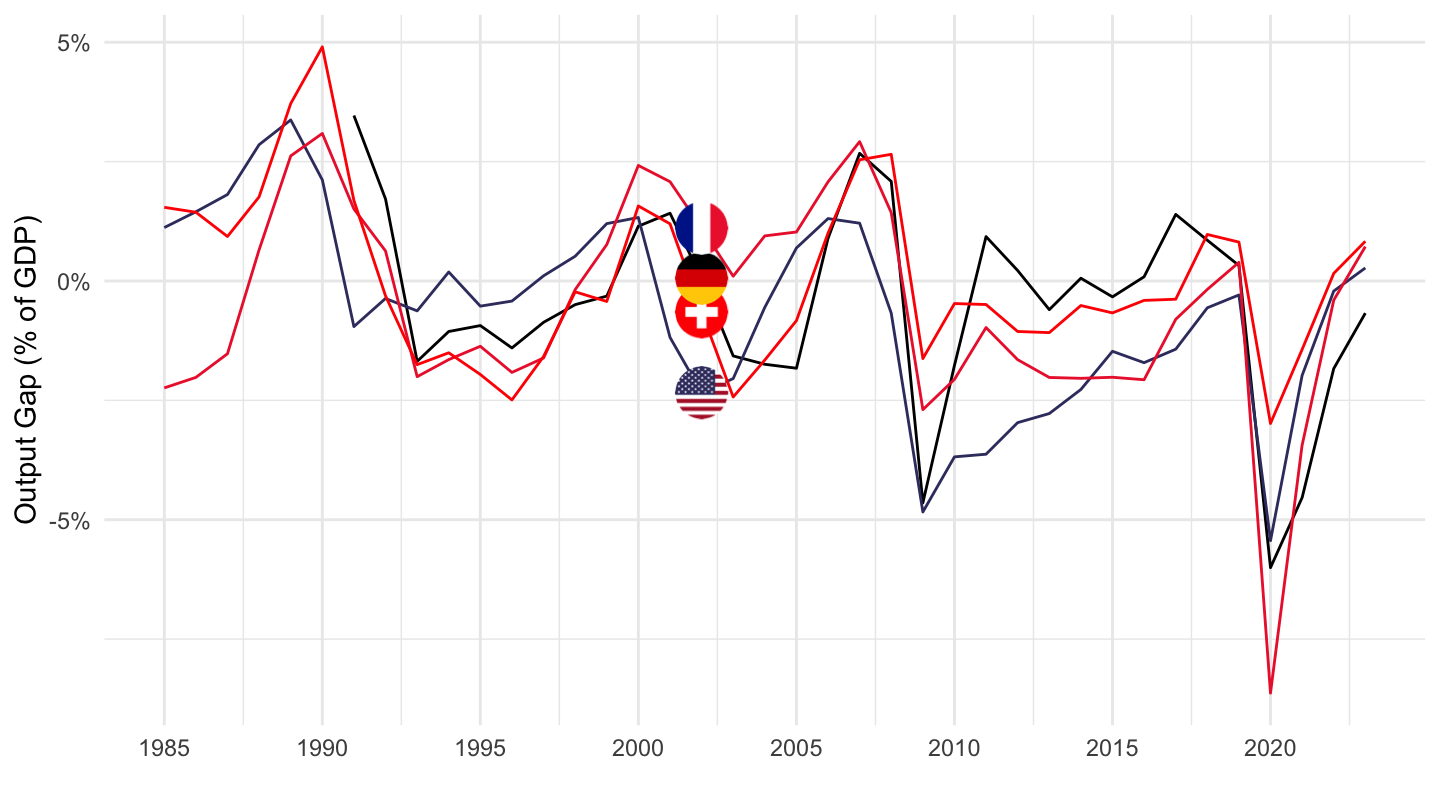
EO110_INTERNET |>
  filter(FREQUENCY == "Q",
         VARIABLE == "UNR",
         LOCATION %in% c("DEU", "ITA", "FRA", "USA")) |>
  left_join(EO110_INTERNET_var$LOCATION, by = "LOCATION") |>
  quarter_to_date() |>
  select(Location, date, obsValue) |>
  arrange(Location, date) |>
  mutate(obsValue = obsValue/100) |>
  add_flag_color("Location") |>
  ggplot() +
  geom_line(aes(x = date, y = obsValue, color = color)) +
  theme_minimal() + scale_color_identity() + add_4flags +
  scale_x_date(breaks = seq(1920, 2100, 5) |> paste0("-01-01") |> as.Date(),
               labels = date_format("%Y")) +
  scale_y_continuous(breaks = 0.01*seq(-60, 60, 1),
                     labels = scales::percent_format(accuracy = 1)) +
  ylab("Unemployment Rate (%)") + xlab("")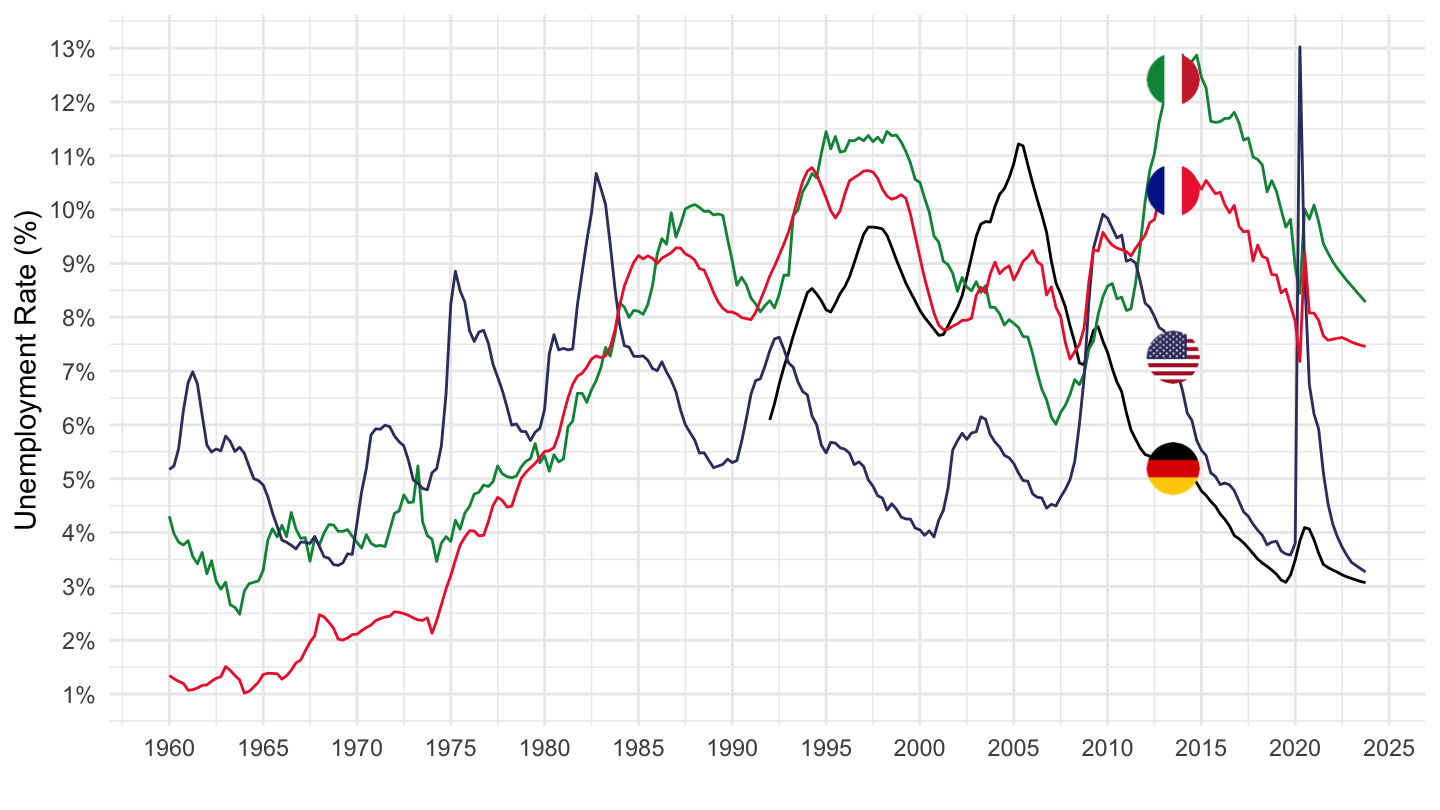
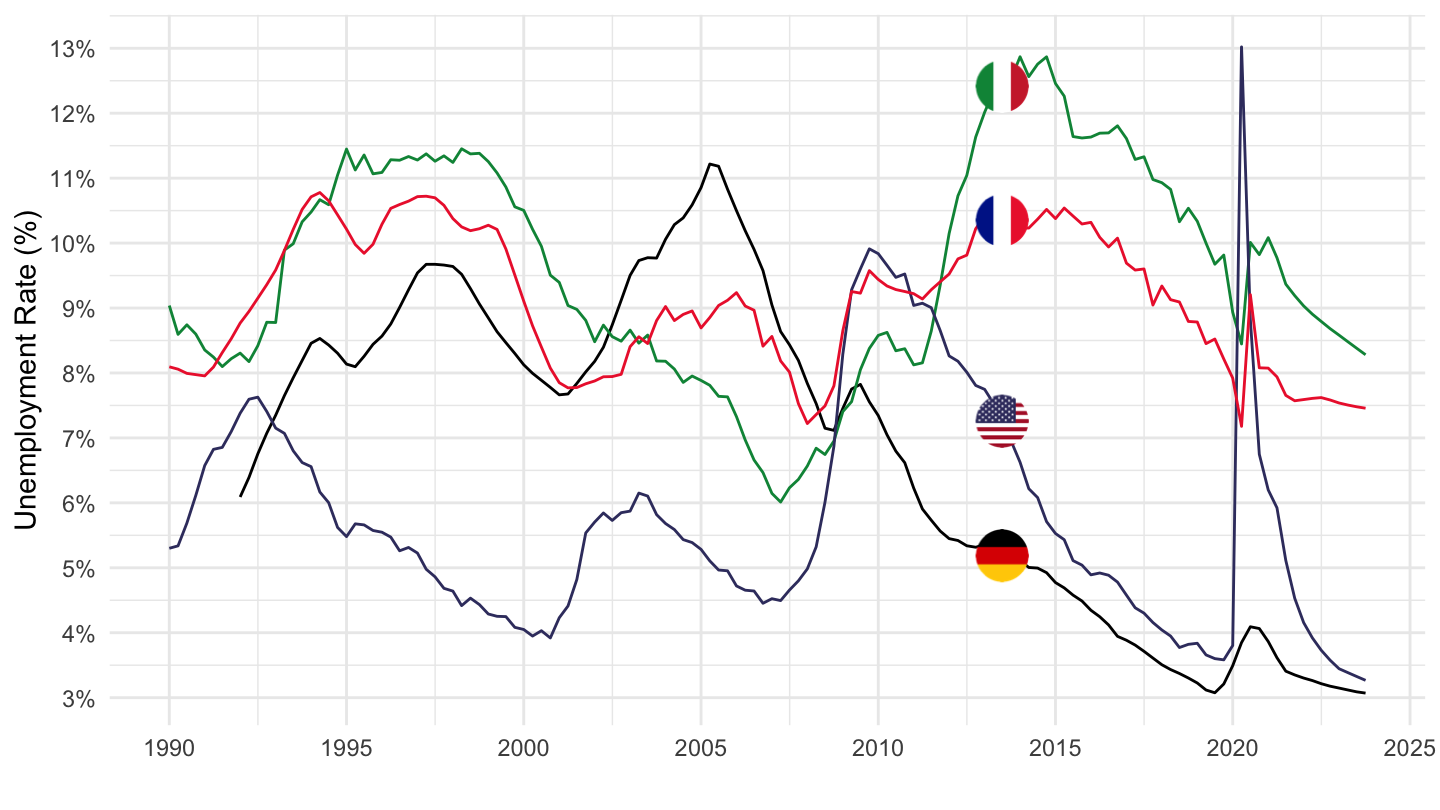
EO110_INTERNET |>
  filter(FREQUENCY == "Q",
         VARIABLE == "UNR",
         LOCATION %in% c("DEU", "ITA", "FRA", "USA")) |>
  left_join(EO110_INTERNET_var$LOCATION, by = "LOCATION") |>
  quarter_to_date() |>
  filter(date >= as.Date("1990-01-01")) |>
  select(Location, date, obsValue) |>
  arrange(Location, date) |>
  mutate(obsValue = obsValue/100) |>
  add_flag_color("Location") |>
  ggplot() +
  geom_line(aes(x = date, y = obsValue, color = color)) +
  theme_minimal() + scale_color_identity() + add_4flags +
  scale_x_date(breaks = seq(1920, 2100, 5) |> paste0("-01-01") |> as.Date(),
               labels = date_format("%Y")) +
  scale_y_continuous(breaks = 0.01*seq(-60, 60, 1),
                     labels = scales::percent_format(accuracy = 1)) +
  ylab("Unemployment Rate (%)") + xlab("")