bind_rows(unr, cpi) %>%
filter(Ticker %in% c("UNUSAM", "CPUSAM")) %>%
select(-variable, -iso3c) %>%
spread(Ticker, value) %>%
na.omit %>%
filter(month(date) == 12, day(date) == 31) %>%
filter(date <= as.Date("1946-01-01")) %>%
mutate(CPUSAM_log = log(CPUSAM),
price_inflation = CPUSAM_log - dplyr::lag(CPUSAM_log),
UNUSAM = UNUSAM/100) %>%
select(date, UNUSAM, price_inflation) %>%
gather(variable, value, -date) %>%
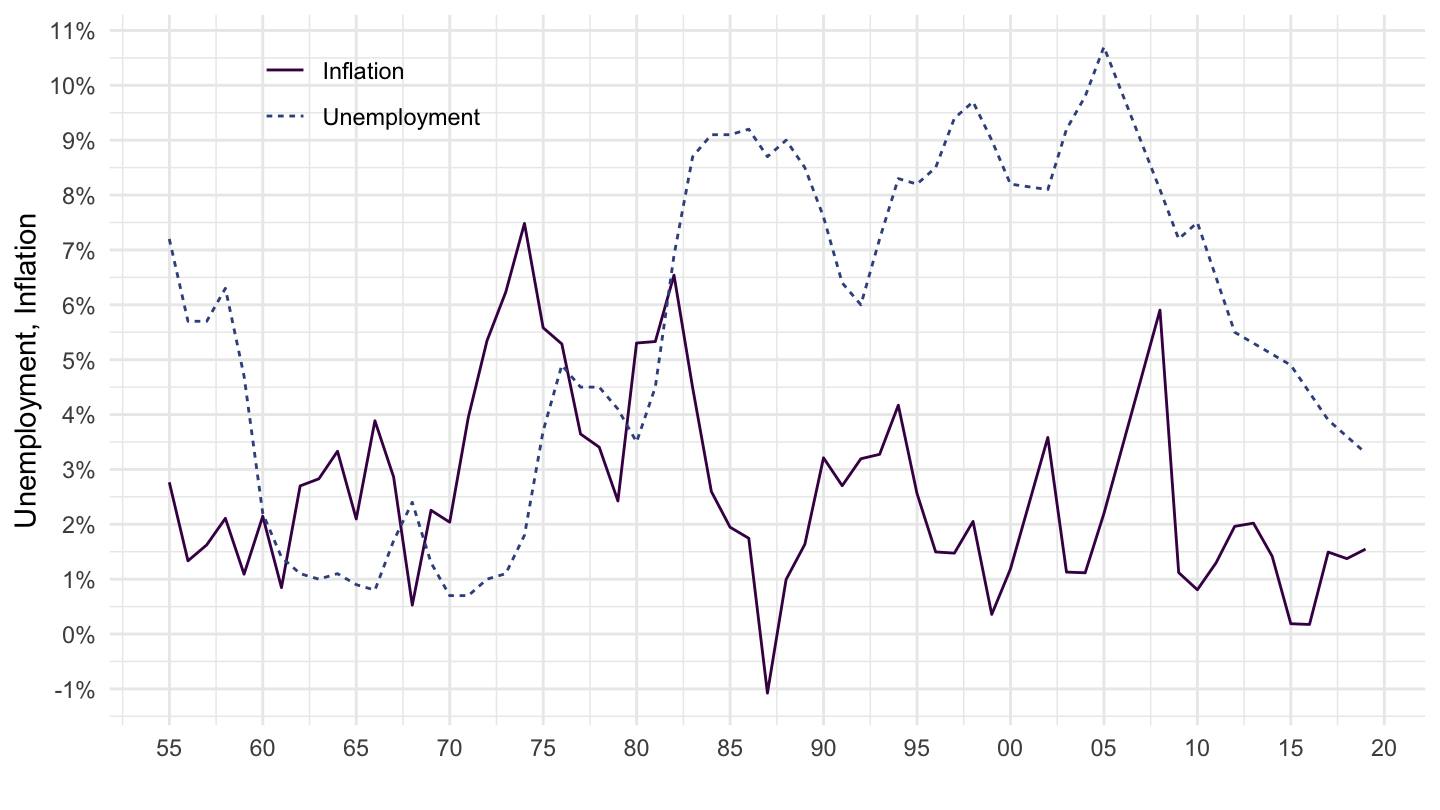
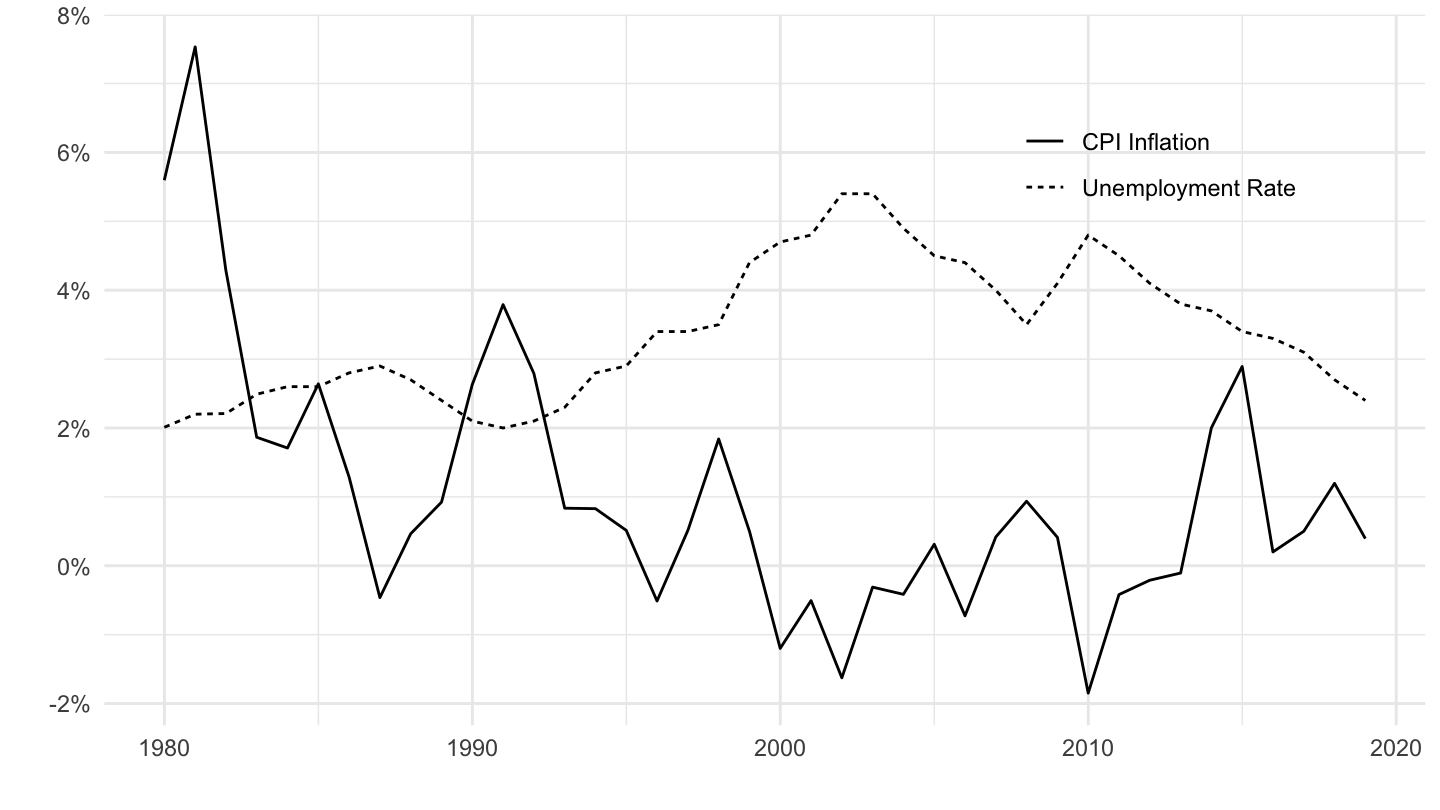
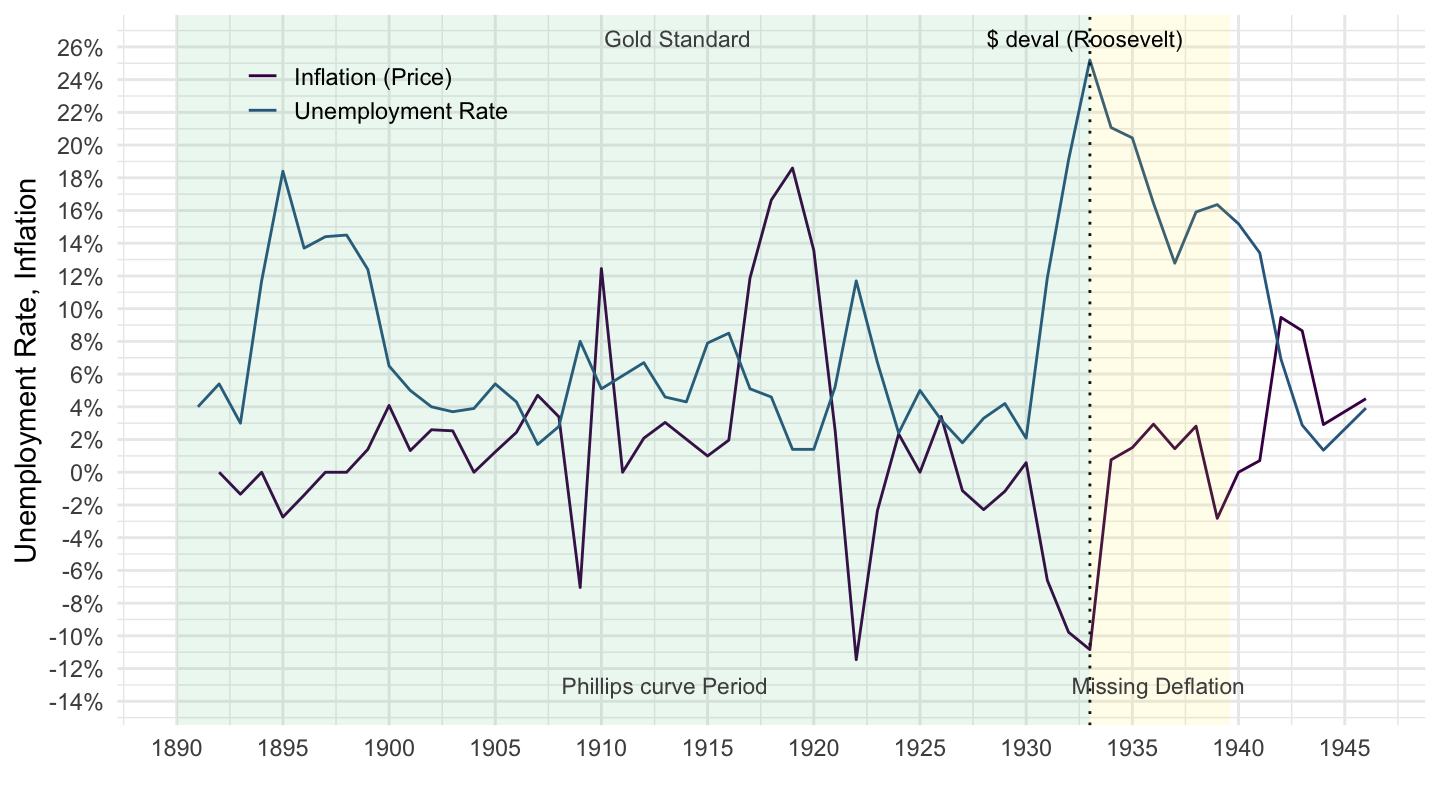
mutate(variable_desc = case_when(variable == "UNUSAM" ~ "Unemployment Rate",
variable == "price_inflation" ~ "Inflation (Price)")) %>%
ggplot(.) +
geom_line(aes(x = date, y = value, color = variable_desc)) +
ylab("Unemployment Rate, Inflation") + xlab("") +
scale_color_manual(values = c(viridis(4)[1], viridis(4)[2])) +
scale_linetype_manual(values = c("solid", "solid")) +
scale_x_date(breaks = as.Date(paste0(seq(1850, 2020, 5), "-01-01")),
labels = date_format("%Y")) +
scale_y_continuous(breaks = 0.01*seq(-50, 50, 2),
labels = scales::percent_format(accuracy = 1)) +
theme_minimal() +
theme(legend.position = c(0.2, 0.90),
legend.title = element_blank(),
legend.key.size = unit(0.9, 'lines')) +
geom_vline(xintercept = as.Date("1933-01-01"), linetype = "dotted", color = "black") +
geom_rect(data = data_frame(start = as.Date("1933-01-01"),
end = as.Date("1939-08-15")),
aes(xmin = start, xmax = end, ymin = -Inf, ymax = +Inf),
fill = viridis(4)[4], alpha = 0.1) +
geom_rect(data = data_frame(start = as.Date("1890-01-01"),
end = as.Date("1933-01-01")),
aes(xmin = start, xmax = end, ymin = -Inf, ymax = +Inf),
fill = viridis(4)[3], alpha = 0.1) +
geom_text(data = data_frame(start = c(1910, 1908, 1932, 1928) %>% paste0("-01-01") %>% as.Date,
percent = c(0.26, -0.135, -0.135, 0.26),
name = c("Gold Standard", "Phillips curve Period", "Missing Deflation", "$ deval (Roosevelt)"),
color_new = c("black", "black", "black", grey(0.3))),
aes(x = start, y = percent, label = name),
size = 3, vjust = 0, hjust = 0, nudge_x = 50, color = c(grey(0.3), grey(0.3), grey(0.3), "black"))