
Last observation: 2025 (N = 60)
First observation: 1995 (N = 34)
Last data update: 09 oct. 2026, 22:00
Last compile: 09 oct. 2026, 23:35
List of Countries: Austria, Belgium, Cyprus, Estonia, Finland, France, Germany, Greece, Ireland, Italy, Latvia, Lithuania, Luxembourg, Malta, The Netherlands, Portugal, Slovakia, Slovenia and Spain
tipsna62 |>
  filter(geo %in% c("AT", "BE", "CY", "EE", "FI", "FR", "DE", "EL", "IE",
                    "IT", "LV", "LT", "LU", "MT", "NL", "PT", "SK", "SI", "ES")) |>

  group_by(geo, Geo) |>
  summarise(Nobs = n()) %>%
{if (is_html_output()) datatable(., filter = 'top', rownames = F) else .}tipsna62 |>
filter(geo %in% c("FR", "DE", "PT"),
unit == "THS_PER") |>
select(geo, Geo, time, values) |>
year_to_date() |>
mutate(values = values/100) |>
add_flag_color("Geo") |>
ggplot() + geom_line() + theme_minimal() +
aes(x = date, y = values, color = color) +
scale_color_identity() + add_flags +
scale_x_date(breaks = as.Date(paste0(seq(1960, 2100, 2), "-01-01")),
labels = date_format("%Y")) +
theme(legend.position = c(0.3, 0.85),
legend.title = element_blank()) +
xlab("") + ylab("Employees domestic concept")
tipsna62 |>
  filter(geo %in% c("DE", "FR", "PT"),
         unit == "THS_PER") |>
  select(geo, Geo, time, emp = values) |>
  left_join(tipslm13 |>
              filter(geo %in% c("DE", "FR", "PT")) |>
              select(geo, time, comp = values),
            by = c("geo", "time")) |>
  year_to_date() |>

  mutate(values = comp/emp) |>
  add_flag_color("Geo") |>
  ggplot() + geom_line() + theme_minimal()  +
  aes(x = date, y = values, color = color) +
  scale_color_identity() + add_flags +
  scale_x_date(breaks = as.Date(paste0(seq(1960, 2100, 2), "-01-01")),
               labels = date_format("%Y")) +
  scale_y_continuous(breaks = seq(0, 100, 5),
               labels = dollar_format(suffix = "K€", prefix = "")) +
  theme(legend.position = c(0.3, 0.85),
        legend.title = element_blank()) +
  xlab("") + ylab("Compensation of employees Per Employee")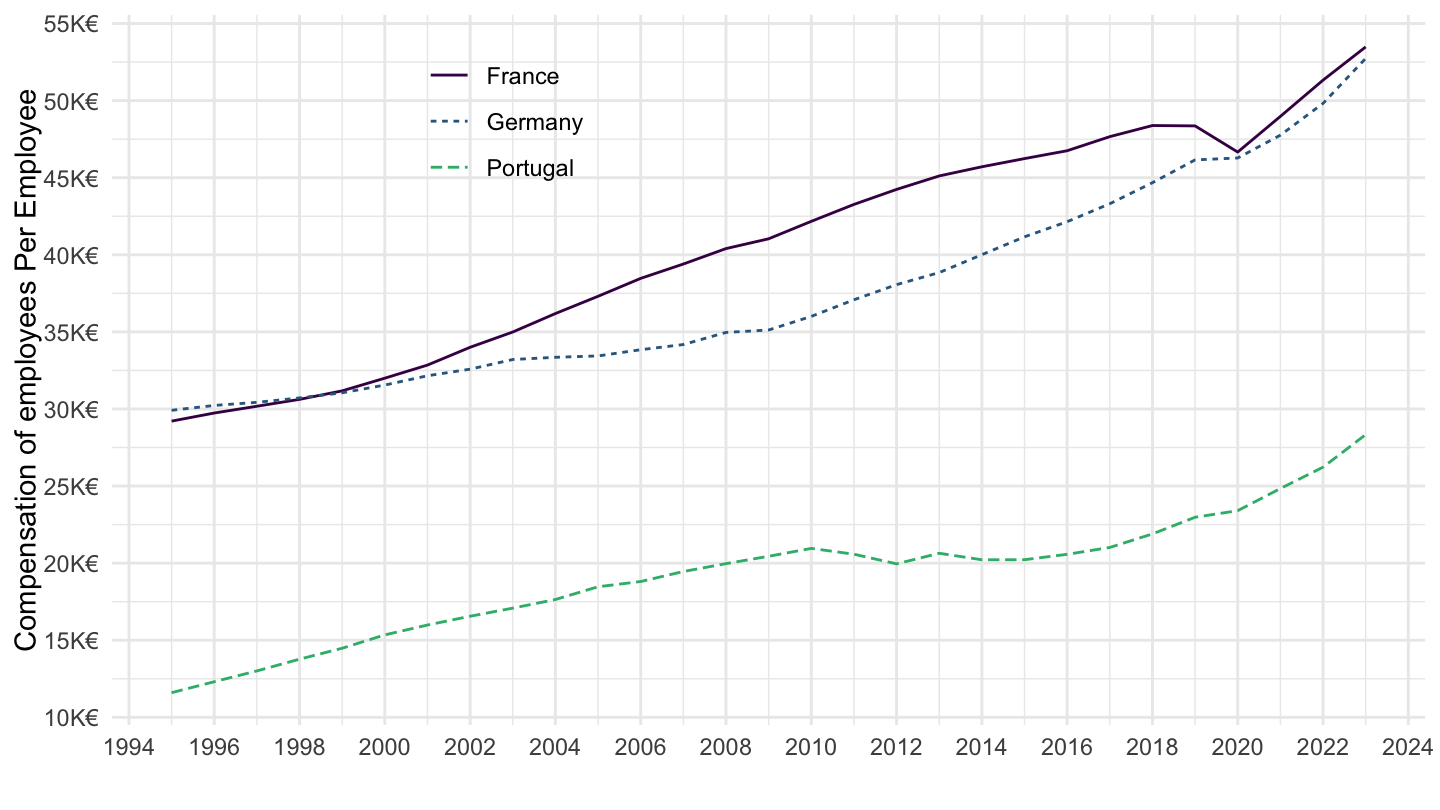
tipsna62 |>
  filter(geo %in% c("FR", "IT", "MT"),
         unit == "THS_PER") |>
  select(geo, Geo, time, emp = values) |>
  left_join(tipslm13 |>
              filter(geo %in% c("IT", "FR", "MT")) |>
              select(geo, time, comp = values),
            by = c("geo", "time")) |>
  year_to_date() |>

  mutate(values = comp/emp) |>
  add_flag_color("Geo") |>
  ggplot() + geom_line() + theme_minimal()  +
  aes(x = date, y = values, color = color) +
  scale_color_identity() + add_flags +
  scale_x_date(breaks = as.Date(paste0(seq(1960, 2100, 2), "-01-01")),
               labels = date_format("%Y")) +
  scale_y_continuous(breaks = seq(0, 100, 5),
               labels = dollar_format(suffix = "K€", prefix = "")) +
  theme(legend.position = c(0.3, 0.85),
        legend.title = element_blank()) +
  xlab("") + ylab("Compensation of employees Per Employee")
tipsna62 |>
  filter(geo %in% c("DK", "SE", "PL"),
         unit == "THS_PER") |>
  select(geo, Geo, time, emp = values) |>
  left_join(tipslm13 |>
              filter(geo %in% c("DK", "SE", "PL")) |>
              select(geo, time, comp = values),
            by = c("geo", "time")) |>
  year_to_date() |>

  mutate(values = comp/emp) |>
  add_flag_color("Geo") |>
  ggplot() + geom_line() + theme_minimal()  +
  aes(x = date, y = values, color = color) +
  scale_color_identity() + add_flags +
  scale_x_date(breaks = as.Date(paste0(seq(1960, 2100, 2), "-01-01")),
               labels = date_format("%Y")) +
  scale_y_continuous(breaks = seq(0, 100, 5),
               labels = dollar_format(suffix = "K€", prefix = "")) +
  theme(legend.position = c(0.3, 0.85),
        legend.title = element_blank()) +
  xlab("") + ylab("Compensation of employees Per Employee")
tipsna62 |>
  filter(geo %in% c("AT", "NL", "DE"),
         unit == "THS_PER") |>
  select(geo, Geo, time, emp = values) |>
  left_join(tipslm13 |>
              filter(geo %in% c("AT", "NL", "DE")) |>
              select(geo, time, comp = values),
            by = c("geo", "time")) |>
  year_to_date() |>

  mutate(values = comp/emp) |>
  add_flag_color("Geo") |>
  ggplot() + geom_line() + theme_minimal()  +
  aes(x = date, y = values, color = color) +
  scale_color_identity() + add_flags +
  scale_x_date(breaks = as.Date(paste0(seq(1960, 2100, 2), "-01-01")),
               labels = date_format("%Y")) +
  scale_y_continuous(breaks = 0.01*seq(0, 100, 1),
               labels = percent_format()) +
  theme(legend.position = c(0.3, 0.85),
        legend.title = element_blank()) +
  xlab("") + ylab("Compensation of employees Per Employee")
tipsna62 |>
  filter(geo %in% c("DE", "FR", "PT"),
         unit == "THS_PER") |>
  select(geo, Geo, time, emp = values) |>
  left_join(tipslm13 |>
              filter(geo %in% c("DE", "FR", "PT")) |>
              select(geo, time, comp = values),
            by = c("geo", "time")) |>
  year_to_date() |>

  group_by(geo) |>
  mutate(comp_emp = comp/emp,
         comp_emp_d1 = comp_emp/lag(comp_emp, 1)-1) |>
  mutate(values = comp_emp_d1) |>
  add_flag_color("Geo") |>
  ggplot() + geom_line() + theme_minimal()  +
  aes(x = date, y = values, color = color) +
  scale_color_identity() + add_flags +
  scale_x_date(breaks = as.Date(paste0(seq(1960, 2100, 2), "-01-01")),
               labels = date_format("%Y")) +
  scale_y_continuous(breaks = 0.01*seq(-100, 100, 1),
                     labels = percent_format(accuracy = 1)) +
  theme(legend.position = c(0.7, 0.9),
        legend.title = element_blank()) +
  xlab("") + ylab("Growth of Compensation Per Employee")
tipsna62 |>
  filter(geo %in% c("FR", "IT", "MT"),
         unit == "THS_PER") |>
  select(geo, Geo, time, emp = values) |>
  left_join(tipslm13 |>
              filter(geo %in% c("IT", "FR", "MT")) |>
              select(geo, time, comp = values),
            by = c("geo", "time")) |>
  year_to_date() |>

  group_by(geo) |>
  mutate(comp_emp = comp/emp,
         comp_emp_d1 = comp_emp/lag(comp_emp, 1)-1) |>
  mutate(values = comp_emp_d1) |>
  add_flag_color("Geo") |>
  ggplot() + geom_line() + theme_minimal()  +
  aes(x = date, y = values, color = color) +
  scale_color_identity() + add_flags +
  scale_x_date(breaks = as.Date(paste0(seq(1960, 2100, 2), "-01-01")),
               labels = date_format("%Y")) +
  scale_y_continuous(breaks = 0.01*seq(-100, 100, 1),
                     labels = percent_format(accuracy = 1)) +
  theme(legend.position = c(0.7, 0.9),
        legend.title = element_blank()) +
  xlab("") + ylab("Growth of Compensation Per Employee")
tipsna62 |>
  filter(geo %in% c("DK", "SE", "PL"),
         unit == "THS_PER") |>
  select(geo, Geo, time, emp = values) |>
  left_join(tipslm13 |>
              filter(geo %in% c("DK", "SE", "PL")) |>
              select(geo, time, comp = values),
            by = c("geo", "time")) |>
  year_to_date() |>

  group_by(geo) |>
  mutate(comp_emp = comp/emp,
         comp_emp_d1 = comp_emp/lag(comp_emp, 1)-1) |>
  mutate(values = comp_emp_d1) |>
  add_flag_color("Geo") |>
  ggplot() + geom_line() + theme_minimal()  +
  aes(x = date, y = values, color = color) +
  scale_color_identity() + add_flags +
  scale_x_date(breaks = as.Date(paste0(seq(1960, 2100, 2), "-01-01")),
               labels = date_format("%Y")) +
  scale_y_continuous(breaks = 0.01*seq(-100, 100, 5),
                     labels = percent_format(accuracy = 1)) +
  theme(legend.position = c(0.7, 0.9),
        legend.title = element_blank()) +
  xlab("") + ylab("Growth of Compensation Per Employee")
tipsna62 |>
  filter(geo %in% c("AT", "NL", "DE"),
         unit == "THS_PER") |>
  select(geo, Geo, time, emp = values) |>
  left_join(tipslm13 |>
              filter(geo %in% c("AT", "NL", "DE")) |>
              select(geo, time, comp = values),
            by = c("geo", "time")) |>
  year_to_date() |>

  group_by(geo) |>
  mutate(comp_emp = comp/emp,
         comp_emp_d1 = comp_emp/lag(comp_emp, 1)-1) |>
  mutate(values = comp_emp_d1) |>
  add_flag_color("Geo") |>
  ggplot() + geom_line() + theme_minimal()  +
  aes(x = date, y = values, color = color) +
  scale_color_identity() + add_flags +
  scale_x_date(breaks = as.Date(paste0(seq(1960, 2100, 2), "-01-01")),
               labels = date_format("%Y")) +
  scale_y_continuous(breaks = 0.01*seq(-100, 100, 1),
                     labels = percent_format(accuracy = 1)) +
  theme(legend.position = c(0.7, 0.9),
        legend.title = element_blank()) +
  xlab("") + ylab("Growth of Compensation Per Employee")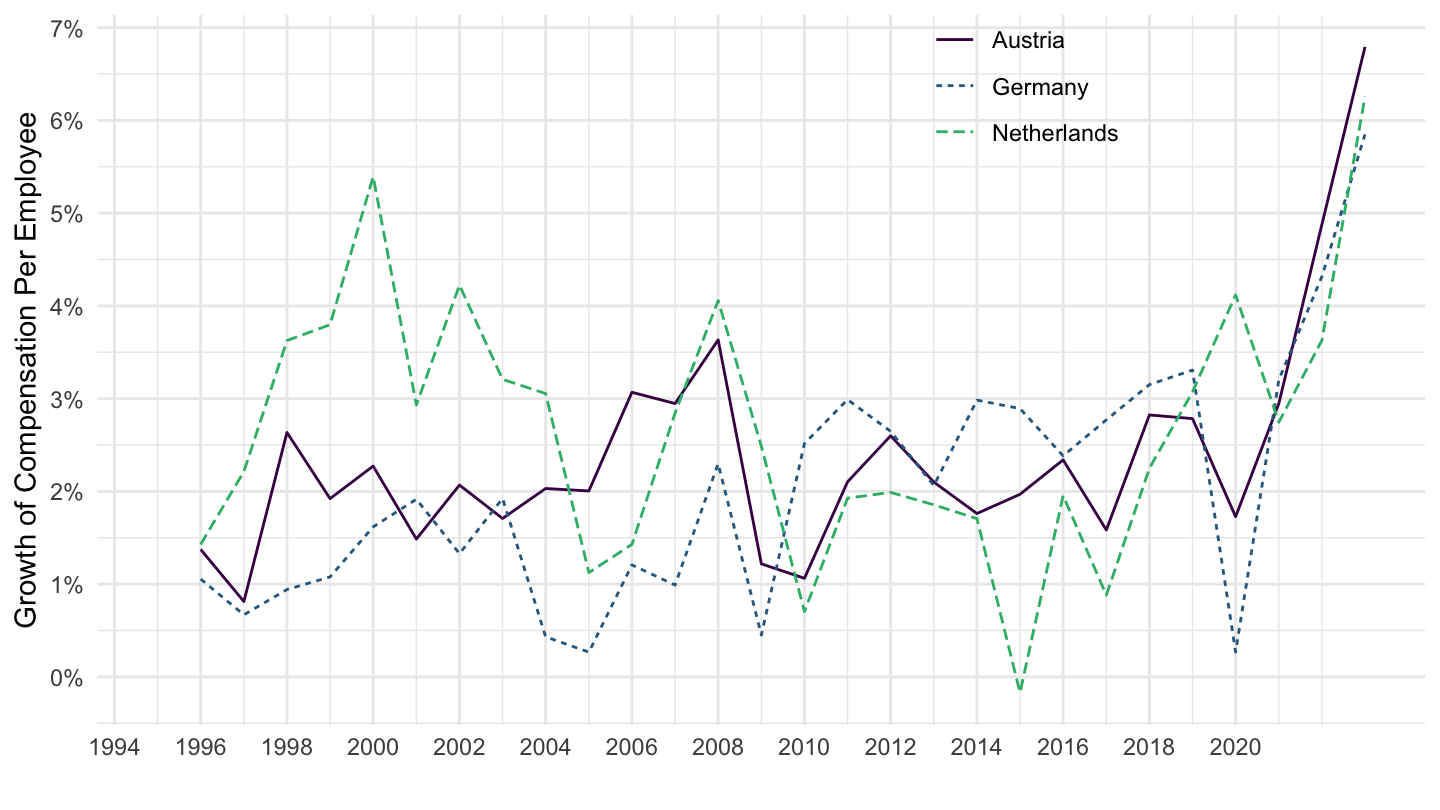
tipsna62tipslm13une_rt_atipsna62 |>
filter(geo %in% c("AT"),
unit == "THS_PER") |>
select(geo, Geo, time, emp = values) |>
left_join(tipslm13 |>
select(geo, time, comp = values),
by = c("geo", "time")) |>
left_join(une_rt_a |>
filter(age == "Y20-64",
sex == "T",
unit == "PC_ACT") |>
select(geo, time, unr = values),
by = c("geo", "time")) |>
mutate(comp_emp = comp/emp,
comp_emp_d1 = comp_emp/lag(comp_emp, 1)-1) |>
year_to_date() |>
transmute(date, comp_emp_d1=100*comp_emp_d1, unr = unr) |>
gather(variable, value, -date) |>
mutate(Variable = case_when(variable == "comp_emp_d1" ~ "Wage Inflation (%)",
variable == "unr" ~ "Unemployment Rate (%)")) |>
ggplot() + geom_line() + theme_minimal() +
aes(x = date, y = value/100, color = Variable, linetype = Variable) +
scale_color_manual(values = viridis(3)[1:2]) +
scale_x_date(breaks = as.Date(paste0(seq(1960, 2100, 2), "-01-01")),
labels = date_format("%Y")) +
scale_y_continuous(breaks = 0.01*seq(-100, 100, 1),
labels = percent_format(accuracy = 1)) +
theme(legend.position = c(0.2, 0.85),
legend.title = element_blank()) +
xlab("") + ylab("Unemployment Rate, Wage Inflation (%)")
tipsna62 |>
  filter(geo %in% c("BE"),
         unit == "THS_PER") |>
  select(geo, Geo, time, emp = values) |>
  left_join(tipslm13 |>
              select(geo, time, comp = values),
            by = c("geo", "time")) |>
  left_join(une_rt_a |>
              filter(age == "Y20-64",
                     sex == "T",
                     unit == "PC_ACT") |>
              select(geo, time, unr = values),
            by = c("geo", "time")) |>
  mutate(comp_emp = comp/emp,
         comp_emp_d1 = comp_emp/lag(comp_emp, 1)-1) |>
  year_to_date() |>
  transmute(date, comp_emp_d1=100*comp_emp_d1, unr = unr) |>
  gather(variable, value, -date) |>
  mutate(Variable = case_when(variable == "comp_emp_d1" ~ "Wage Inflation (%)",
                              variable == "unr" ~ "Unemployment Rate (%)")) |>
  ggplot() + geom_line() + theme_minimal()  +
  aes(x = date, y = value/100, color = Variable, linetype = Variable) +
  scale_color_manual(values = viridis(3)[1:2]) +
  scale_x_date(breaks = as.Date(paste0(seq(1960, 2100, 2), "-01-01")),
               labels = date_format("%Y")) +
  scale_y_continuous(breaks = 0.01*seq(-100, 100, 1),
                     labels = percent_format(accuracy = 1)) +
  theme(legend.position = c(0.2, 0.85),
        legend.title = element_blank()) +
  xlab("") + ylab("Unemployment Rate, Wage Inflation (%)")
tipsna62 |>
  filter(geo %in% c("CY"),
         unit == "THS_PER") |>
  select(geo, Geo, time, emp = values) |>
  left_join(tipslm13 |>
              select(geo, time, comp = values),
            by = c("geo", "time")) |>
  left_join(une_rt_a |>
              filter(age == "Y20-64",
                     sex == "T",
                     unit == "PC_ACT") |>
              select(geo, time, unr = values),
            by = c("geo", "time")) |>
  mutate(comp_emp = comp/emp,
         comp_emp_d1 = comp_emp/lag(comp_emp, 1)-1) |>
  year_to_date() |>
  transmute(date, comp_emp_d1=100*comp_emp_d1, unr = unr) |>
  gather(variable, value, -date) |>
  mutate(Variable = case_when(variable == "comp_emp_d1" ~ "Wage Inflation (%)",
                              variable == "unr" ~ "Unemployment Rate (%)")) |>
  ggplot() + geom_line() + theme_minimal()  +
  aes(x = date, y = value/100, color = Variable, linetype = Variable) +
  scale_color_manual(values = viridis(3)[1:2]) +
  scale_x_date(breaks = as.Date(paste0(seq(1960, 2100, 2), "-01-01")),
               labels = date_format("%Y")) +
  scale_y_continuous(breaks = 0.01*seq(-100, 100, 1),
                     labels = percent_format(accuracy = 1)) +
  theme(legend.position = c(0.2, 0.85),
        legend.title = element_blank()) +
  xlab("") + ylab("Unemployment Rate, Wage Inflation (%)")
tipsna62 |>
  filter(geo %in% c("DE"),
         unit == "THS_PER") |>
  select(geo, Geo, time, emp = values) |>
  left_join(tipslm13 |>
              select(geo, time, comp = values),
            by = c("geo", "time")) |>
  left_join(une_rt_a |>
              filter(age == "Y20-64",
                     sex == "T",
                     unit == "PC_ACT") |>
              select(geo, time, unr = values),
            by = c("geo", "time")) |>
  mutate(comp_emp = comp/emp,
         comp_emp_d1 = comp_emp/lag(comp_emp, 1)-1) |>
  year_to_date() |>
  transmute(date, comp_emp_d1=100*comp_emp_d1, unr = unr) |>
  gather(variable, value, -date) |>
  mutate(Variable = case_when(variable == "comp_emp_d1" ~ "Wage Inflation (%)",
                              variable == "unr" ~ "Unemployment Rate (%)")) |>
  ggplot() + geom_line() + theme_minimal()  +
  aes(x = date, y = value/100, color = Variable, linetype = Variable) +
  scale_color_manual(values = viridis(3)[1:2]) +
  scale_x_date(breaks = as.Date(paste0(seq(1960, 2100, 2), "-01-01")),
               labels = date_format("%Y")) +
  scale_y_continuous(breaks = 0.01*seq(-100, 100, 1),
                     labels = percent_format(accuracy = 1)) +
  theme(legend.position = c(0.8, 0.85),
        legend.title = element_blank()) +
  xlab("") + ylab("Unemployment Rate, Wage Inflation (%)")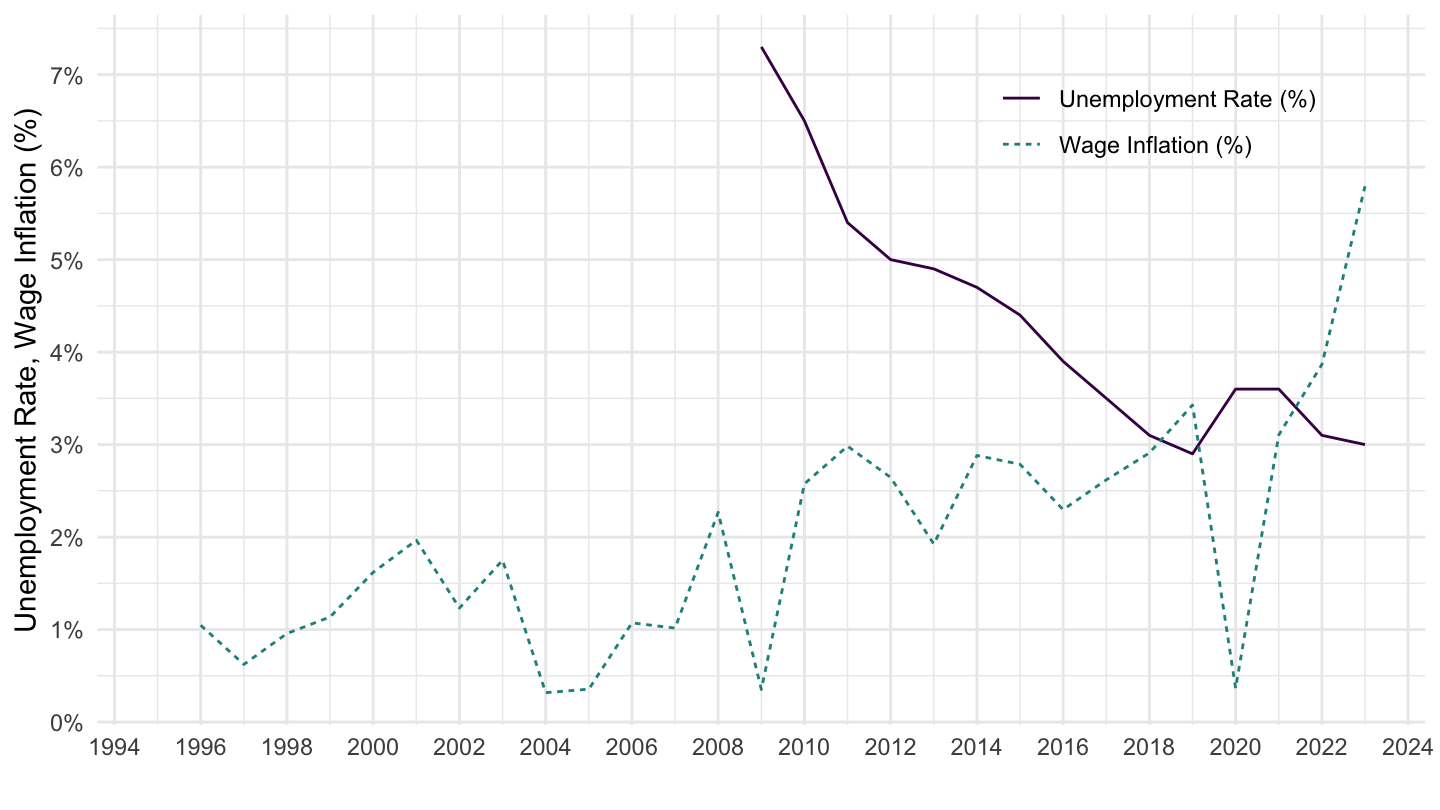
tipsna62 |>
  filter(geo %in% c("EE"),
         unit == "THS_PER") |>
  select(geo, Geo, time, emp = values) |>
  left_join(tipslm13 |>
              select(geo, time, comp = values),
            by = c("geo", "time")) |>
  left_join(une_rt_a |>
              filter(age == "Y20-64",
                     sex == "T",
                     unit == "PC_ACT") |>
              select(geo, time, unr = values),
            by = c("geo", "time")) |>
  mutate(comp_emp = comp/emp,
         comp_emp_d1 = comp_emp/lag(comp_emp, 1)-1) |>
  year_to_date() |>
  transmute(date, comp_emp_d1=100*comp_emp_d1, unr = unr) |>
  gather(variable, value, -date) |>
  mutate(Variable = case_when(variable == "comp_emp_d1" ~ "Wage Inflation (%)",
                              variable == "unr" ~ "Unemployment Rate (%)")) |>
  ggplot() + geom_line() + theme_minimal()  +
  aes(x = date, y = value/100, color = Variable, linetype = Variable) +
  scale_color_manual(values = viridis(3)[1:2]) +
  scale_x_date(breaks = as.Date(paste0(seq(1960, 2100, 2), "-01-01")),
               labels = date_format("%Y")) +
  scale_y_continuous(breaks = 0.01*seq(-100, 100, 1),
                     labels = percent_format(accuracy = 1)) +
  theme(legend.position = c(0.8, 0.85),
        legend.title = element_blank()) +
  xlab("") + ylab("Unemployment Rate, Wage Inflation (%)")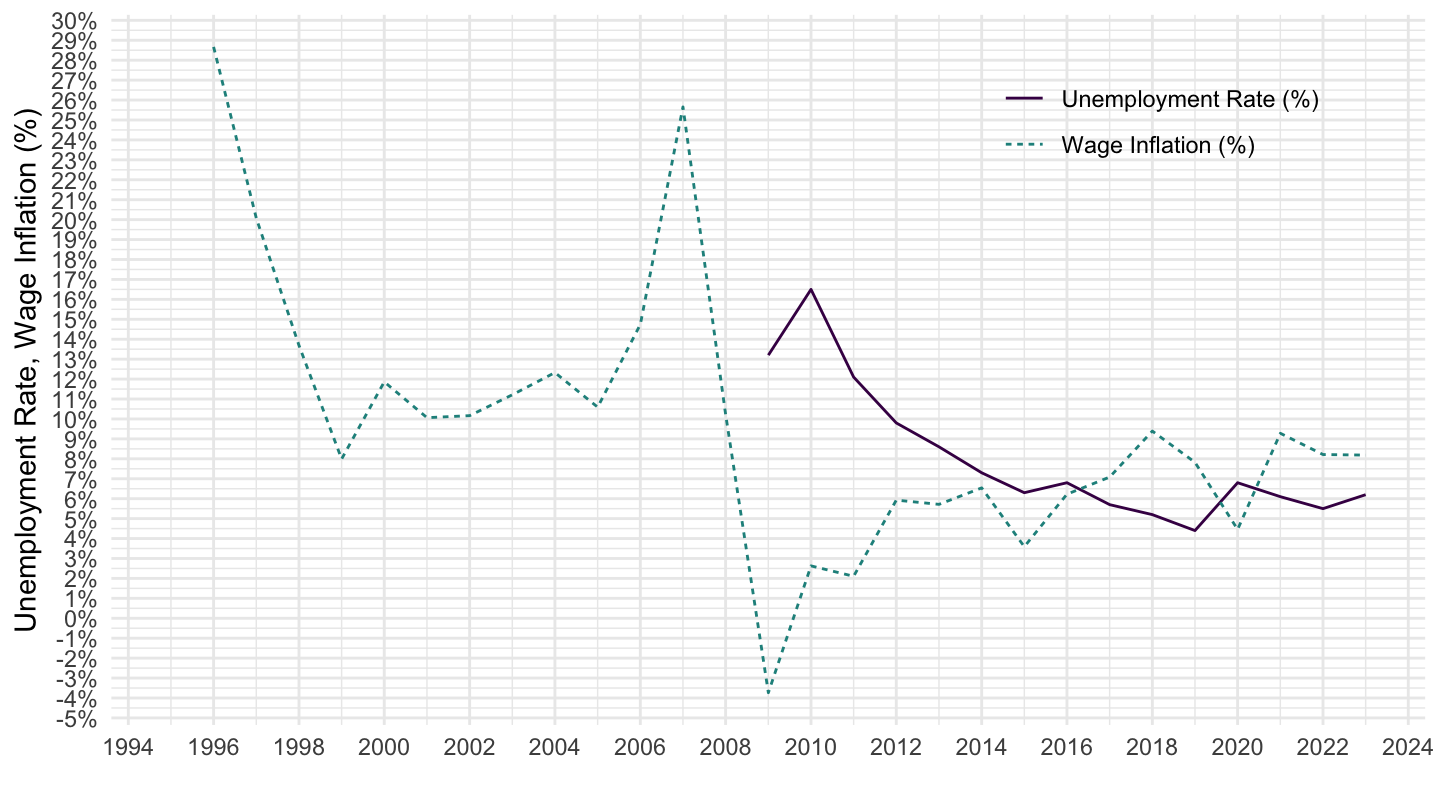
tipsna62 |>
  filter(geo %in% c("EL"),
         unit == "THS_PER") |>
  select(geo, Geo, time, emp = values) |>
  left_join(tipslm13 |>
              select(geo, time, comp = values),
            by = c("geo", "time")) |>
  left_join(une_rt_a |>
              filter(age == "Y20-64",
                     sex == "T",
                     unit == "PC_ACT") |>
              select(geo, time, unr = values),
            by = c("geo", "time")) |>
  mutate(comp_emp = comp/emp,
         comp_emp_d1 = comp_emp/lag(comp_emp, 1)-1) |>
  year_to_date() |>
  transmute(date, comp_emp_d1=100*comp_emp_d1, unr = unr) |>
  gather(variable, value, -date) |>
  mutate(Variable = case_when(variable == "comp_emp_d1" ~ "Wage Inflation (%)",
                              variable == "unr" ~ "Unemployment Rate (%)")) |>
  ggplot() + geom_line() + theme_minimal()  +
  aes(x = date, y = value/100, color = Variable, linetype = Variable) +
  scale_color_manual(values = viridis(3)[1:2]) +
  scale_x_date(breaks = as.Date(paste0(seq(1960, 2100, 2), "-01-01")),
               labels = date_format("%Y")) +
  scale_y_continuous(breaks = 0.01*seq(-100, 100, 1),
                     labels = percent_format(accuracy = 1)) +
  theme(legend.position = c(0.2, 0.85),
        legend.title = element_blank()) +
  xlab("") + ylab("Unemployment Rate, Wage Inflation (%)")
tipsna62 |>
  filter(geo %in% c("ES"),
         unit == "THS_PER") |>
  select(geo, Geo, time, emp = values) |>
  left_join(tipslm13 |>
              select(geo, time, comp = values),
            by = c("geo", "time")) |>
  left_join(une_rt_a |>
              filter(age == "Y20-64",
                     sex == "T",
                     unit == "PC_ACT") |>
              select(geo, time, unr = values),
            by = c("geo", "time")) |>
  mutate(comp_emp = comp/emp,
         comp_emp_d1 = comp_emp/lag(comp_emp, 1)-1) |>
  year_to_date() |>
  transmute(date, comp_emp_d1=100*comp_emp_d1, unr = unr) |>
  gather(variable, value, -date) |>
  mutate(Variable = case_when(variable == "comp_emp_d1" ~ "Wage Inflation (%)",
                              variable == "unr" ~ "Unemployment Rate (%)")) |>
  ggplot() + geom_line() + theme_minimal()  +
  aes(x = date, y = value/100, color = Variable, linetype = Variable) +
  scale_color_manual(values = viridis(3)[1:2]) +
  scale_x_date(breaks = as.Date(paste0(seq(1960, 2100, 2), "-01-01")),
               labels = date_format("%Y")) +
  scale_y_continuous(breaks = 0.01*seq(-100, 100, 1),
                     labels = percent_format(accuracy = 1)) +
  theme(legend.position = c(0.2, 0.85),
        legend.title = element_blank()) +
  xlab("") + ylab("Unemployment Rate, Wage Inflation (%)")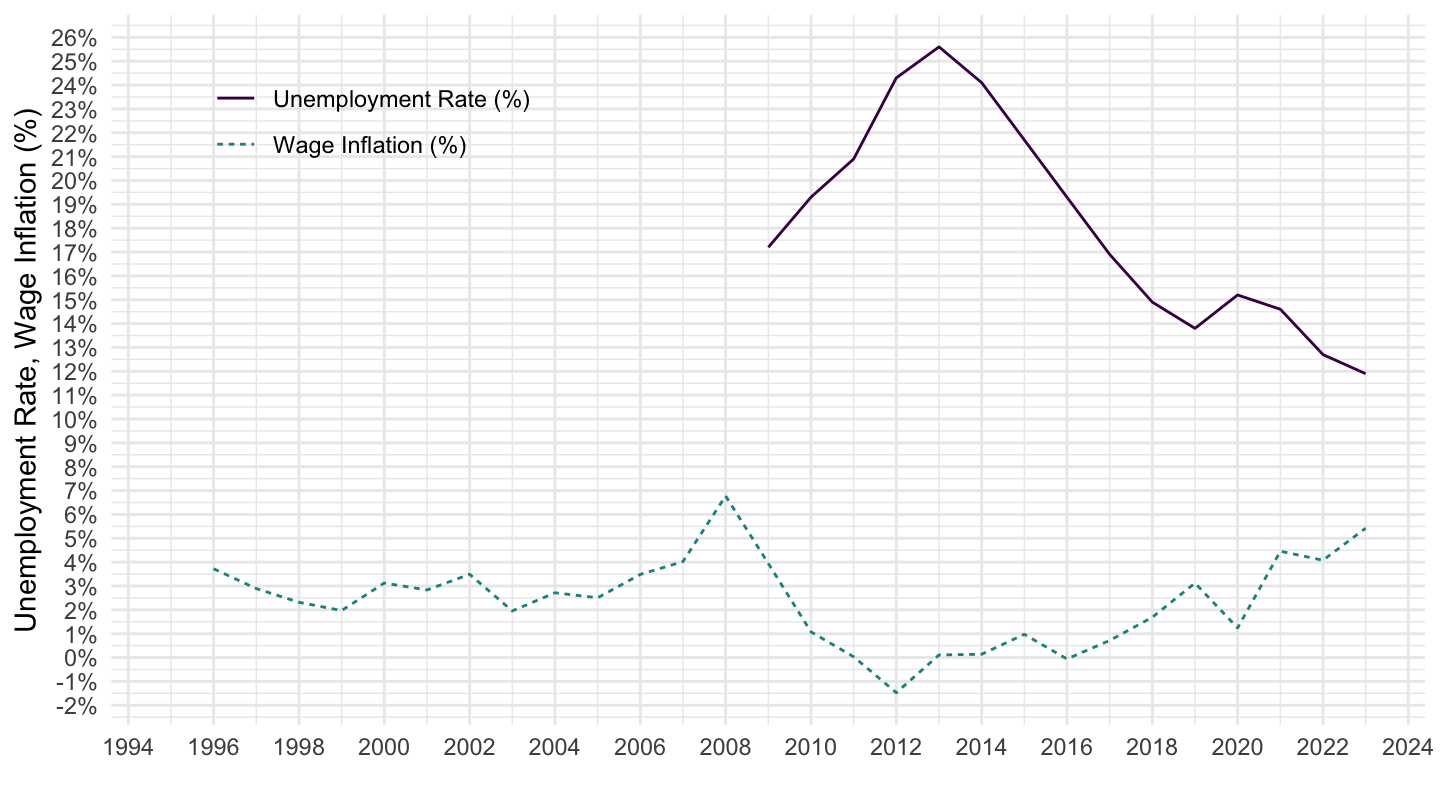
tipsna62 |>
  filter(geo %in% c("FI"),
         unit == "THS_PER") |>
  select(geo, Geo, time, emp = values) |>
  left_join(tipslm13 |>
              select(geo, time, comp = values),
            by = c("geo", "time")) |>
  left_join(une_rt_a |>
              filter(age == "Y20-64",
                     sex == "T",
                     unit == "PC_ACT") |>
              select(geo, time, unr = values),
            by = c("geo", "time")) |>
  mutate(comp_emp = comp/emp,
         comp_emp_d1 = comp_emp/lag(comp_emp, 1)-1) |>
  year_to_date() |>
  transmute(date, comp_emp_d1=100*comp_emp_d1, unr = unr) |>
  gather(variable, value, -date) |>
  mutate(Variable = case_when(variable == "comp_emp_d1" ~ "Wage Inflation (%)",
                              variable == "unr" ~ "Unemployment Rate (%)")) |>
  ggplot() + geom_line() + theme_minimal()  +
  aes(x = date, y = value/100, color = Variable, linetype = Variable) +
  scale_color_manual(values = viridis(3)[1:2]) +
  scale_x_date(breaks = as.Date(paste0(seq(1960, 2100, 2), "-01-01")),
               labels = date_format("%Y")) +
  scale_y_continuous(breaks = 0.01*seq(-100, 100, 1),
                     labels = percent_format(accuracy = 1)) +
  theme(legend.position = c(0.8, 0.85),
        legend.title = element_blank()) +
  xlab("") + ylab("Unemployment Rate, Wage Inflation (%)")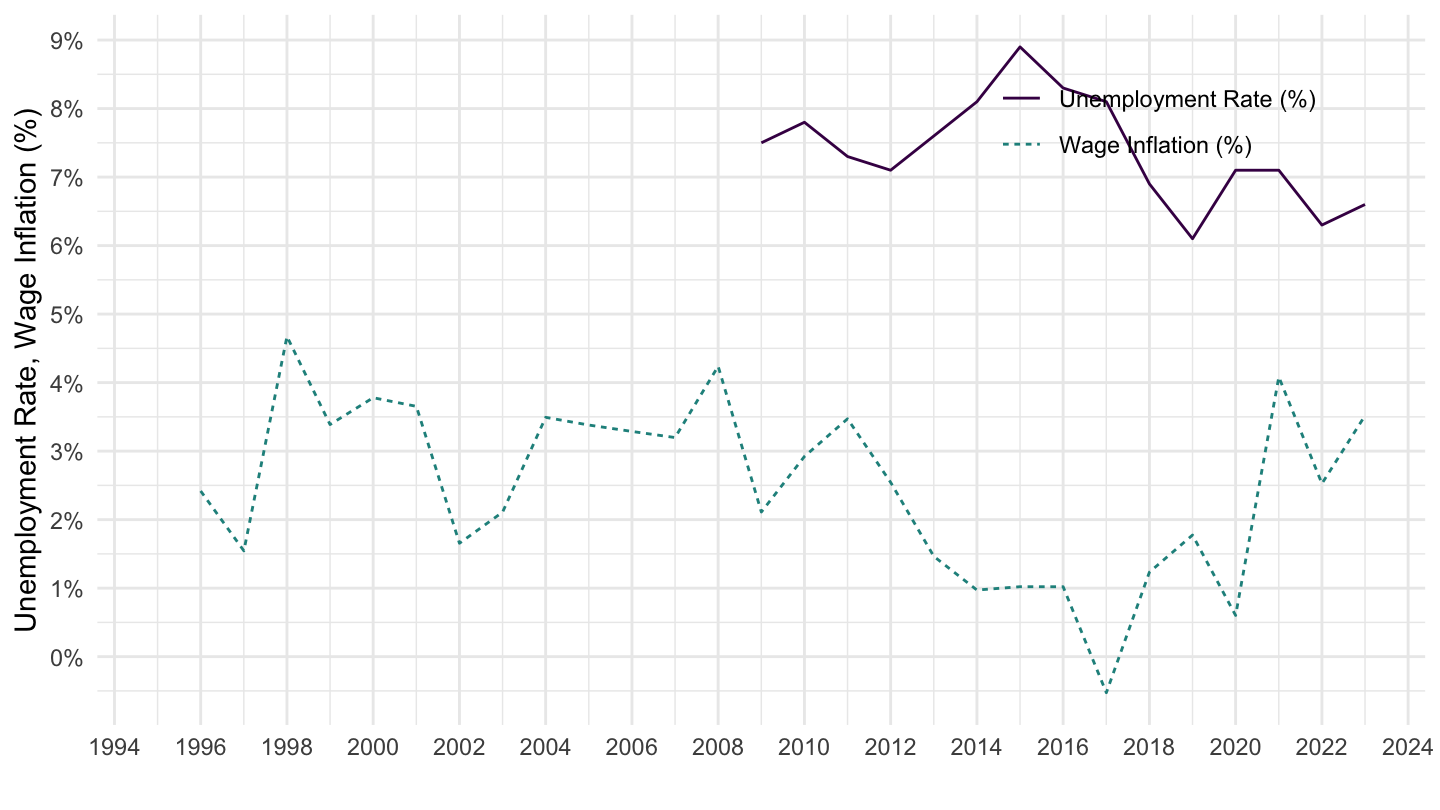
tipsna62 |>
  filter(geo %in% c("FR"),
         unit == "THS_PER") |>
  select(geo, Geo, time, emp = values) |>
  left_join(tipslm13 |>
              select(geo, time, comp = values),
            by = c("geo", "time")) |>
  left_join(une_rt_a |>
              filter(age == "Y20-64",
                     sex == "T",
                     unit == "PC_ACT") |>
              select(geo, time, unr = values),
            by = c("geo", "time")) |>
  mutate(comp_emp = comp/emp,
         comp_emp_d1 = comp_emp/lag(comp_emp, 1)-1) |>
  year_to_date() |>
  transmute(date, comp_emp_d1=100*comp_emp_d1, unr = unr) |>
  gather(variable, value, -date) |>
  mutate(Variable = case_when(variable == "comp_emp_d1" ~ "Wage Inflation (%)",
                              variable == "unr" ~ "Unemployment Rate (%)")) |>
  ggplot() + geom_line() + theme_minimal()  +
  aes(x = date, y = value/100, color = Variable, linetype = Variable) +
  scale_color_manual(values = viridis(3)[1:2]) +
  scale_x_date(breaks = as.Date(paste0(seq(1960, 2100, 2), "-01-01")),
               labels = date_format("%Y")) +
  scale_y_continuous(breaks = 0.01*seq(-100, 100, 1),
                     labels = percent_format(accuracy = 1)) +
  theme(legend.position = c(0.2, 0.85),
        legend.title = element_blank()) +
  xlab("") + ylab("Unemployment Rate, Wage Inflation (%)")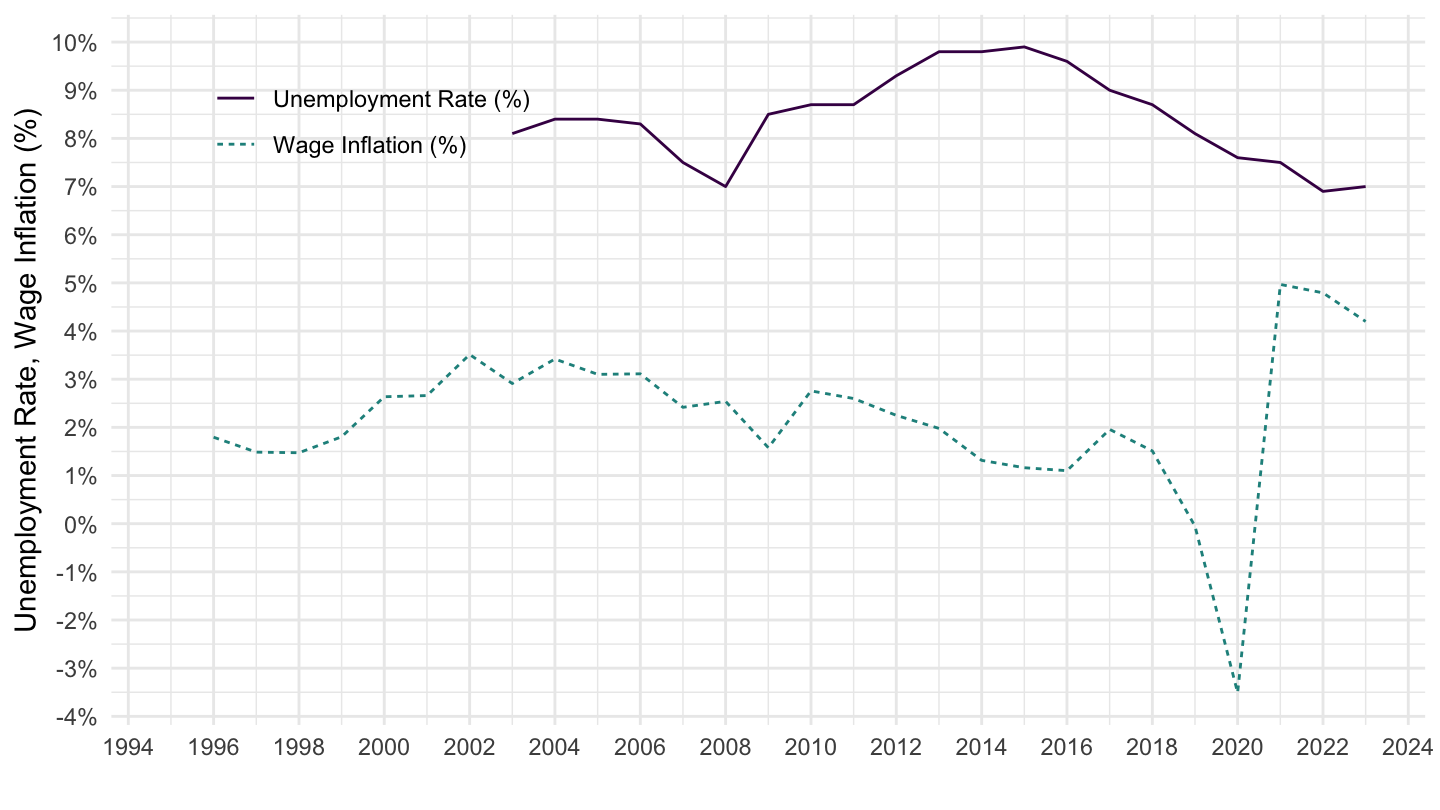
tipsna62 |>
  filter(geo %in% c("IE"),
         unit == "THS_PER") |>
  select(geo, Geo, time, emp = values) |>
  left_join(tipslm13 |>
              select(geo, time, comp = values),
            by = c("geo", "time")) |>
  left_join(une_rt_a |>
              filter(age == "Y20-64",
                     sex == "T",
                     unit == "PC_ACT") |>
              select(geo, time, unr = values),
            by = c("geo", "time")) |>
  mutate(comp_emp = comp/emp,
         comp_emp_d1 = comp_emp/lag(comp_emp, 1)-1) |>
  year_to_date() |>
  transmute(date, comp_emp_d1=100*comp_emp_d1, unr = unr) |>
  gather(variable, value, -date) |>
  mutate(Variable = case_when(variable == "comp_emp_d1" ~ "Wage Inflation (%)",
                              variable == "unr" ~ "Unemployment Rate (%)")) |>
  ggplot() + geom_line() + theme_minimal()  +
  aes(x = date, y = value/100, color = Variable, linetype = Variable) +
  scale_color_manual(values = viridis(3)[1:2]) +
  scale_x_date(breaks = as.Date(paste0(seq(1960, 2100, 2), "-01-01")),
               labels = date_format("%Y")) +
  scale_y_continuous(breaks = 0.01*seq(-100, 100, 1),
                     labels = percent_format(accuracy = 1)) +
  theme(legend.position = c(0.3, 0.85),
        legend.title = element_blank()) +
  xlab("") + ylab("Unemployment Rate, Wage Inflation (%)")
tipsna62 |>
  filter(geo %in% c("IT"),
         unit == "THS_PER") |>
  select(geo, Geo, time, emp = values) |>
  left_join(tipslm13 |>
              select(geo, time, comp = values),
            by = c("geo", "time")) |>
  left_join(une_rt_a |>
              filter(age == "Y20-64",
                     sex == "T",
                     unit == "PC_ACT") |>
              select(geo, time, unr = values),
            by = c("geo", "time")) |>
  mutate(comp_emp = comp/emp,
         comp_emp_d1 = comp_emp/lag(comp_emp, 1)-1) |>
  year_to_date() |>
  transmute(date, comp_emp_d1=100*comp_emp_d1, unr = unr) |>
  gather(variable, value, -date) |>
  mutate(Variable = case_when(variable == "comp_emp_d1" ~ "Wage Inflation (%)",
                              variable == "unr" ~ "Unemployment Rate (%)")) |>
  ggplot() + geom_line() + theme_minimal()  +
  aes(x = date, y = value/100, color = Variable, linetype = Variable) +
  scale_color_manual(values = viridis(3)[1:2]) +
  scale_x_date(breaks = as.Date(paste0(seq(1960, 2100, 2), "-01-01")),
               labels = date_format("%Y")) +
  scale_y_continuous(breaks = 0.01*seq(-100, 100, 1),
                     labels = percent_format(accuracy = 1)) +
  theme(legend.position = c(0.4, 0.9),
        legend.title = element_blank()) +
  xlab("") + ylab("Unemployment Rate, Wage Inflation (%)")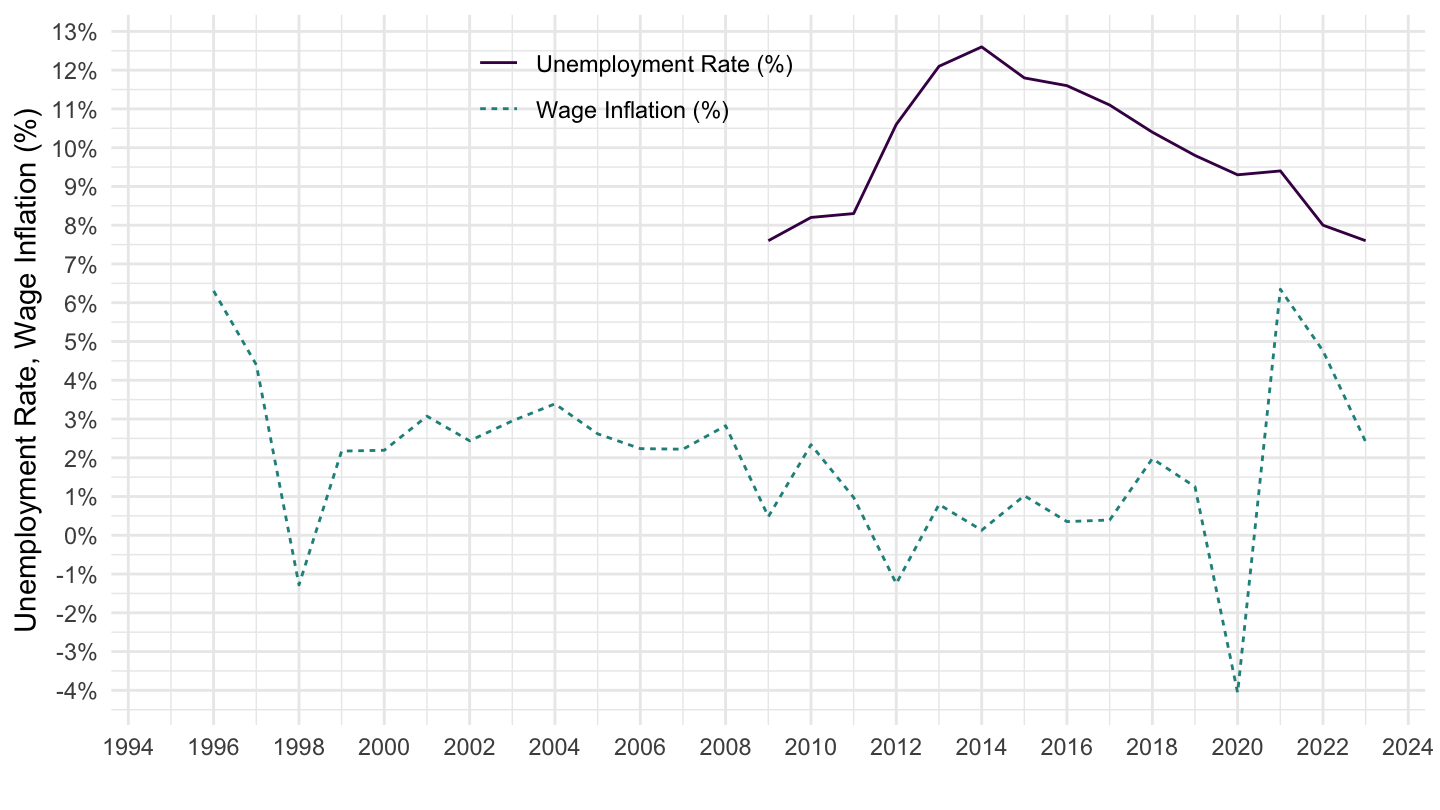
tipsna62 |>
  filter(geo %in% c("LT"),
         unit == "THS_PER") |>
  select(geo, Geo, time, emp = values) |>
  left_join(tipslm13 |>
              select(geo, time, comp = values),
            by = c("geo", "time")) |>
  left_join(une_rt_a |>
              filter(age == "Y20-64",
                     sex == "T",
                     unit == "PC_ACT") |>
              select(geo, time, unr = values),
            by = c("geo", "time")) |>
  mutate(comp_emp = comp/emp,
         comp_emp_d1 = comp_emp/lag(comp_emp, 1)-1) |>
  year_to_date() |>
  transmute(date, comp_emp_d1=100*comp_emp_d1, unr = unr) |>
  gather(variable, value, -date) |>
  mutate(Variable = case_when(variable == "comp_emp_d1" ~ "Wage Inflation (%)",
                              variable == "unr" ~ "Unemployment Rate (%)")) |>
  ggplot() + geom_line() + theme_minimal()  +
  aes(x = date, y = value/100, color = Variable, linetype = Variable) +
  scale_color_manual(values = viridis(3)[1:2]) +
  scale_x_date(breaks = as.Date(paste0(seq(1960, 2100, 2), "-01-01")),
               labels = date_format("%Y")) +
  scale_y_continuous(breaks = 0.01*seq(-100, 100, 1),
                     labels = percent_format(accuracy = 1)) +
  theme(legend.position = c(0.4, 0.9),
        legend.title = element_blank()) +
  xlab("") + ylab("Unemployment Rate, Wage Inflation (%)")
tipsna62 |>
  filter(geo %in% c("LU"),
         unit == "THS_PER") |>
  select(geo, Geo, time, emp = values) |>
  left_join(tipslm13 |>
              select(geo, time, comp = values),
            by = c("geo", "time")) |>
  left_join(une_rt_a |>
              filter(age == "Y20-64",
                     sex == "T",
                     unit == "PC_ACT") |>
              select(geo, time, unr = values),
            by = c("geo", "time")) |>
  mutate(comp_emp = comp/emp,
         comp_emp_d1 = comp_emp/lag(comp_emp, 1)-1) |>
  year_to_date() |>
  transmute(date, comp_emp_d1=100*comp_emp_d1, unr = unr) |>
  gather(variable, value, -date) |>
  mutate(Variable = case_when(variable == "comp_emp_d1" ~ "Wage Inflation (%)",
                              variable == "unr" ~ "Unemployment Rate (%)")) |>
  ggplot() + geom_line() + theme_minimal()  +
  aes(x = date, y = value/100, color = Variable, linetype = Variable) +
  scale_color_manual(values = viridis(3)[1:2]) +
  scale_x_date(breaks = as.Date(paste0(seq(1960, 2100, 2), "-01-01")),
               labels = date_format("%Y")) +
  scale_y_continuous(breaks = 0.01*seq(-100, 100, 1),
                     labels = percent_format(accuracy = 1)) +
  theme(legend.position = c(0.4, 0.9),
        legend.title = element_blank()) +
  xlab("") + ylab("Unemployment Rate, Wage Inflation (%)")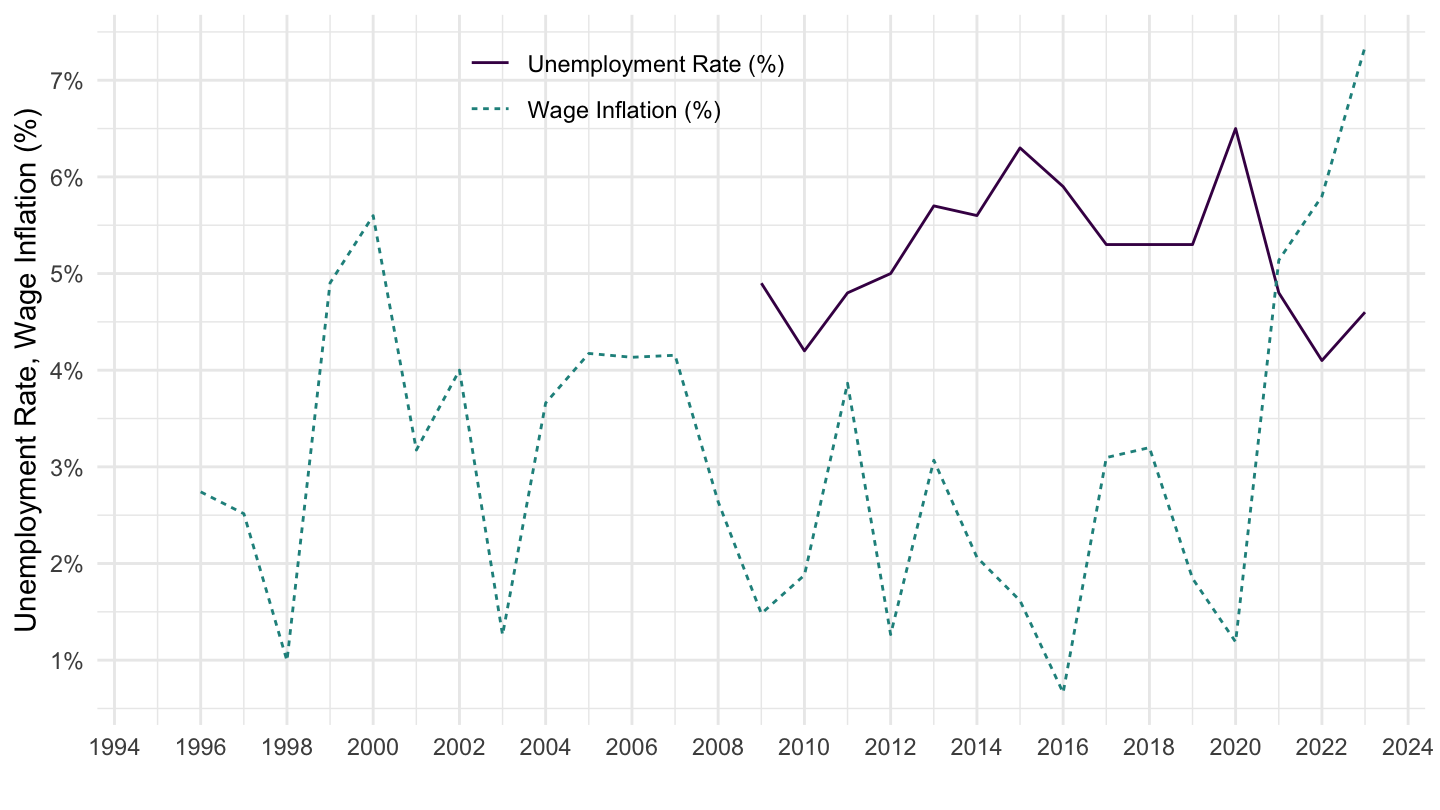
tipsna62 |>
  filter(geo %in% c("LV"),
         unit == "THS_PER") |>
  select(geo, Geo, time, emp = values) |>
  left_join(tipslm13 |>
              select(geo, time, comp = values),
            by = c("geo", "time")) |>
  left_join(une_rt_a |>
              filter(age == "Y20-64",
                     sex == "T",
                     unit == "PC_ACT") |>
              select(geo, time, unr = values),
            by = c("geo", "time")) |>
  mutate(comp_emp = comp/emp,
         comp_emp_d1 = comp_emp/lag(comp_emp, 1)-1) |>
  year_to_date() |>
  transmute(date, comp_emp_d1=100*comp_emp_d1, unr = unr) |>
  gather(variable, value, -date) |>
  mutate(Variable = case_when(variable == "comp_emp_d1" ~ "Wage Inflation (%)",
                              variable == "unr" ~ "Unemployment Rate (%)")) |>
  ggplot() + geom_line() + theme_minimal()  +
  aes(x = date, y = value/100, color = Variable, linetype = Variable) +
  scale_color_manual(values = viridis(3)[1:2]) +
  scale_x_date(breaks = as.Date(paste0(seq(1960, 2100, 2), "-01-01")),
               labels = date_format("%Y")) +
  scale_y_continuous(breaks = 0.01*seq(-100, 100, 1),
                     labels = percent_format(accuracy = 1)) +
  theme(legend.position = c(0.8, 0.9),
        legend.title = element_blank()) +
  xlab("") + ylab("Unemployment Rate, Wage Inflation (%)")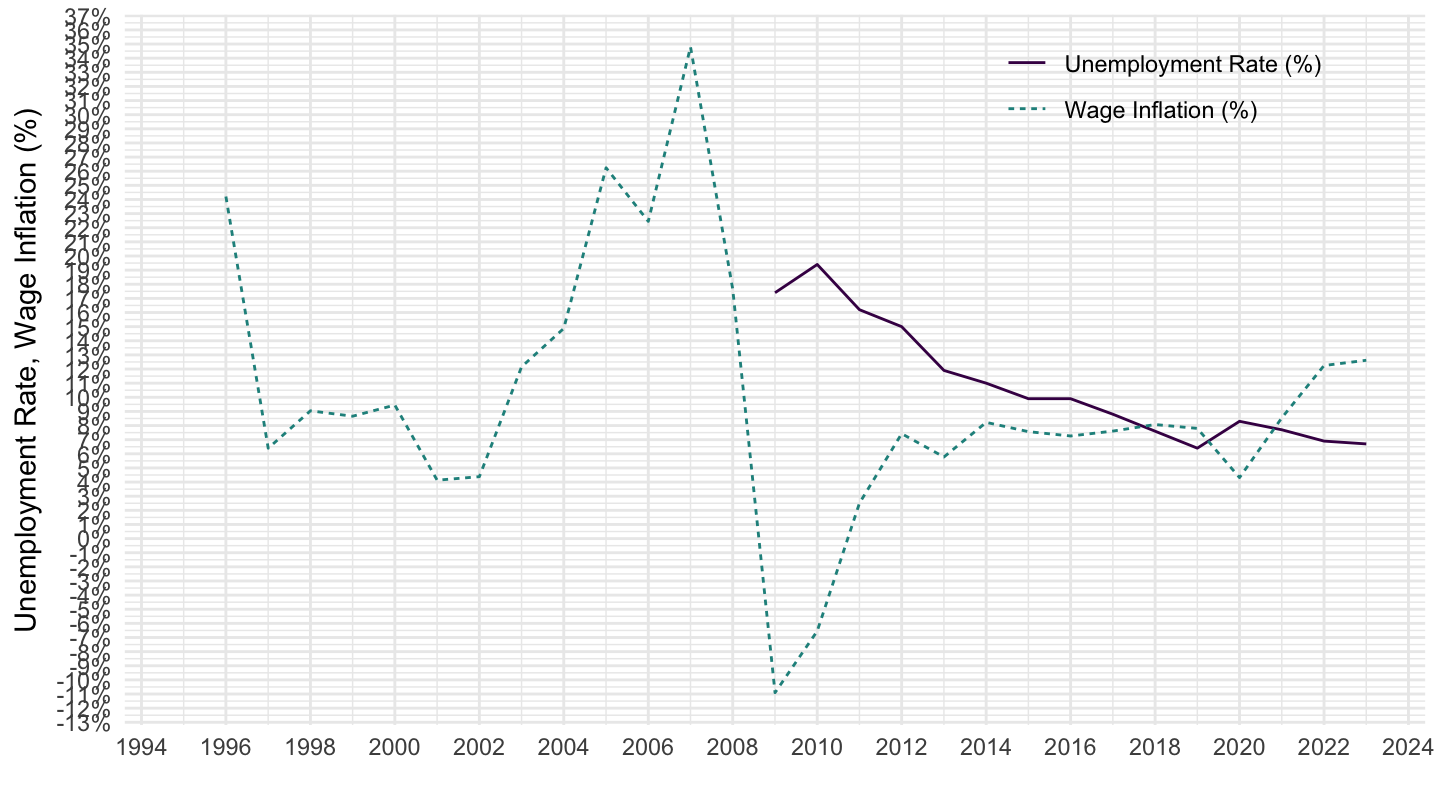
tipsna62 |>
  filter(geo %in% c("MT"),
         unit == "THS_PER") |>
  select(geo, Geo, time, emp = values) |>
  left_join(tipslm13 |>
              select(geo, time, comp = values),
            by = c("geo", "time")) |>
  left_join(une_rt_a |>
              filter(age == "Y20-64",
                     sex == "T",
                     unit == "PC_ACT") |>
              select(geo, time, unr = values),
            by = c("geo", "time")) |>
  mutate(comp_emp = comp/emp,
         comp_emp_d1 = comp_emp/lag(comp_emp, 1)-1) |>
  year_to_date() |>
  transmute(date, comp_emp_d1=100*comp_emp_d1, unr = unr) |>
  gather(variable, value, -date) |>
  mutate(Variable = case_when(variable == "comp_emp_d1" ~ "Wage Inflation (%)",
                              variable == "unr" ~ "Unemployment Rate (%)")) |>
  ggplot() + geom_line() + theme_minimal()  +
  aes(x = date, y = value/100, color = Variable, linetype = Variable) +
  scale_color_manual(values = viridis(3)[1:2]) +
  scale_x_date(breaks = as.Date(paste0(seq(1960, 2100, 2), "-01-01")),
               labels = date_format("%Y")) +
  scale_y_continuous(breaks = 0.01*seq(-100, 100, 1),
                     labels = percent_format(accuracy = 1)) +
  theme(legend.position = c(0.8, 0.9),
        legend.title = element_blank()) +
  xlab("") + ylab("Unemployment Rate, Wage Inflation (%)")
tipsna62 |>
  filter(geo %in% c("NL"),
         unit == "THS_PER") |>
  select(geo, Geo, time, emp = values) |>
  left_join(tipslm13 |>
              select(geo, time, comp = values),
            by = c("geo", "time")) |>
  left_join(une_rt_a |>
              filter(age == "Y20-64",
                     sex == "T",
                     unit == "PC_ACT") |>
              select(geo, time, unr = values),
            by = c("geo", "time")) |>
  mutate(comp_emp = comp/emp,
         comp_emp_d1 = comp_emp/lag(comp_emp, 1)-1) |>
  year_to_date() |>
  transmute(date, comp_emp_d1=100*comp_emp_d1, unr = unr) |>
  gather(variable, value, -date) |>
  mutate(Variable = case_when(variable == "comp_emp_d1" ~ "Wage Inflation (%)",
                              variable == "unr" ~ "Unemployment Rate (%)")) |>
  ggplot() + geom_line() + theme_minimal()  +
  aes(x = date, y = value/100, color = Variable, linetype = Variable) +
  scale_color_manual(values = viridis(3)[1:2]) +
  scale_x_date(breaks = as.Date(paste0(seq(1960, 2100, 2), "-01-01")),
               labels = date_format("%Y")) +
  scale_y_continuous(breaks = 0.01*seq(-100, 100, 1),
                     labels = percent_format(accuracy = 1)) +
  theme(legend.position = c(0.3, 0.9),
        legend.title = element_blank()) +
  xlab("") + ylab("Unemployment Rate, Wage Inflation (%)")
tipsna62 |>
  filter(geo %in% c("PT"),
         unit == "THS_PER") |>
  select(geo, Geo, time, emp = values) |>
  left_join(tipslm13 |>
              select(geo, time, comp = values),
            by = c("geo", "time")) |>
  left_join(une_rt_a |>
              filter(age == "Y20-64",
                     sex == "T",
                     unit == "PC_ACT") |>
              select(geo, time, unr = values),
            by = c("geo", "time")) |>
  mutate(comp_emp = comp/emp,
         comp_emp_d1 = comp_emp/lag(comp_emp, 1)-1) |>
  year_to_date() |>
  transmute(date, comp_emp_d1=100*comp_emp_d1, unr = unr) |>
  gather(variable, value, -date) |>
  mutate(Variable = case_when(variable == "comp_emp_d1" ~ "Wage Inflation (%)",
                              variable == "unr" ~ "Unemployment Rate (%)")) |>
  ggplot() + geom_line() + theme_minimal()  +
  aes(x = date, y = value/100, color = Variable, linetype = Variable) +
  scale_color_manual(values = viridis(3)[1:2]) +
  scale_x_date(breaks = as.Date(paste0(seq(1960, 2100, 2), "-01-01")),
               labels = date_format("%Y")) +
  scale_y_continuous(breaks = 0.01*seq(-100, 100, 1),
                     labels = percent_format(accuracy = 1)) +
  theme(legend.position = c(0.2, 0.85),
        legend.title = element_blank()) +
  xlab("") + ylab("Unemployment Rate, Wage Inflation (%)")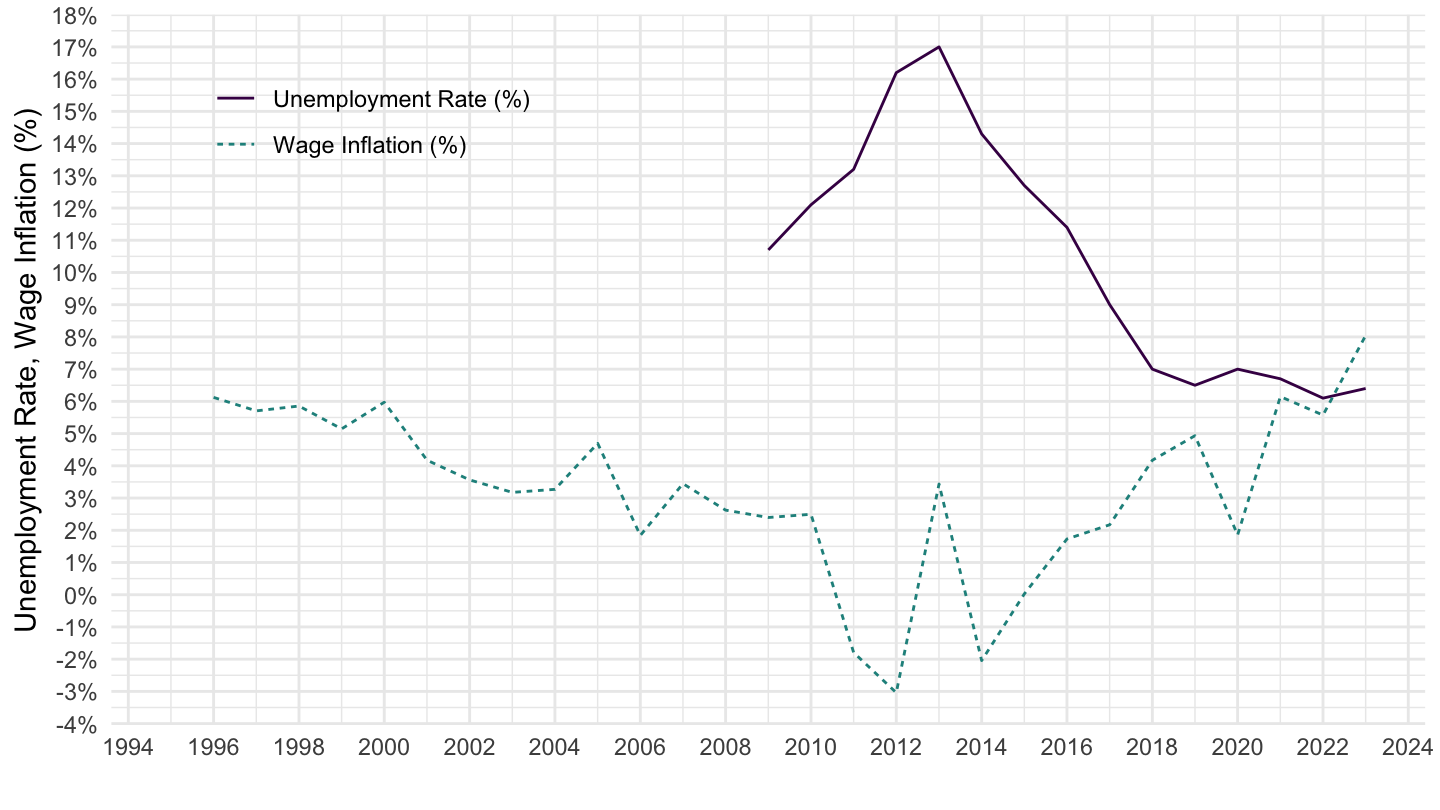
tipsna62 |>
  filter(geo %in% c("SI"),
         unit == "THS_PER") |>
  select(geo, Geo, time, emp = values) |>
  left_join(tipslm13 |>
              select(geo, time, comp = values),
            by = c("geo", "time")) |>
  left_join(une_rt_a |>
              filter(age == "Y20-64",
                     sex == "T",
                     unit == "PC_ACT") |>
              select(geo, time, unr = values),
            by = c("geo", "time")) |>
  mutate(comp_emp = comp/emp,
         comp_emp_d1 = comp_emp/lag(comp_emp, 1)-1) |>
  year_to_date() |>
  transmute(date, comp_emp_d1=100*comp_emp_d1, unr = unr) |>
  gather(variable, value, -date) |>
  mutate(Variable = case_when(variable == "comp_emp_d1" ~ "Wage Inflation (%)",
                              variable == "unr" ~ "Unemployment Rate (%)")) |>
  ggplot() + geom_line() + theme_minimal()  +
  aes(x = date, y = value/100, color = Variable, linetype = Variable) +
  scale_color_manual(values = viridis(3)[1:2]) +
  scale_x_date(breaks = as.Date(paste0(seq(1960, 2100, 2), "-01-01")),
               labels = date_format("%Y")) +
  scale_y_continuous(breaks = 0.01*seq(-100, 100, 1),
                     labels = percent_format(accuracy = 1)) +
  theme(legend.position = c(0.3, 0.9),
        legend.title = element_blank()) +
  xlab("") + ylab("Unemployment Rate, Wage Inflation (%)")
tipsna62 |>
  filter(geo %in% c("SK"),
         unit == "THS_PER") |>
  select(geo, Geo, time, emp = values) |>
  left_join(tipslm13 |>
              select(geo, time, comp = values),
            by = c("geo", "time")) |>
  left_join(une_rt_a |>
              filter(age == "Y20-64",
                     sex == "T",
                     unit == "PC_ACT") |>
              select(geo, time, unr = values),
            by = c("geo", "time")) |>
  mutate(comp_emp = comp/emp,
         comp_emp_d1 = comp_emp/lag(comp_emp, 1)-1) |>
  year_to_date() |>
  transmute(date, comp_emp_d1=100*comp_emp_d1, unr = unr) |>
  gather(variable, value, -date) |>
  mutate(Variable = case_when(variable == "comp_emp_d1" ~ "Wage Inflation (%)",
                              variable == "unr" ~ "Unemployment Rate (%)")) |>
  ggplot() + geom_line() + theme_minimal()  +
  aes(x = date, y = value/100, color = Variable, linetype = Variable) +
  scale_color_manual(values = viridis(3)[1:2]) +
  scale_x_date(breaks = as.Date(paste0(seq(1960, 2100, 2), "-01-01")),
               labels = date_format("%Y")) +
  scale_y_continuous(breaks = 0.01*seq(-100, 100, 1),
                     labels = percent_format(accuracy = 1)) +
  theme(legend.position = c(0.8, 0.9),
        legend.title = element_blank()) +
  xlab("") + ylab("Unemployment Rate, Wage Inflation (%)")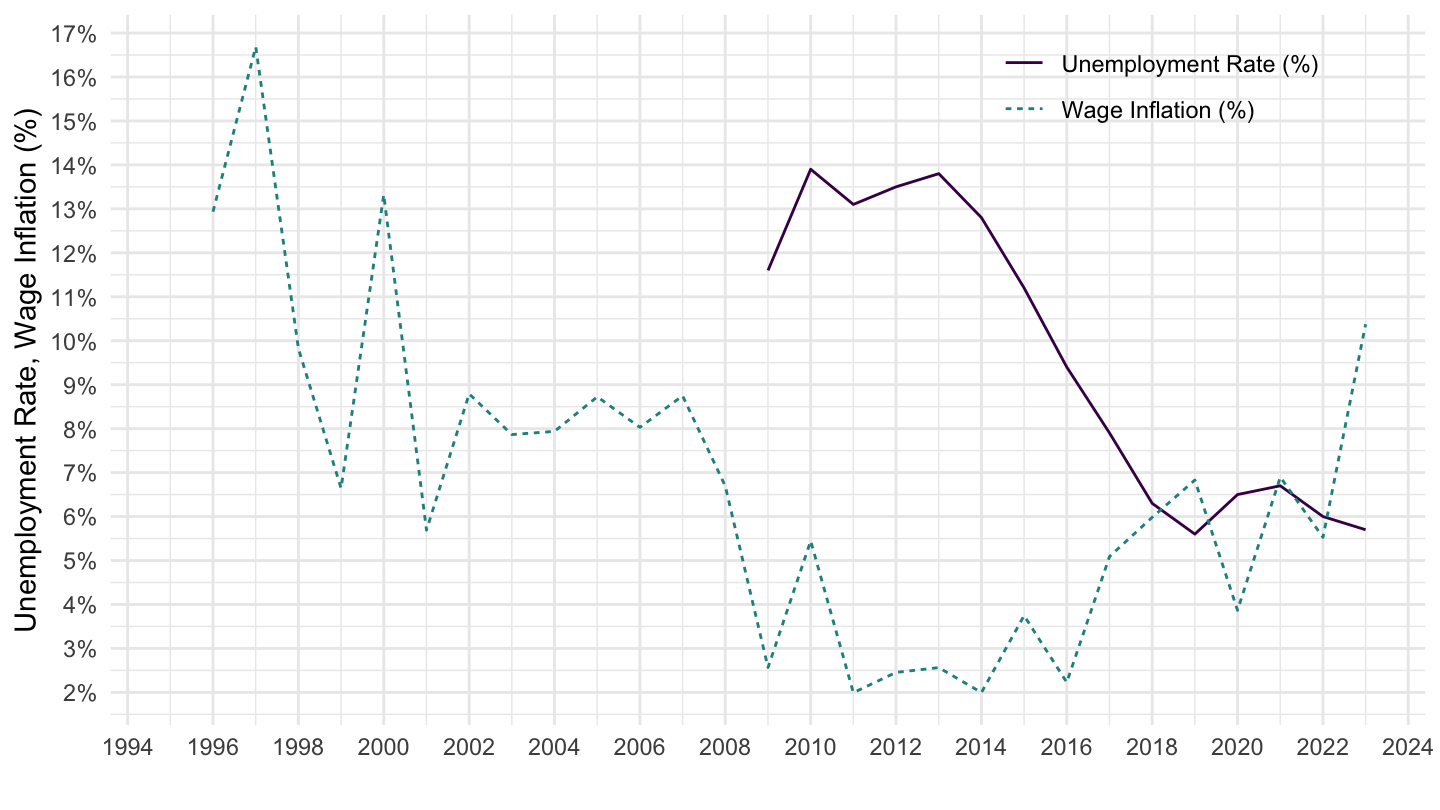
tipsna62tipslm13une_rt_atipsna62 |>
filter(geo %in% c("BG"),
unit == "THS_PER") |>
select(geo, Geo, time, emp = values) |>
left_join(tipslm13 |>
select(geo, time, comp = values),
by = c("geo", "time")) |>
left_join(une_rt_a |>
filter(age == "Y20-64",
sex == "T",
unit == "PC_ACT") |>
select(geo, time, unr = values),
by = c("geo", "time")) |>
mutate(comp_emp = comp/emp,
comp_emp_d1 = comp_emp/lag(comp_emp, 1)-1) |>
year_to_date() |>
transmute(date, comp_emp_d1=100*comp_emp_d1, unr = unr) |>
gather(variable, value, -date) |>
mutate(Variable = case_when(variable == "comp_emp_d1" ~ "Wage Inflation (%)",
variable == "unr" ~ "Unemployment Rate (%)")) |>
ggplot() + geom_line() + theme_minimal() +
aes(x = date, y = value/100, color = Variable, linetype = Variable) +
scale_color_manual(values = viridis(3)[1:2]) +
scale_x_date(breaks = as.Date(paste0(seq(1960, 2100, 2), "-01-01")),
labels = date_format("%Y")) +
scale_y_continuous(breaks = 0.01*seq(-100, 100, 1),
labels = percent_format(accuracy = 1)) +
theme(legend.position = c(0.2, 0.85),
legend.title = element_blank()) +
xlab("") + ylab("Unemployment Rate, Wage Inflation (%)")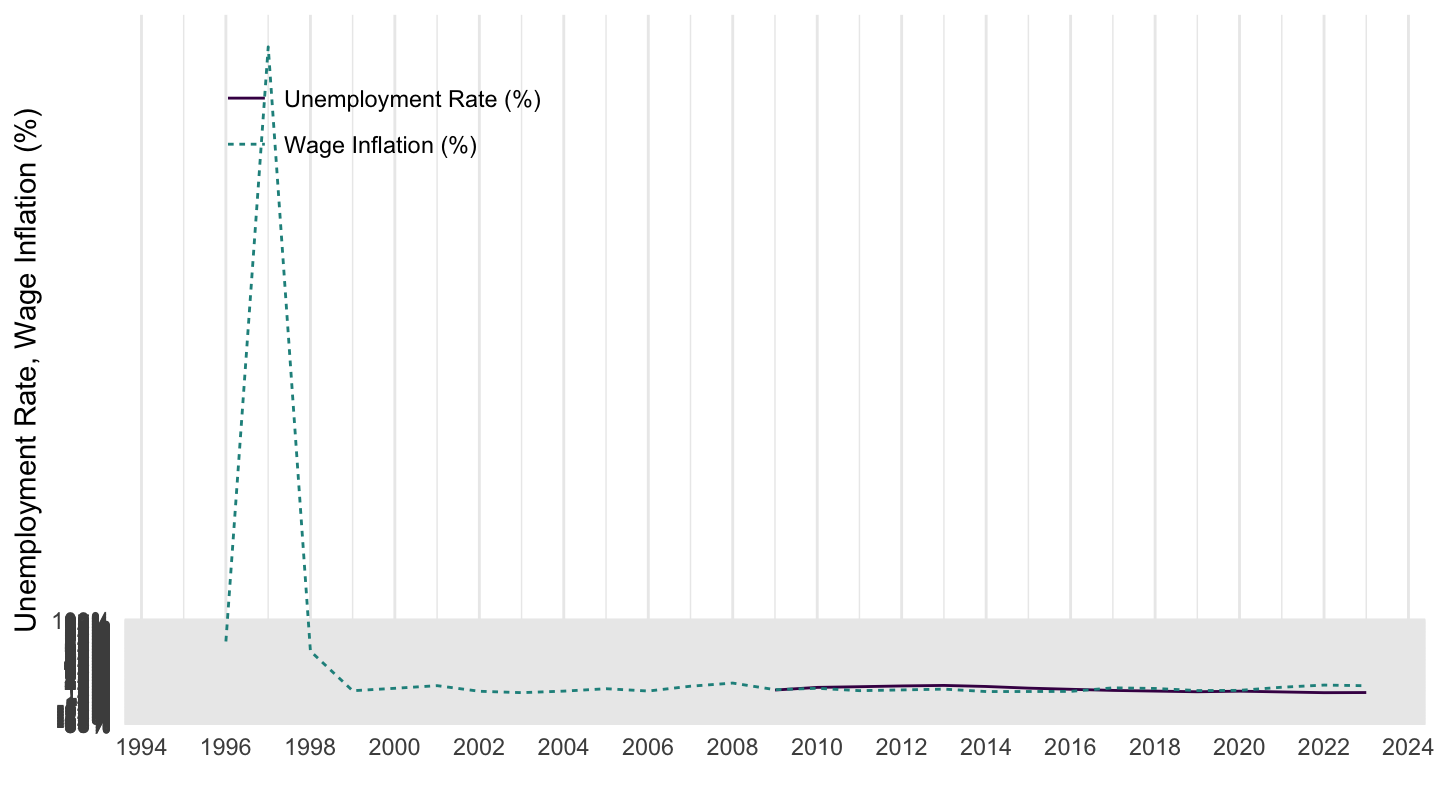
tipsna62 |>
  filter(geo %in% c("BG"),
         unit == "THS_PER") |>
  select(geo, Geo, time, emp = values) |>
  left_join(tipslm13 |>
              select(geo, time, comp = values),
            by = c("geo", "time")) |>
  left_join(une_rt_a |>
              filter(age == "Y20-64",
                     sex == "T",
                     unit == "PC_ACT") |>
              select(geo, time, unr = values),
            by = c("geo", "time")) |>
  mutate(comp_emp = comp/emp,
         comp_emp_d1 = comp_emp/lag(comp_emp, 1)-1) |>
  year_to_date() |>
  filter(date >= as.Date("1999-01-01")) |>
  transmute(date, comp_emp_d1=100*comp_emp_d1, unr = unr) |>
  gather(variable, value, -date) |>
  mutate(Variable = case_when(variable == "comp_emp_d1" ~ "Wage Inflation (%)",
                              variable == "unr" ~ "Unemployment Rate (%)")) |>
  ggplot() + geom_line() + theme_minimal()  +
  aes(x = date, y = value/100, color = Variable, linetype = Variable) +
  scale_color_manual(values = viridis(3)[1:2]) +
  scale_x_date(breaks = as.Date(paste0(seq(1960, 2100, 2), "-01-01")),
               labels = date_format("%Y")) +
  scale_y_continuous(breaks = 0.01*seq(-100, 100, 1),
                     labels = percent_format(accuracy = 1)) +
  theme(legend.position = c(0.8, 0.85),
        legend.title = element_blank()) +
  xlab("") + ylab("Unemployment Rate, Wage Inflation (%)")
tipsna62 |>
  filter(geo %in% c("CZ"),
         unit == "THS_PER") |>
  select(geo, Geo, time, emp = values) |>
  left_join(tipslm13 |>
              select(geo, time, comp = values),
            by = c("geo", "time")) |>
  left_join(une_rt_a |>
              filter(age == "Y20-64",
                     sex == "T",
                     unit == "PC_ACT") |>
              select(geo, time, unr = values),
            by = c("geo", "time")) |>
  mutate(comp_emp = comp/emp,
         comp_emp_d1 = comp_emp/lag(comp_emp, 1)-1) |>
  year_to_date() |>
  transmute(date, comp_emp_d1=100*comp_emp_d1, unr = unr) |>
  gather(variable, value, -date) |>
  mutate(Variable = case_when(variable == "comp_emp_d1" ~ "Wage Inflation (%)",
                              variable == "unr" ~ "Unemployment Rate (%)")) |>
  ggplot() + geom_line() + theme_minimal()  +
  aes(x = date, y = value/100, color = Variable, linetype = Variable) +
  scale_color_manual(values = viridis(3)[1:2]) +
  scale_x_date(breaks = as.Date(paste0(seq(1960, 2100, 2), "-01-01")),
               labels = date_format("%Y")) +
  scale_y_continuous(breaks = 0.01*seq(-100, 100, 1),
                     labels = percent_format(accuracy = 1)) +
  theme(legend.position = c(0.2, 0.85),
        legend.title = element_blank()) +
  xlab("") + ylab("Unemployment Rate, Wage Inflation (%)")
tipsna62 |>
  filter(geo %in% c("DK"),
         unit == "THS_PER") |>
  select(geo, Geo, time, emp = values) |>
  left_join(tipslm13 |>
              select(geo, time, comp = values),
            by = c("geo", "time")) |>
  left_join(une_rt_a |>
              filter(age == "Y20-64",
                     sex == "T",
                     unit == "PC_ACT") |>
              select(geo, time, unr = values),
            by = c("geo", "time")) |>
  mutate(comp_emp = comp/emp,
         comp_emp_d1 = comp_emp/lag(comp_emp, 1)-1) |>
  year_to_date() |>
  transmute(date, comp_emp_d1=100*comp_emp_d1, unr = unr) |>
  gather(variable, value, -date) |>
  mutate(Variable = case_when(variable == "comp_emp_d1" ~ "Wage Inflation (%)",
                              variable == "unr" ~ "Unemployment Rate (%)")) |>
  ggplot() + geom_line() + theme_minimal()  +
  aes(x = date, y = value/100, color = Variable, linetype = Variable) +
  scale_color_manual(values = viridis(3)[1:2]) +
  scale_x_date(breaks = as.Date(paste0(seq(1960, 2100, 2), "-01-01")),
               labels = date_format("%Y")) +
  scale_y_continuous(breaks = 0.01*seq(-100, 100, 1),
                     labels = percent_format(accuracy = 1)) +
  theme(legend.position = c(0.3, 0.85),
        legend.title = element_blank()) +
  xlab("") + ylab("Unemployment Rate, Wage Inflation (%)")
tipsna62 |>
  filter(geo %in% c("HR"),
         unit == "THS_PER") |>
  select(geo, Geo, time, emp = values) |>
  left_join(tipslm13 |>
              select(geo, time, comp = values),
            by = c("geo", "time")) |>
  left_join(une_rt_a |>
              filter(age == "Y20-64",
                     sex == "T",
                     unit == "PC_ACT") |>
              select(geo, time, unr = values),
            by = c("geo", "time")) |>
  mutate(comp_emp = comp/emp,
         comp_emp_d1 = comp_emp/lag(comp_emp, 1)-1) |>
  year_to_date() |>
  transmute(date, comp_emp_d1=100*comp_emp_d1, unr = unr) |>
  gather(variable, value, -date) |>
  mutate(Variable = case_when(variable == "comp_emp_d1" ~ "Wage Inflation (%)",
                              variable == "unr" ~ "Unemployment Rate (%)")) |>
  ggplot() + geom_line() + theme_minimal()  +
  aes(x = date, y = value/100, color = Variable, linetype = Variable) +
  scale_color_manual(values = viridis(3)[1:2]) +
  scale_x_date(breaks = as.Date(paste0(seq(1960, 2100, 2), "-01-01")),
               labels = date_format("%Y")) +
  scale_y_continuous(breaks = 0.01*seq(-100, 100, 1),
                     labels = percent_format(accuracy = 1)) +
  theme(legend.position = c(0.2, 0.15),
        legend.title = element_blank()) +
  xlab("") + ylab("Unemployment Rate, Wage Inflation (%)")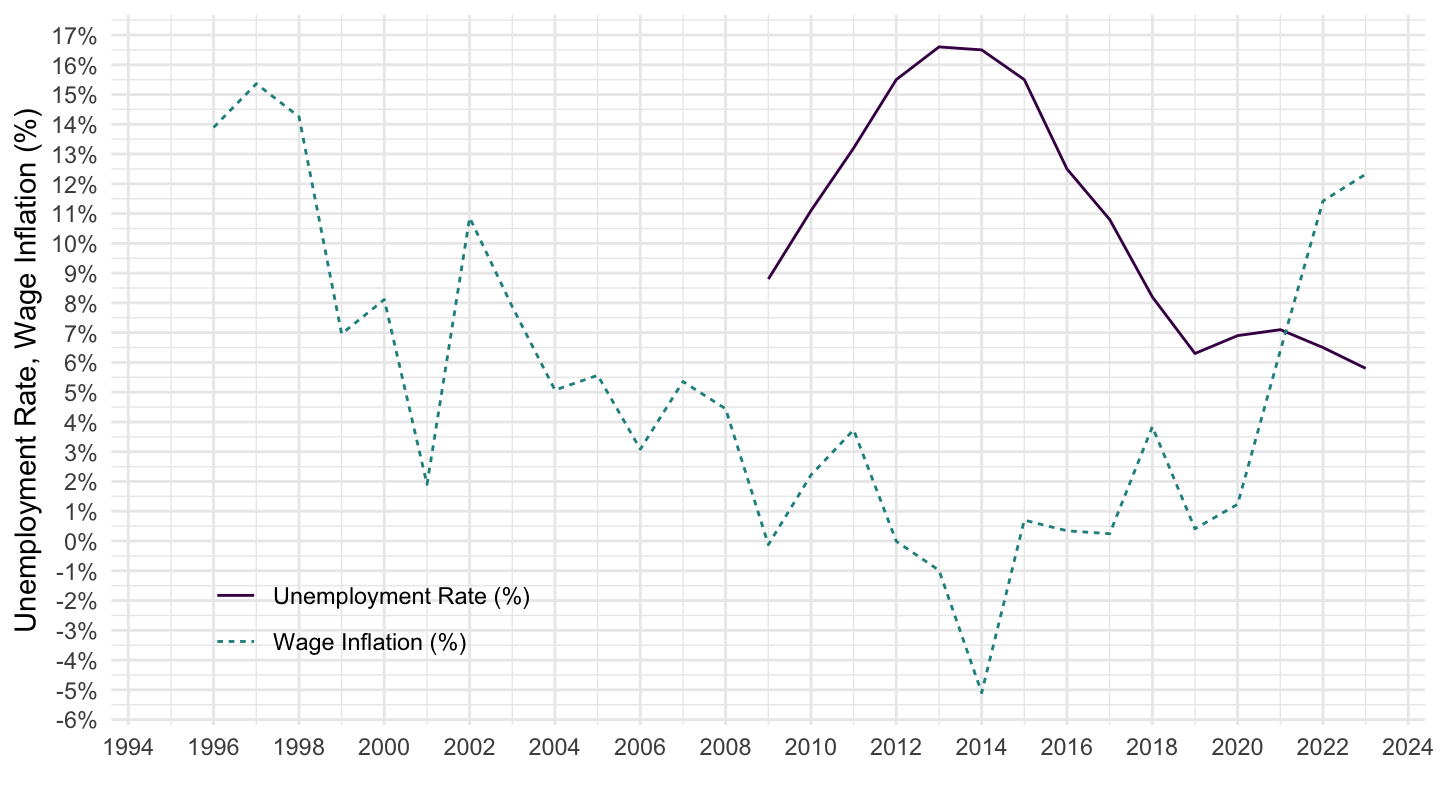
tipsna62 |>
  filter(geo %in% c("HU"),
         unit == "THS_PER") |>
  select(geo, Geo, time, emp = values) |>
  left_join(tipslm13 |>
              select(geo, time, comp = values),
            by = c("geo", "time")) |>
  left_join(une_rt_a |>
              filter(age == "Y20-64",
                     sex == "T",
                     unit == "PC_ACT") |>
              select(geo, time, unr = values),
            by = c("geo", "time")) |>
  mutate(comp_emp = comp/emp,
         comp_emp_d1 = comp_emp/lag(comp_emp, 1)-1) |>
  year_to_date() |>
  transmute(date, comp_emp_d1=100*comp_emp_d1, unr = unr) |>
  gather(variable, value, -date) |>
  mutate(Variable = case_when(variable == "comp_emp_d1" ~ "Wage Inflation (%)",
                              variable == "unr" ~ "Unemployment Rate (%)")) |>
  ggplot() + geom_line() + theme_minimal()  +
  aes(x = date, y = value/100, color = Variable, linetype = Variable) +
  scale_color_manual(values = viridis(3)[1:2]) +
  scale_x_date(breaks = as.Date(paste0(seq(1960, 2100, 2), "-01-01")),
               labels = date_format("%Y")) +
  scale_y_continuous(breaks = 0.01*seq(-100, 100, 1),
                     labels = percent_format(accuracy = 1)) +
  theme(legend.position = c(0.2, 0.15),
        legend.title = element_blank()) +
  xlab("") + ylab("Unemployment Rate, Wage Inflation (%)")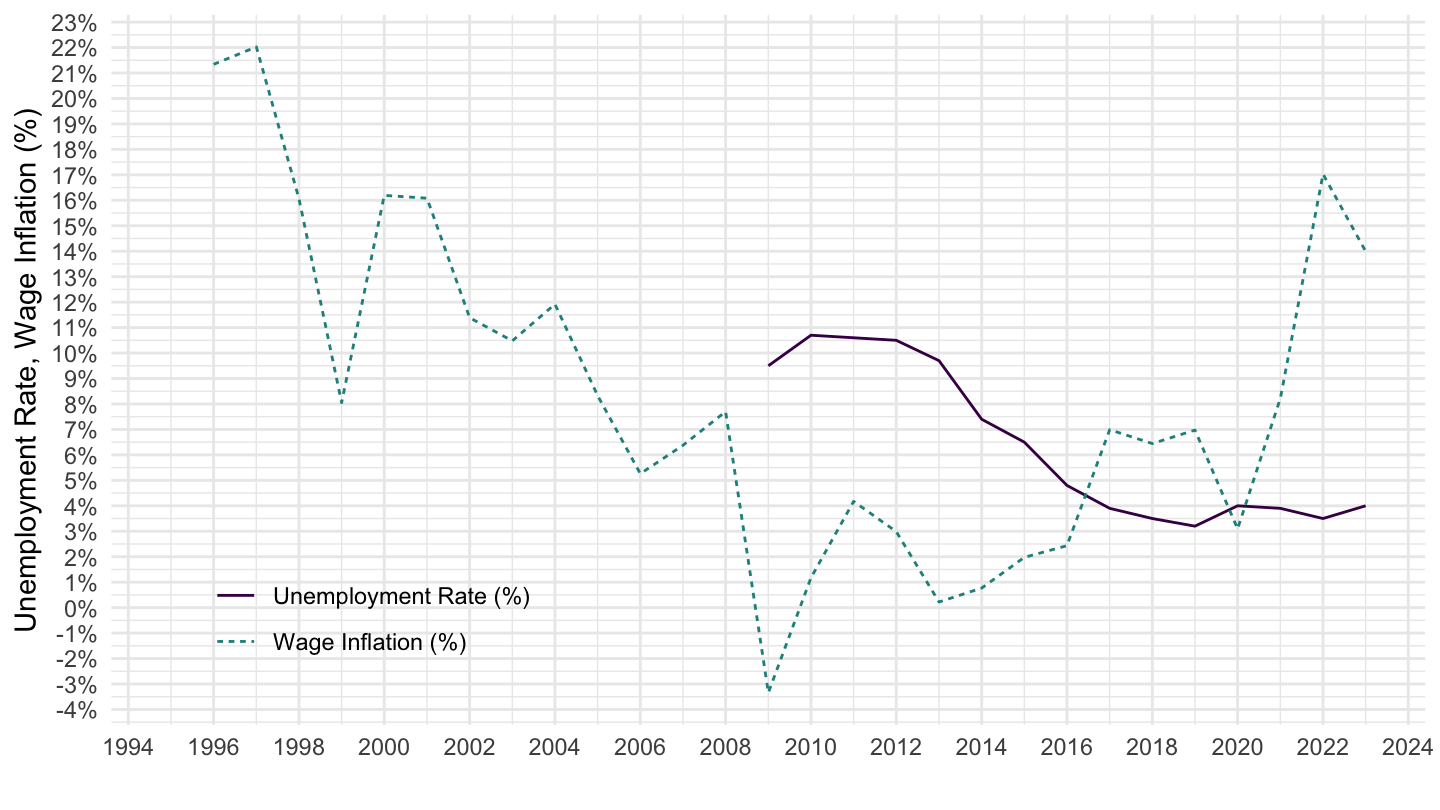
tipsna62 |>
  filter(geo %in% c("PL"),
         unit == "THS_PER") |>
  select(geo, Geo, time, emp = values) |>
  left_join(tipslm13 |>
              select(geo, time, comp = values),
            by = c("geo", "time")) |>
  left_join(une_rt_a |>
              filter(age == "Y20-64",
                     sex == "T",
                     unit == "PC_ACT") |>
              select(geo, time, unr = values),
            by = c("geo", "time")) |>
  mutate(comp_emp = comp/emp,
         comp_emp_d1 = comp_emp/lag(comp_emp, 1)-1) |>
  year_to_date() |>
  transmute(date, comp_emp_d1=100*comp_emp_d1, unr = unr) |>
  gather(variable, value, -date) |>
  mutate(Variable = case_when(variable == "comp_emp_d1" ~ "Wage Inflation (%)",
                              variable == "unr" ~ "Unemployment Rate (%)")) |>
  ggplot() + geom_line() + theme_minimal()  +
  aes(x = date, y = value/100, color = Variable, linetype = Variable) +
  scale_color_manual(values = viridis(3)[1:2]) +
  scale_x_date(breaks = as.Date(paste0(seq(1960, 2100, 2), "-01-01")),
               labels = date_format("%Y")) +
  scale_y_continuous(breaks = 0.01*seq(-100, 100, 1),
                     labels = percent_format(accuracy = 1)) +
  theme(legend.position = c(0.8, 0.85),
        legend.title = element_blank()) +
  xlab("") + ylab("Unemployment Rate, Wage Inflation (%)")
tipsna62 |>
  filter(geo %in% c("RO"),
         unit == "THS_PER") |>
  select(geo, Geo, time, emp = values) |>
  left_join(tipslm13 |>
              select(geo, time, comp = values),
            by = c("geo", "time")) |>
  left_join(une_rt_a |>
              filter(age == "Y20-64",
                     sex == "T",
                     unit == "PC_ACT") |>
              select(geo, time, unr = values),
            by = c("geo", "time")) |>
  mutate(comp_emp = comp/emp,
         comp_emp_d1 = comp_emp/lag(comp_emp, 1)-1) |>
  year_to_date() |>
  transmute(date, comp_emp_d1=100*comp_emp_d1, unr = unr) |>
  gather(variable, value, -date) |>
  mutate(Variable = case_when(variable == "comp_emp_d1" ~ "Wage Inflation (%)",
                              variable == "unr" ~ "Unemployment Rate (%)")) |>
  ggplot() + geom_line() + theme_minimal()  +
  aes(x = date, y = value/100, color = Variable, linetype = Variable) +
  scale_color_manual(values = viridis(3)[1:2]) +
  scale_x_date(breaks = as.Date(paste0(seq(1960, 2100, 2), "-01-01")),
               labels = date_format("%Y")) +
  scale_y_continuous(breaks = 0.01*seq(-100, 100, 5),
                     labels = percent_format(accuracy = 1)) +
  theme(legend.position = c(0.8, 0.85),
        legend.title = element_blank()) +
  xlab("") + ylab("Unemployment Rate, Wage Inflation (%)")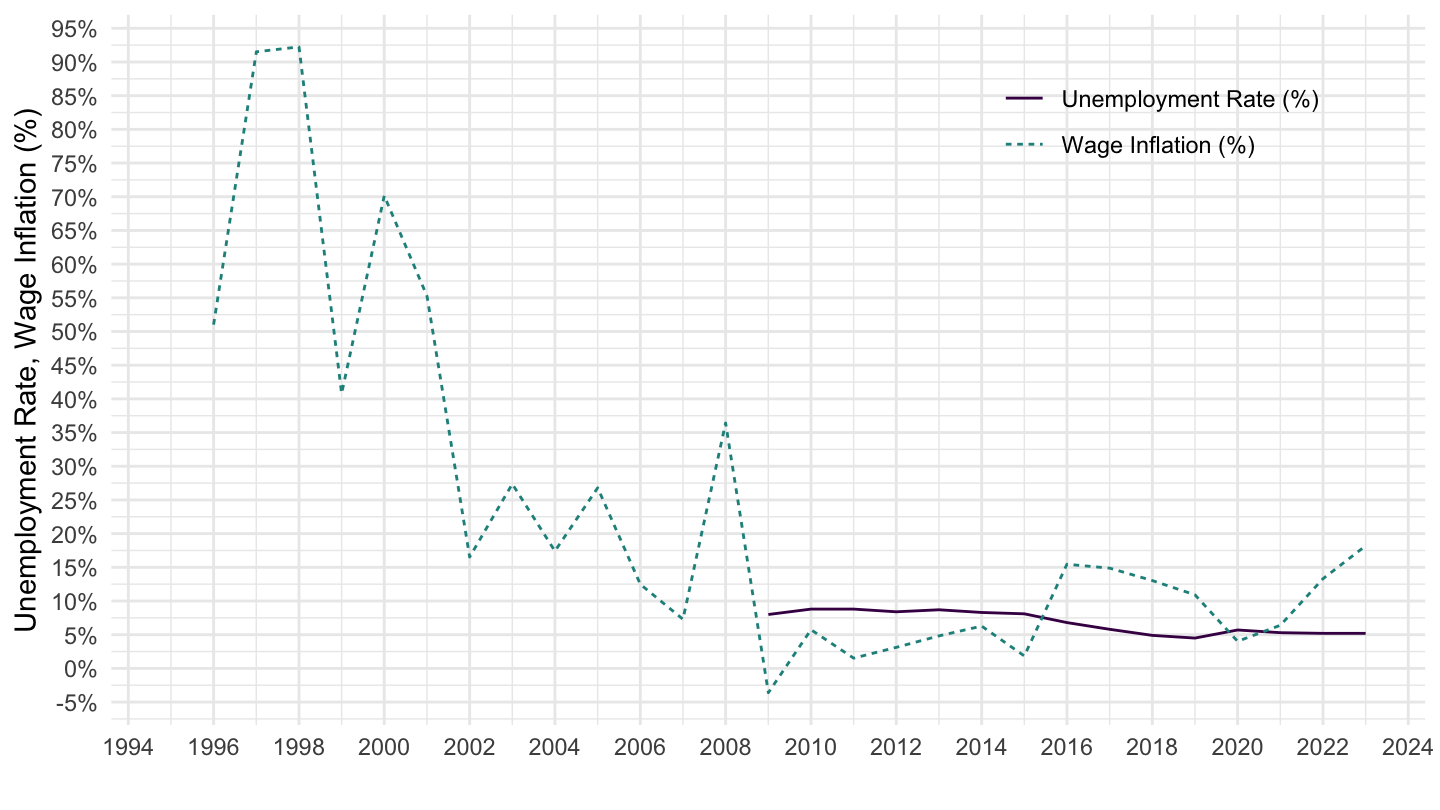
tipsna62 |>
  filter(geo %in% c("SE"),
         unit == "THS_PER") |>
  select(geo, Geo, time, emp = values) |>
  left_join(tipslm13 |>
              select(geo, time, comp = values),
            by = c("geo", "time")) |>
  left_join(une_rt_a |>
              filter(age == "Y20-64",
                     sex == "T",
                     unit == "PC_ACT") |>
              select(geo, time, unr = values),
            by = c("geo", "time")) |>
  mutate(comp_emp = comp/emp,
         comp_emp_d1 = comp_emp/lag(comp_emp, 1)-1) |>
  year_to_date() |>
  transmute(date, comp_emp_d1=100*comp_emp_d1, unr = unr) |>
  gather(variable, value, -date) |>
  mutate(Variable = case_when(variable == "comp_emp_d1" ~ "Wage Inflation (%)",
                              variable == "unr" ~ "Unemployment Rate (%)")) |>
  ggplot() + geom_line() + theme_minimal()  +
  aes(x = date, y = value/100, color = Variable, linetype = Variable) +
  scale_color_manual(values = viridis(3)[1:2]) +
  scale_x_date(breaks = as.Date(paste0(seq(1960, 2100, 2), "-01-01")),
               labels = date_format("%Y")) +
  scale_y_continuous(breaks = 0.01*seq(-100, 100, 1),
                     labels = percent_format(accuracy = 1)) +
  theme(legend.position = c(0.8, 0.85),
        legend.title = element_blank()) +
  xlab("") + ylab("Unemployment Rate, Wage Inflation (%)")