| source | dataset | .html | .qmd | .RData |
|---|---|---|---|---|
| eurostat | nama_10_lp_ulc | [2026-02-16] | https://fgee | olf.com/data |
| eurostat | une_rt_a | [2026-02-14] | https://fgee | olf.com/data |
Phillips curves
Data - Eurostat
Info
Data on phillips curves
| source | dataset | Title | Download | Compile |
|---|---|---|---|---|
| eurostat | phillips | Phillips curves | NA | [2026-02-14] |
| eurostat | tipsna62 | Employees, domestic concept - annual data | 2026-02-15 | [2026-02-14] |
| fred | phillips | Phillips curves | 2026-02-15 | [2026-02-15] |
| gfd | phillips | Phillips curves | NA | [2023-04-10] |
| ilo | phillips | Phillips curves | NA | [2023-04-10] |
| oecd | phillips | Phillips curves | NA | [2026-02-10] |
| wdi | phillips | Phillips curves | NA | [2026-02-15] |
LAST_COMPILE
| LAST_COMPILE |
|---|
| 2026-02-16 |
How much data ?
nama_10_lp_ulc - D1_SAL_PER
Code
nama_10_lp_ulc %>%
  filter(na_item == "D1_SAL_PER") %>%
  left_join(geo, by = "geo") %>%
  group_by(geo, Geo) %>%
  arrange(time) %>%
  summarise(Nobs = n(),
            first = first(time),
            last = last(time)) %>%
  mutate(Geo = ifelse(geo == "DE", "Germany", Geo)) %>%
  mutate(Flag = gsub(" ", "-", str_to_lower(Geo)),
         Flag = paste0('<img src="../../bib/flags/vsmall/', Flag, '.png" alt="Flag">')) %>%
  select(Flag, everything()) %>%
  {if (is_html_output()) datatable(., filter = 'top', rownames = F, escape = F) else .}
une_rt_a - Y20-64
Code
une_rt_a %>%
  filter(age == "Y20-64",
         sex == "T",
         unit == "PC_ACT") %>%
  left_join(geo, by = "geo") %>%
  group_by(geo, Geo) %>%
  arrange(time) %>%
  summarise(Nobs = n(),
            first = first(time),
            last = last(time)) %>%
  mutate(Geo = ifelse(geo == "DE", "Germany", Geo)) %>%
  mutate(Flag = gsub(" ", "-", str_to_lower(Geo)),
         Flag = paste0('<img src="../../bib/flags/vsmall/', Flag, '.png" alt="Flag">')) %>%
  select(Flag, everything()) %>%
  {if (is_html_output()) datatable(., filter = 'top', rownames = F, escape = F) else .}
Labour productivity and unit labour costs, unemployment rate
Code
Code
graph_phillips <- function(iso2c, xtick = 1, ytick = 2, position = c(0.2, 0.85)){
  nama_10_lp_ulc %>%
  filter(geo == iso2c,
         na_item == "D1_SAL_PER",
         unit == "EUR") %>%
  select(geo, time, D1_SAL_PER = values) %>%
  left_join(une_rt_a %>%
              filter(age == "Y20-64",
                     sex == "T",
                     unit == "PC_ACT") %>%
              select(geo, time, unr = values),
            by = c("geo", "time")) %>%
  year_to_date %>%
  #group_by(geo) %>%
  arrange(date) %>%
  transmute(date,
            D1_SAL_PER_d1 = D1_SAL_PER / lag(D1_SAL_PER, 1) - 1,
            unr = unr/100) %>%
  na.omit %>%
  gather(variable, value, -date) %>%
  mutate(Variable = case_when(variable == "D1_SAL_PER_d1" ~ "Wage Inflation (%)",
                              variable == "unr" ~ "Unemployment Rate (%)")) %>%
  ggplot + geom_line() + theme_minimal()  +
  aes(x = date, y = value, color = Variable) +
  geom_hline(yintercept = 0, linetype = "dashed",  color = "black") +
  scale_x_date(breaks = as.Date(paste0(seq(1960, 2024, xtick), "-01-01")),
               labels = date_format("%Y")) +
  scale_y_continuous(breaks = 0.01*seq(-100, 100, ytick),
                     labels = percent_format(accuracy = 1)) +
  theme(legend.position = position,
        legend.title = element_blank()) +
  xlab("") + ylab("Unemployment Rate, Wage Inflation (%)")
}
Austria
Code
graph_phillips("AT", ytick = 1)
Belgium
Code
graph_phillips("BE", ytick = 2, position = c(0.8, 0.85))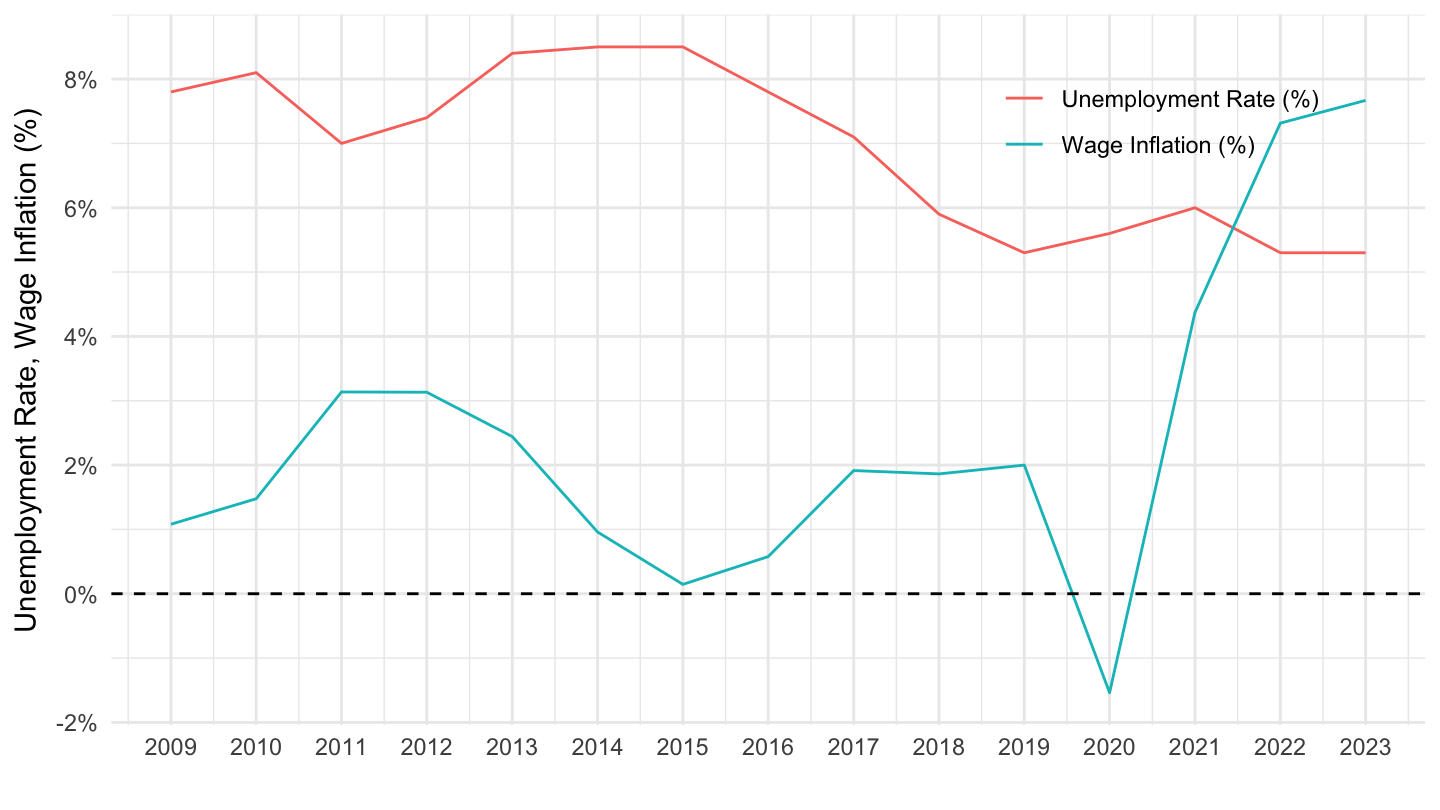
Bulgaria
Code
graph_phillips("BG", ytick = 2, position = c(0.8, 0.85))
Switzerland
Code
graph_phillips("CH", ytick = 2, position = c(0.8, 0.85))
Cyprus
Code
graph_phillips("CY", ytick = 2, position = c(0.2, 0.85))
Czechia
Code
graph_phillips("CZ", ytick = 2, position = c(0.8, 0.85))
Germany
Code
graph_phillips("DE", ytick = 2, position = c(0.8, 0.85))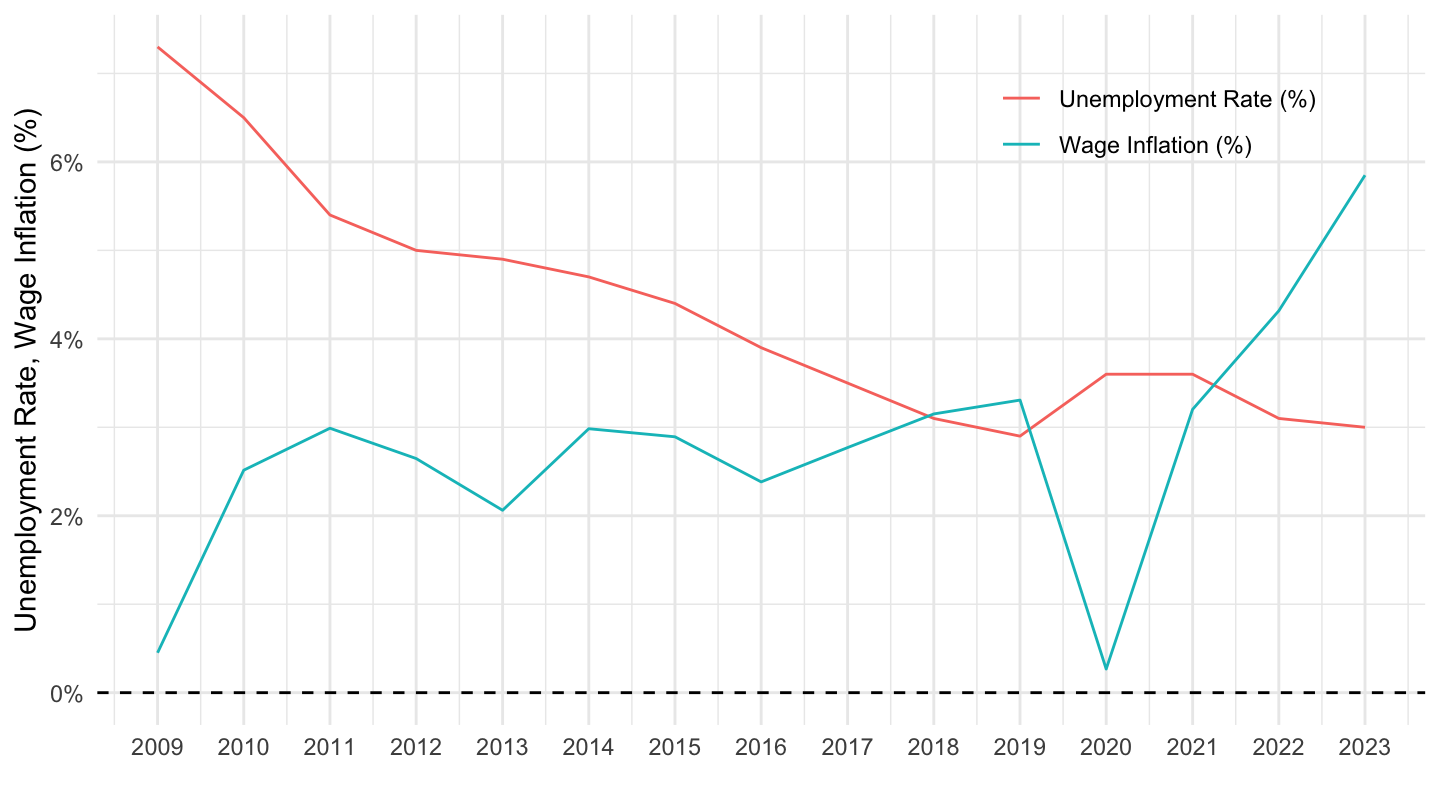
Denmark
Code
graph_phillips("DK", ytick = 2, position = c(0.8, 0.85))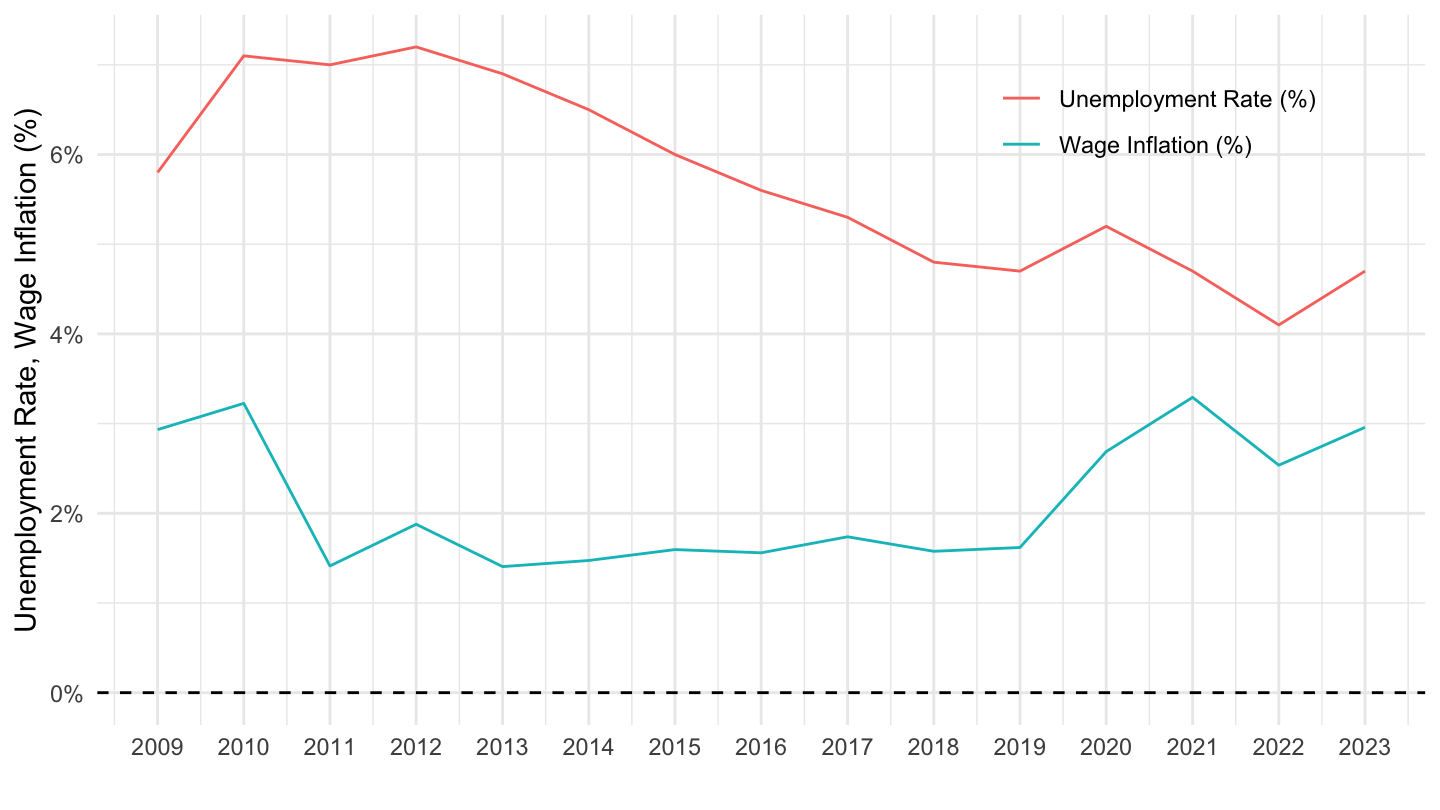
Europe - EA19
Code
graph_phillips("EA19", ytick = 2, position = c(0.8, 0.85))
Estonia
Code
graph_phillips("EE", ytick = 2, position = c(0.8, 0.85))
Greece
Code
graph_phillips("EL", ytick = 5)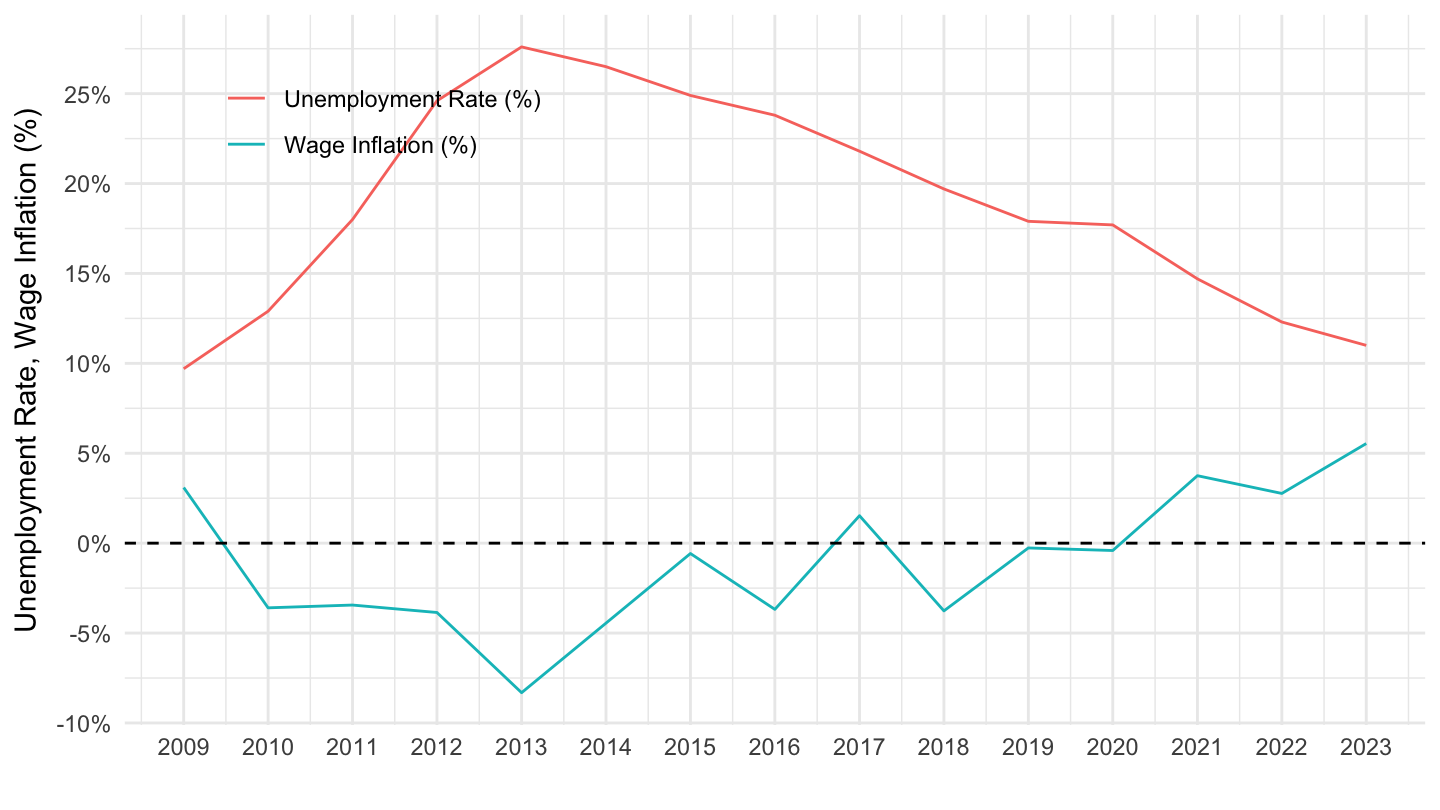
Spain
Code
graph_phillips("ES", ytick = 2, position = c(0.2, 0.9))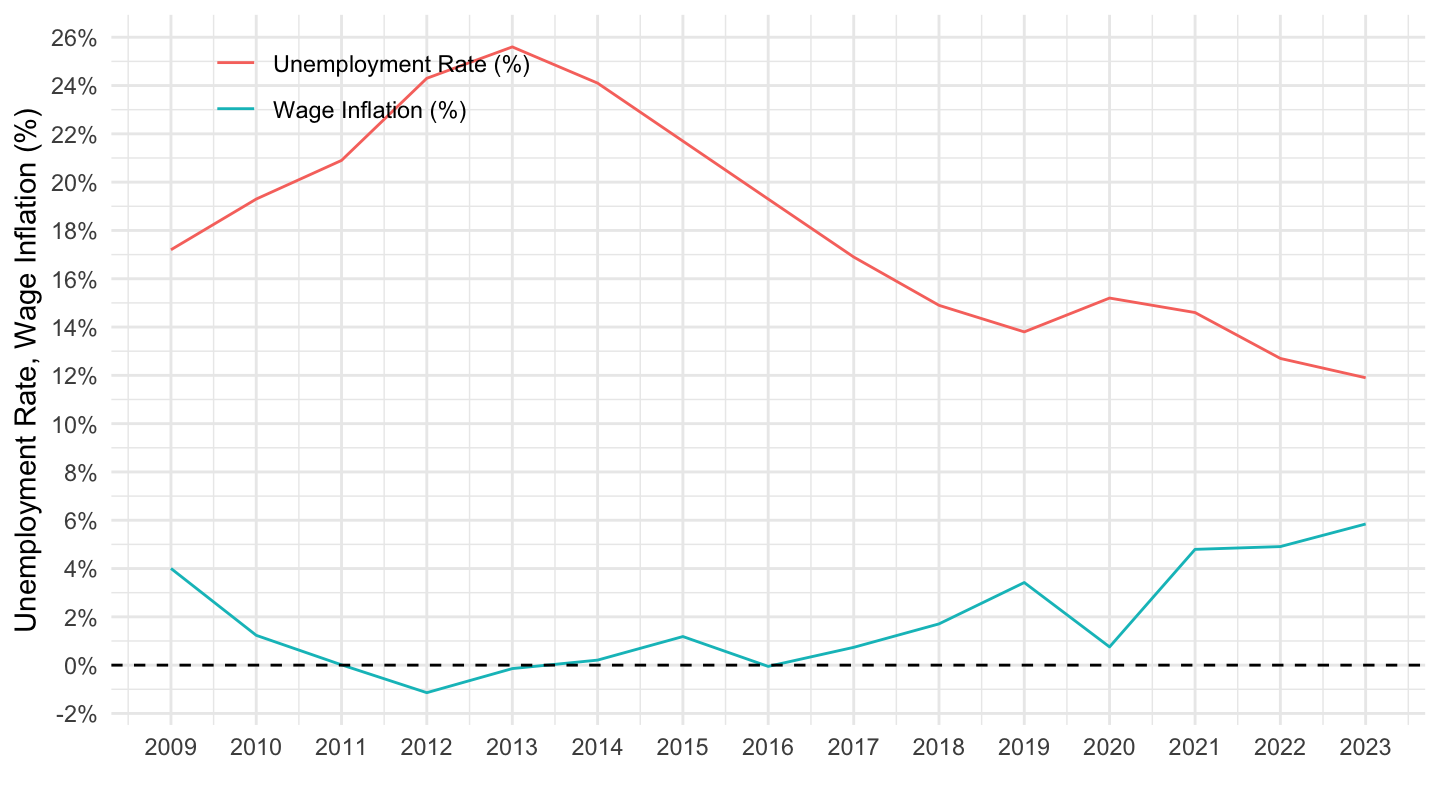
Finland
Code
graph_phillips("FI", ytick = 2, position = c(0.8, 0.9))
France
Code
graph_phillips("FR", ytick = 2, position = c(0.2, 0.1))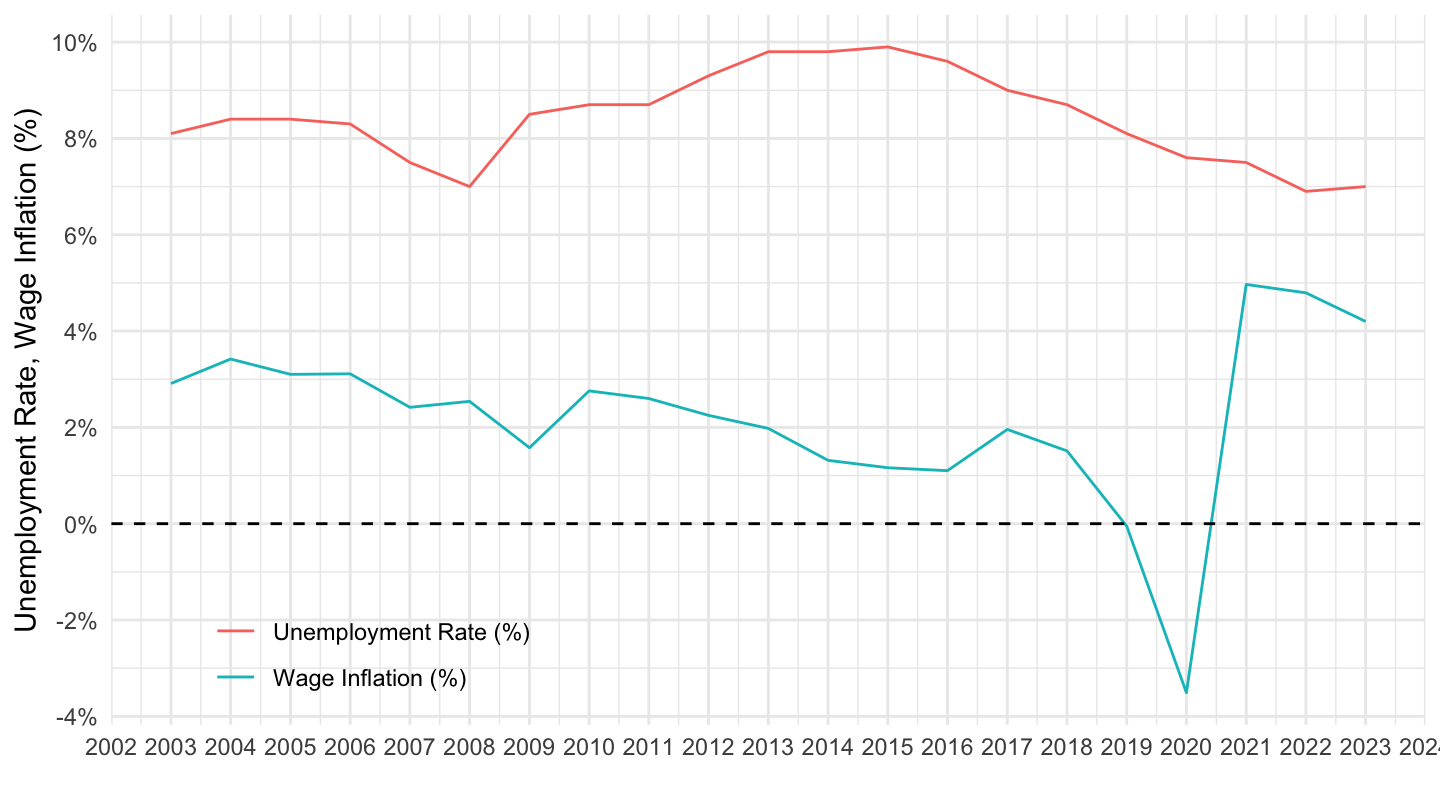
Croatia
Code
graph_phillips("HR", ytick = 2, position = c(0.2, 0.1))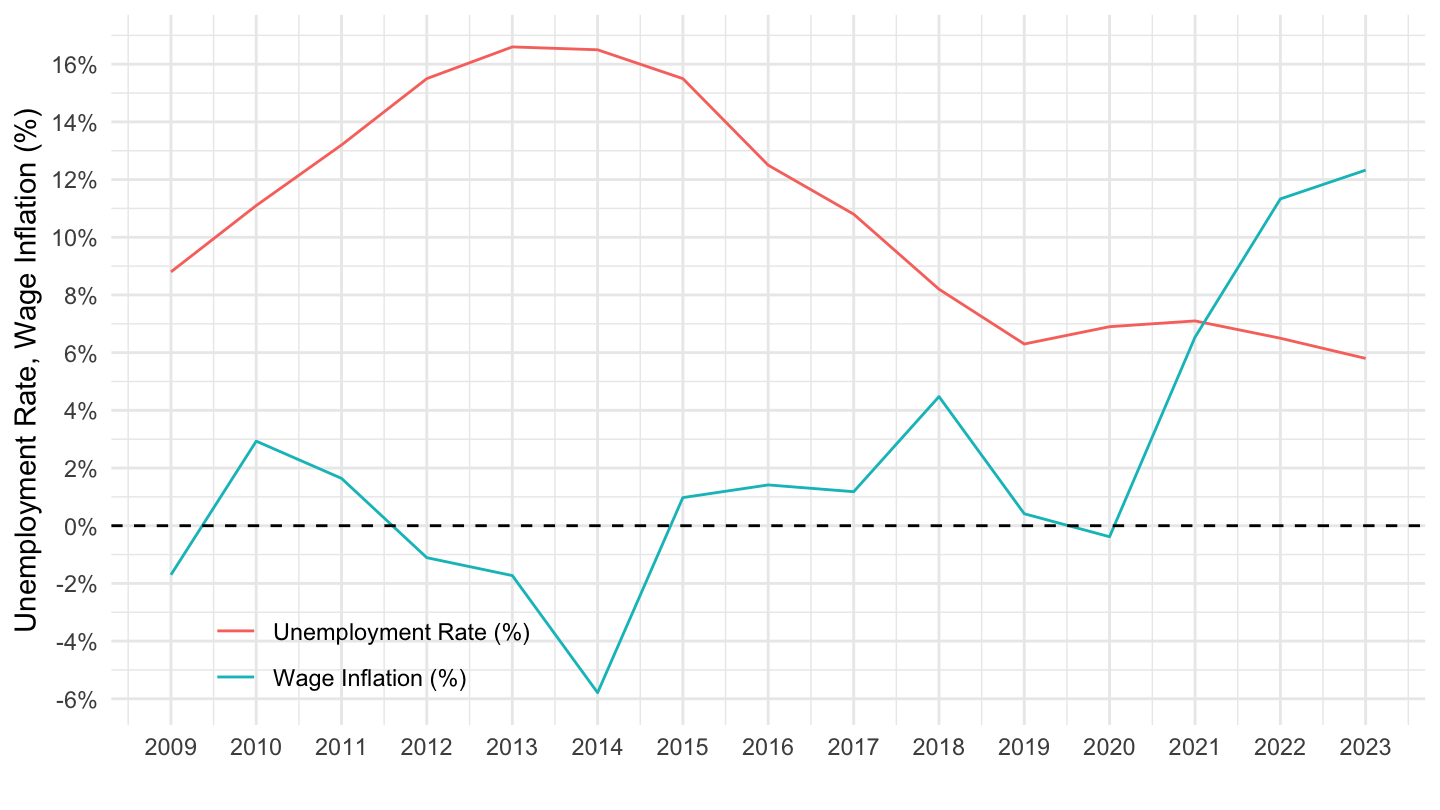
Hungary
Code
graph_phillips("HU", ytick = 2, position = c(0.2, 0.1))
Ireland
Code
graph_phillips("IE", ytick = 2, position = c(0.2, 0.1))
Iceland
Code
graph_phillips("IS", ytick = 2, position = c(0.2, 0.1))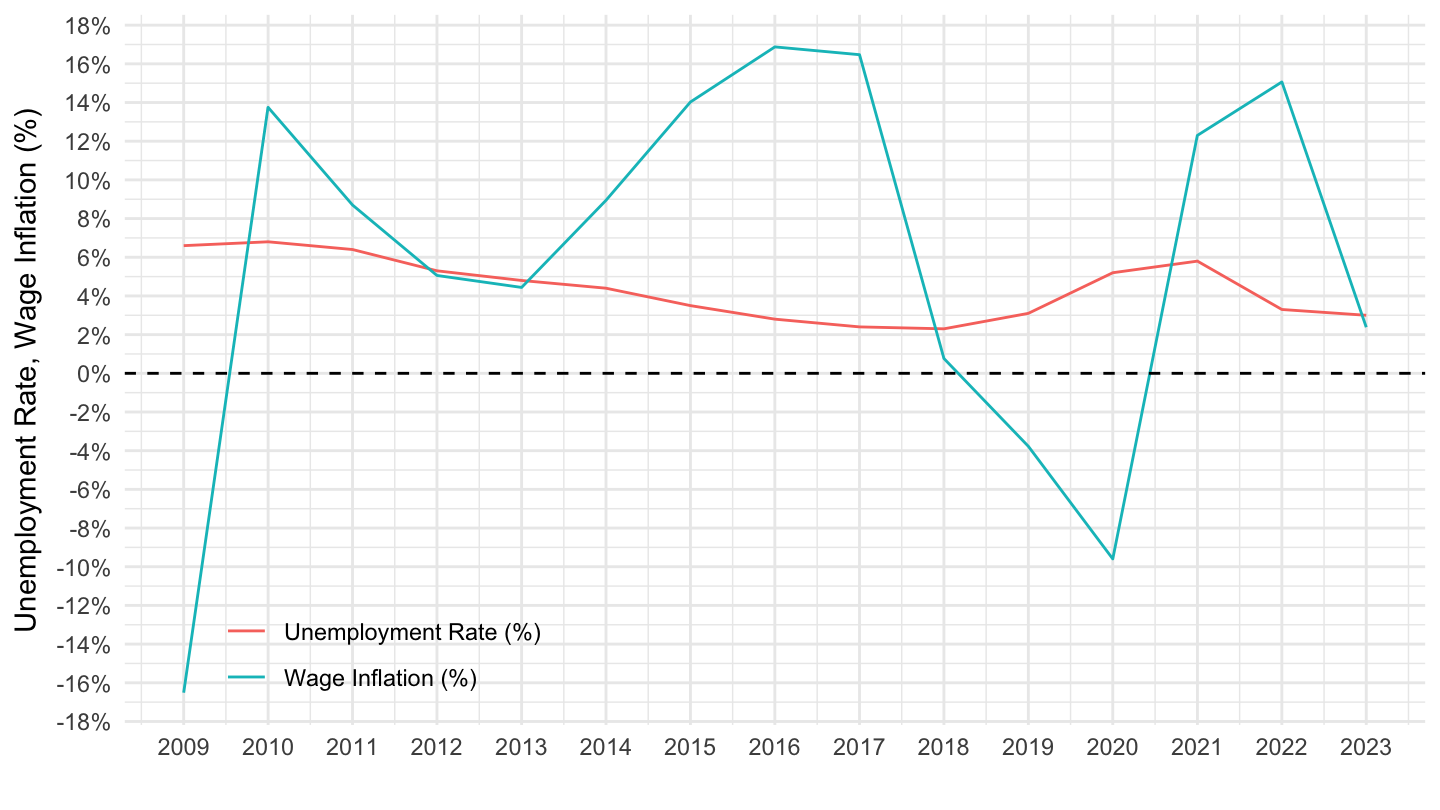
Italy
Code
graph_phillips("IT", ytick = 2, position = c(0.2, 0.1))
Lithuania
Code
graph_phillips("LT", ytick = 2, position = c(0.2, 0.1))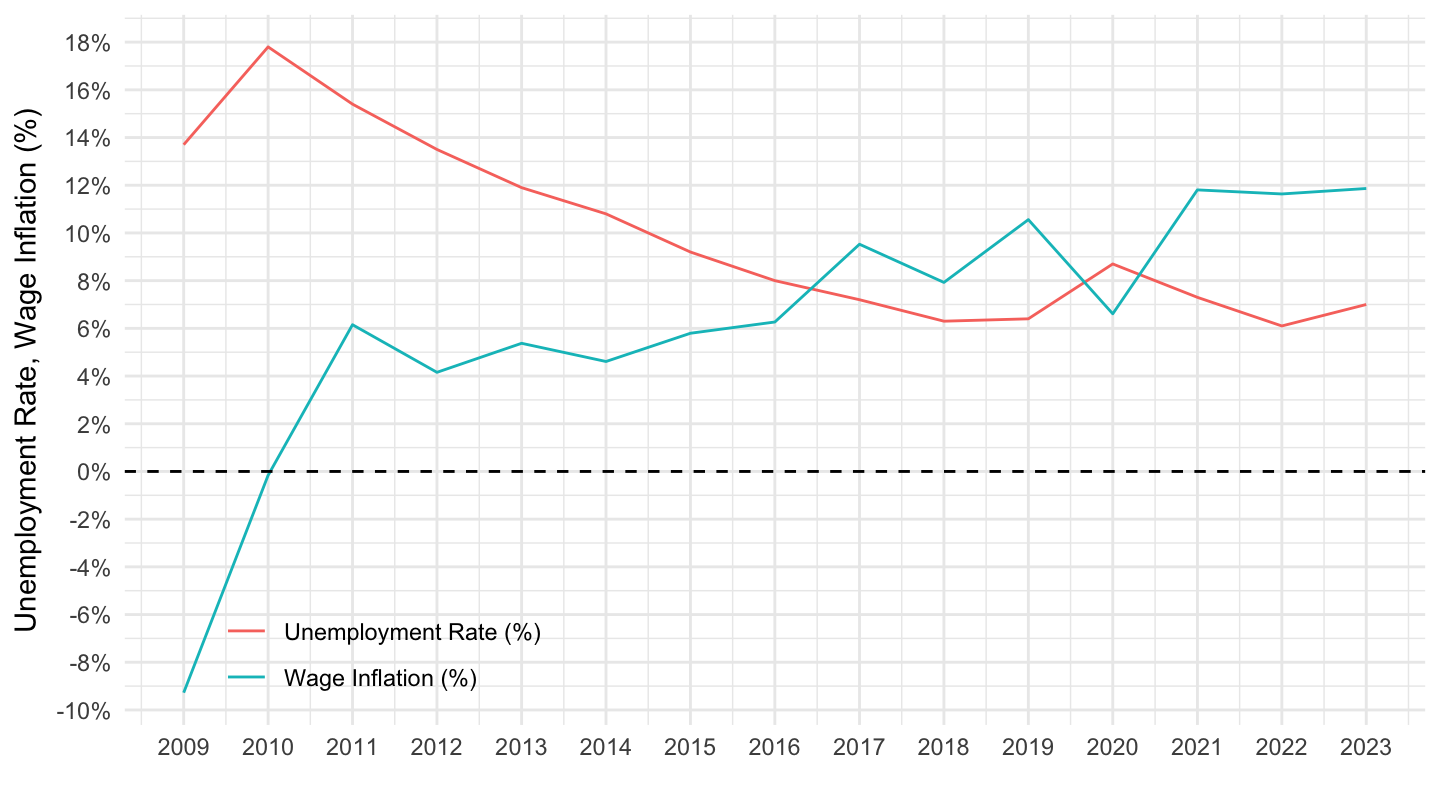
Luxembourg
Code
graph_phillips("LU", ytick = 1, position = c(0.2, 0.1))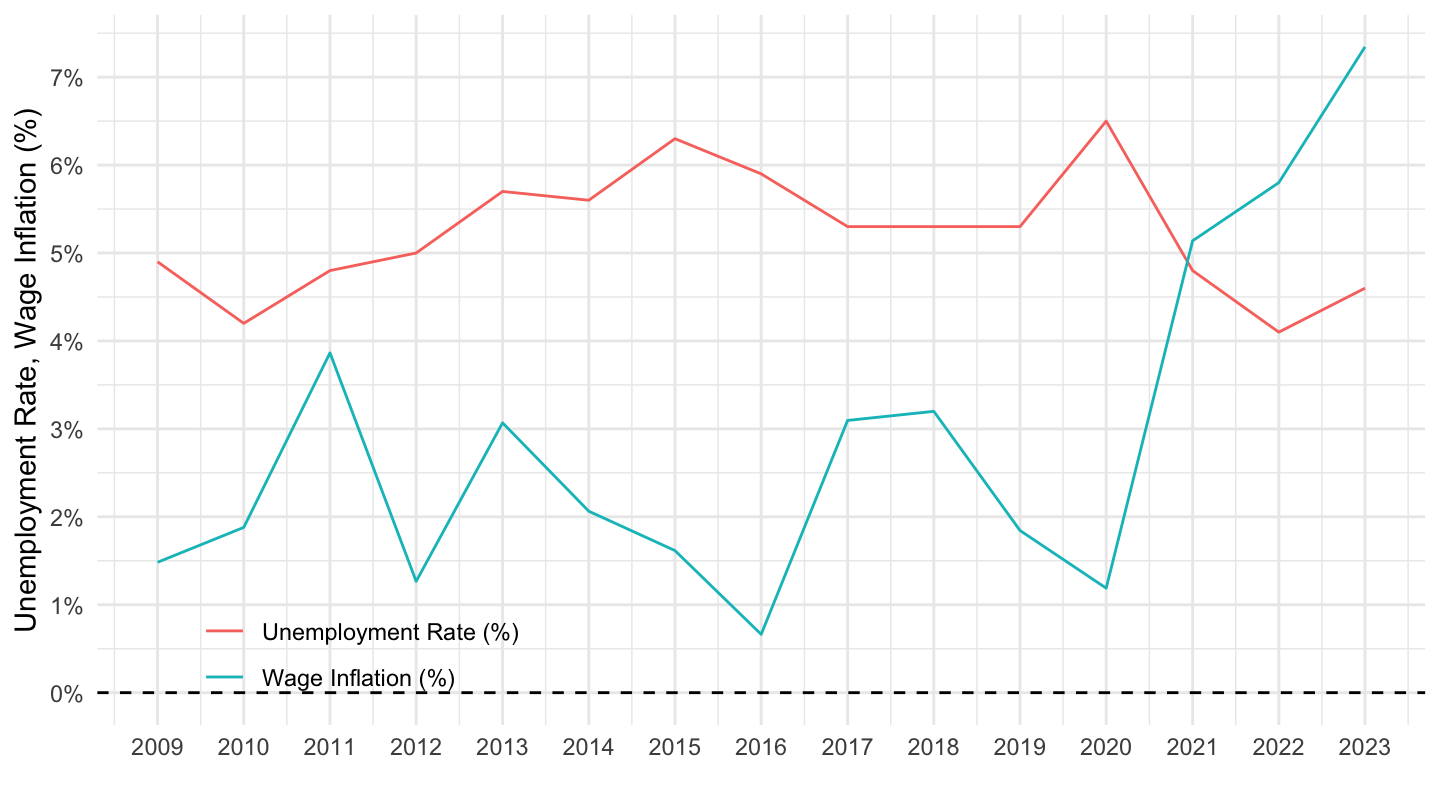
Latvia
Code
graph_phillips("LV", ytick = 1, position = c(0.2, 0.1))
Malta
Code
graph_phillips("MT", ytick = 1, position = c(0.8, 0.8))
Netherlands
Code
graph_phillips("NL", ytick = 1, position = c(0.8, 0.8))
Norway
Code
graph_phillips("NO", ytick = 1, position = c(0.8, 0.8))
Poland
Code
graph_phillips("PL", ytick = 1, position = c(0.8, 0.8))
Portugal
Code
graph_phillips("PT", ytick = 1, position = c(0.8, 0.8))
Romania
Code
graph_phillips("RO", ytick = 5, position = c(0.8, 0.8))
Sweden
Code
graph_phillips("SE", ytick = 5, position = c(0.8, 0.8))
Slovenia
Code
graph_phillips("SI", ytick = 1, position = c(0.8, 0.8))
Slovakia
Code
graph_phillips("SK", ytick = 1, position = c(0.8, 0.8))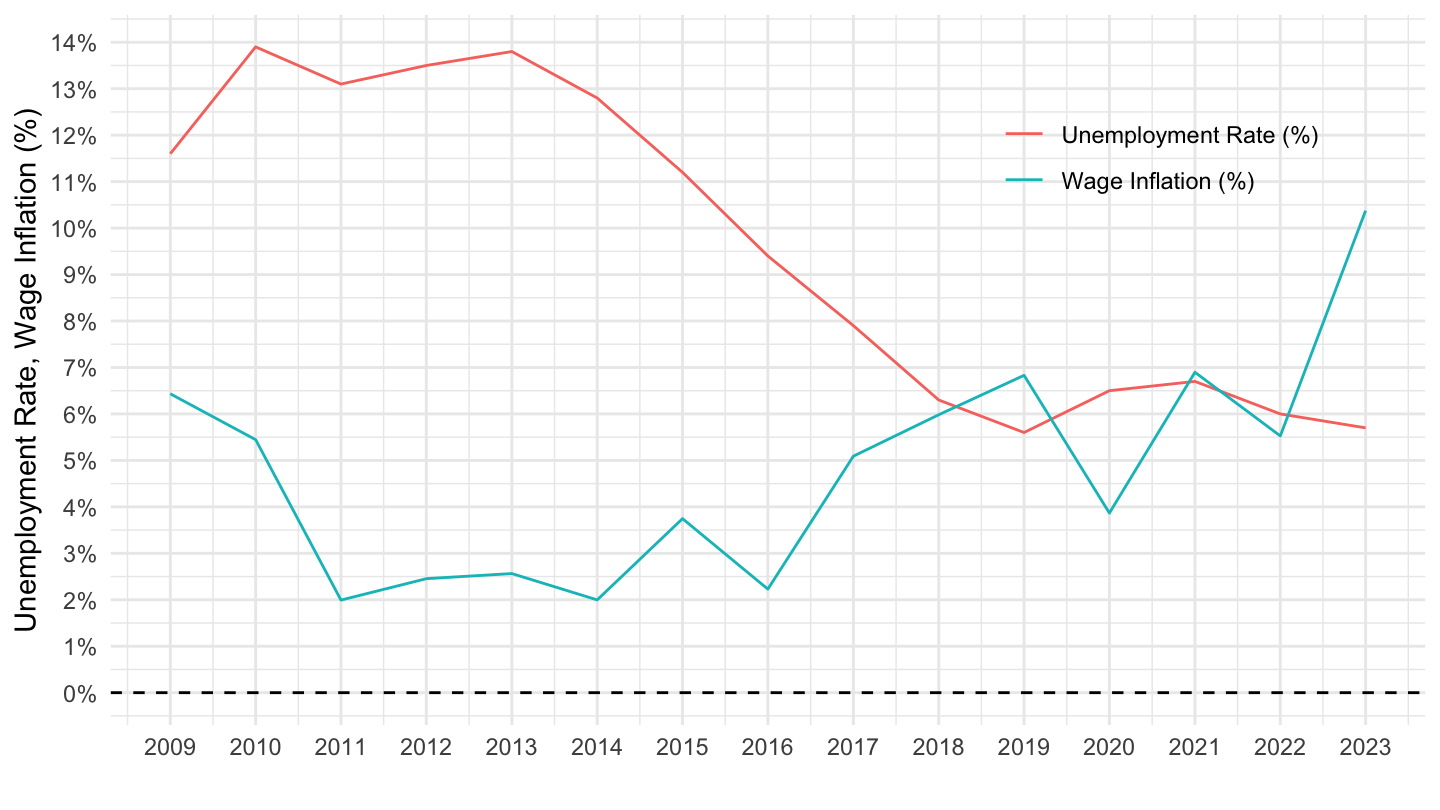
United Kingdom
Code
#graph_phillips("UK", ytick = 1, position = c(0.8, 0.8))