| source | dataset | .html | .qmd | .RData |
|---|---|---|---|---|
| oecd | PRICES_CPI | [2026-08-17] | https://fgee | olf.com/ |
| oecd | STLABOUR | [2026-08-17] | https://fgee | olf.com/ |
Phillips curves - phillips
Data - OECD
Info
LAST_COMPILE
| LAST_COMPILE |
|---|
| 2026-08-18 |
LRHUTTTT and CPALTT01, Annual
How much data ?
Range
Code
STLABOUR |>
  filter(SUBJECT == "LRHUTTTT",
         FREQUENCY == "A") |>
  bind_rows(PRICES_CPI |>
              filter(SUBJECT %in% c("CPALTT01"),
                     FREQUENCY == "A",
                     MEASURE == "GY")) |>
  group_by(SUBJECT, LOCATION) |>
  arrange(obsTime) |>
  summarise(range = paste0(first(obsTime), "-", last(obsTime), ", Nobs: ", n())) |>
  left_join(tibble(SUBJECT = c("LRHUTTTT", "CPALTT01"),
                   Subject = c("Unemployment",
                               "Inflation")), by = "SUBJECT") |>
  ungroup() |>
  select(-SUBJECT) |>
  spread(Subject, range) |>
  arrange(desc(`Unemployment`)) |>
  left_join(PRICES_CPI_var$LOCATION, by = "LOCATION") |>
  mutate(Flag = gsub(" ", "-", str_to_lower(Location)),
         Flag = paste0('<img src="../../icon/flag/vsmall/', Flag, '.png" alt="Flag">')) |>
  select(Flag, Location, LOCATION, everything()) %>%
  {if (is_html_output()) datatable(., filter = 'top', rownames = F, escape = F) else .}
Nobs - Annual
Code
STLABOUR |>
  filter(SUBJECT == "LRHUTTTT",
         FREQUENCY == "A") |>
  bind_rows(PRICES_CPI |>
              filter(SUBJECT %in% c("CPALTT01"),
                     FREQUENCY == "A",
                     MEASURE == "GY")) |>
  group_by(SUBJECT, LOCATION) |>
  arrange(obsTime) |>
  summarise(Nobs = n()) |>
  left_join(tibble(SUBJECT = c("LRHUTTTT", "CPALTT01"),
                   Subject = c("Unemployment",
                               "Inflation")), by = "SUBJECT") |>
  ungroup() |>
  select(-SUBJECT) |>
  spread(Subject, Nobs) |>
  arrange(desc(`Unemployment`)) |>
  left_join(PRICES_CPI_var$LOCATION, by = "LOCATION") |>
  mutate(Flag = gsub(" ", "-", str_to_lower(Location)),
         Flag = paste0('<img src="../../icon/flag/vsmall/', Flag, '.png" alt="Flag">')) |>
  select(Flag, Location, LOCATION, everything()) |>
  mutate(Link = gsub(" ", "_", Location),
         Location = paste0('<a  target=_blank href=https://fgeerolf.com/data/oecd/phillips.html#', Link, ' >', Location, ' </a>')) |>
  select(-Link) %>%
  {if (is_html_output()) datatable(., filter = 'top', rownames = F, escape = F) else .}
Nobs - Quarterly
Code
STLABOUR |>
  filter(SUBJECT == "LRHUTTTT",
         FREQUENCY == "Q") |>
  bind_rows(PRICES_CPI |>
              filter(SUBJECT %in% c("CPALTT01"),
                     FREQUENCY == "Q",
                     MEASURE == "GY")) |>
  group_by(SUBJECT, LOCATION) |>
  arrange(obsTime) |>
  summarise(Nobs = n()) |>
  left_join(tibble(SUBJECT = c("LRHUTTTT", "CPALTT01"),
                   Subject = c("Unemployment",
                               "Inflation")), by = "SUBJECT") |>
  ungroup() |>
  select(-SUBJECT) |>
  spread(Subject, Nobs) |>
  arrange(desc(`Unemployment`)) |>
  left_join(PRICES_CPI_var$LOCATION, by = "LOCATION") |>
  mutate(Flag = gsub(" ", "-", str_to_lower(Location)),
         Flag = paste0('<img src="../../icon/flag/vsmall/', Flag, '.png" alt="Flag">')) |>
  select(Flag, Location, LOCATION, everything()) |>
  mutate(Link = gsub(" ", "_", Location),
         Location = paste0('<a  target=_blank href=https://fgeerolf.com/data/oecd/phillips.html#', Link, ' >', Location, ' </a>')) |>
  select(-Link) %>%
  {if (is_html_output()) datatable(., filter = 'top', rownames = F, escape = F) else .}
Nobs - Monthly
Code
STLABOUR |>
  filter(SUBJECT == "LRHUTTTT",
         FREQUENCY == "M") |>
  bind_rows(PRICES_CPI |>
              filter(SUBJECT %in% c("CPALTT01"),
                     FREQUENCY == "M",
                     MEASURE == "GY")) |>
  group_by(SUBJECT, LOCATION) |>
  arrange(obsTime) |>
  summarise(Nobs = n()) |>
  left_join(tibble(SUBJECT = c("LRHUTTTT", "CPALTT01"),
                   Subject = c("Unemployment",
                               "Inflation")), by = "SUBJECT") |>
  ungroup() |>
  select(-SUBJECT) |>
  spread(Subject, Nobs) |>
  arrange(desc(`Unemployment`)) |>
  left_join(PRICES_CPI_var$LOCATION, by = "LOCATION") |>
  mutate(Flag = gsub(" ", "-", str_to_lower(Location)),
         Flag = paste0('<img src="../../icon/flag/vsmall/', Flag, '.png" alt="Flag">')) |>
  select(Flag, Location, LOCATION, everything()) |>
  mutate(Link = gsub(" ", "_", Location),
         Location = paste0('<a  target=_blank href=https://fgeerolf.com/data/oecd/phillips.html#', Link, ' >', Location, ' </a>')) |>
  select(-Link) %>%
  {if (is_html_output()) datatable(., filter = 'top', rownames = F, escape = F) else .}
graph_inflation_unemployment function
Code
graph_inflation_unemployment <- function(iso3c = "FRA", grid = 2, freq = "A", position = c(0.7, 0.8), minyear = 1945){
  STLABOUR |>
  filter(SUBJECT == "LRHUTTTT",
         LOCATION == iso3c,
         FREQUENCY == freq,
         MEASURE == "ST") |>
  bind_rows(PRICES_CPI |>
              filter(LOCATION == iso3c,
                     SUBJECT %in% c("CPALTT01"),
                     FREQUENCY == freq,
                     MEASURE == "GY")) %>%
  {if (freq == "A") year_to_date(.) else if (freq == "Q") quarter_to_date(.) else month_to_date(.)} |>
  filter(year(date) >= minyear) |>
  select(date, SUBJECT, obsValue) |>
  group_by(date) |>
  filter(n() == 2) |>
  left_join(tibble(SUBJECT = c("LRHUTTTT", "CPALTT01"),
                   Subject = c("Unemployment Rate (%)",
                               "Inflation Rate (%)")), by = "SUBJECT") |>
  ggplot() + theme_minimal() + xlab("") + ylab("Unemployment, Inflation") +
  geom_line(aes(x = date, y = obsValue / 100, color = Subject)) +
  theme(legend.position = position,
        legend.title = element_blank()) +
  scale_x_date(breaks = seq(1700, 2100, grid) |> paste0("-01-01") |> as.Date(),
               labels = date_format("%Y")) +
  scale_y_continuous(breaks = 0.01*seq(-50, 100, 1),
                     labels = percent_format(accuracy = 1, prefix = "")) +
  scale_color_manual(values = viridis(3)[1:2])
}
Switzerland
Annual
Code
graph_inflation_unemployment("CHE", 1)
Quarterly
Code
graph_inflation_unemployment("CHE", 2, "Q", pos = c(0.8, 0.5))
Turkey
Annual
Code
graph_inflation_unemployment("TUR", 1, pos = c(0.2, 0.9))
Quarterly
Code
graph_inflation_unemployment("TUR", 1, "Q", pos = c(0.2, 0.9))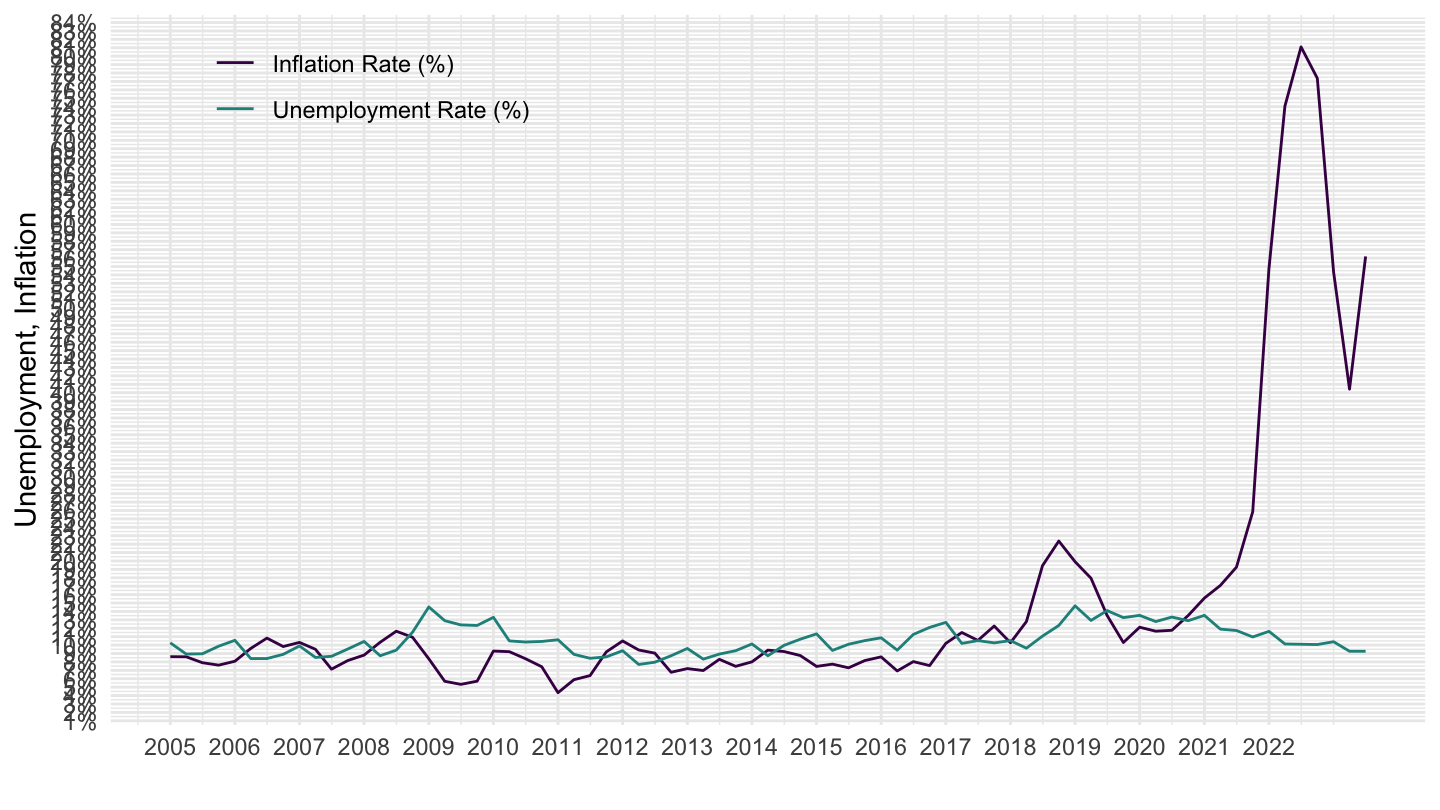
Monthly
Code
graph_inflation_unemployment("TUR", 1, "M", pos = c(0.2, 0.9))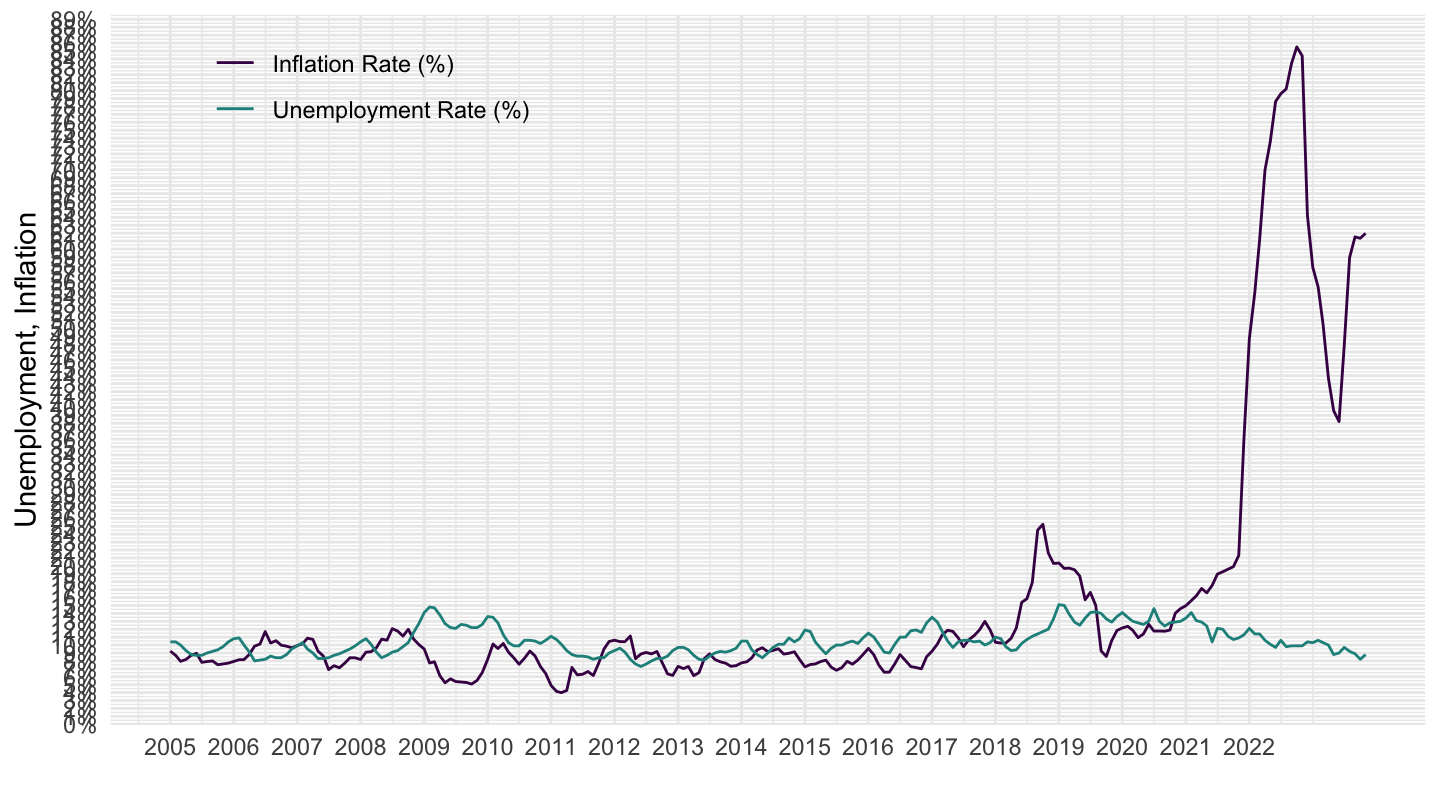
Iceland
Annual
Code
graph_inflation_unemployment("ISL", 1)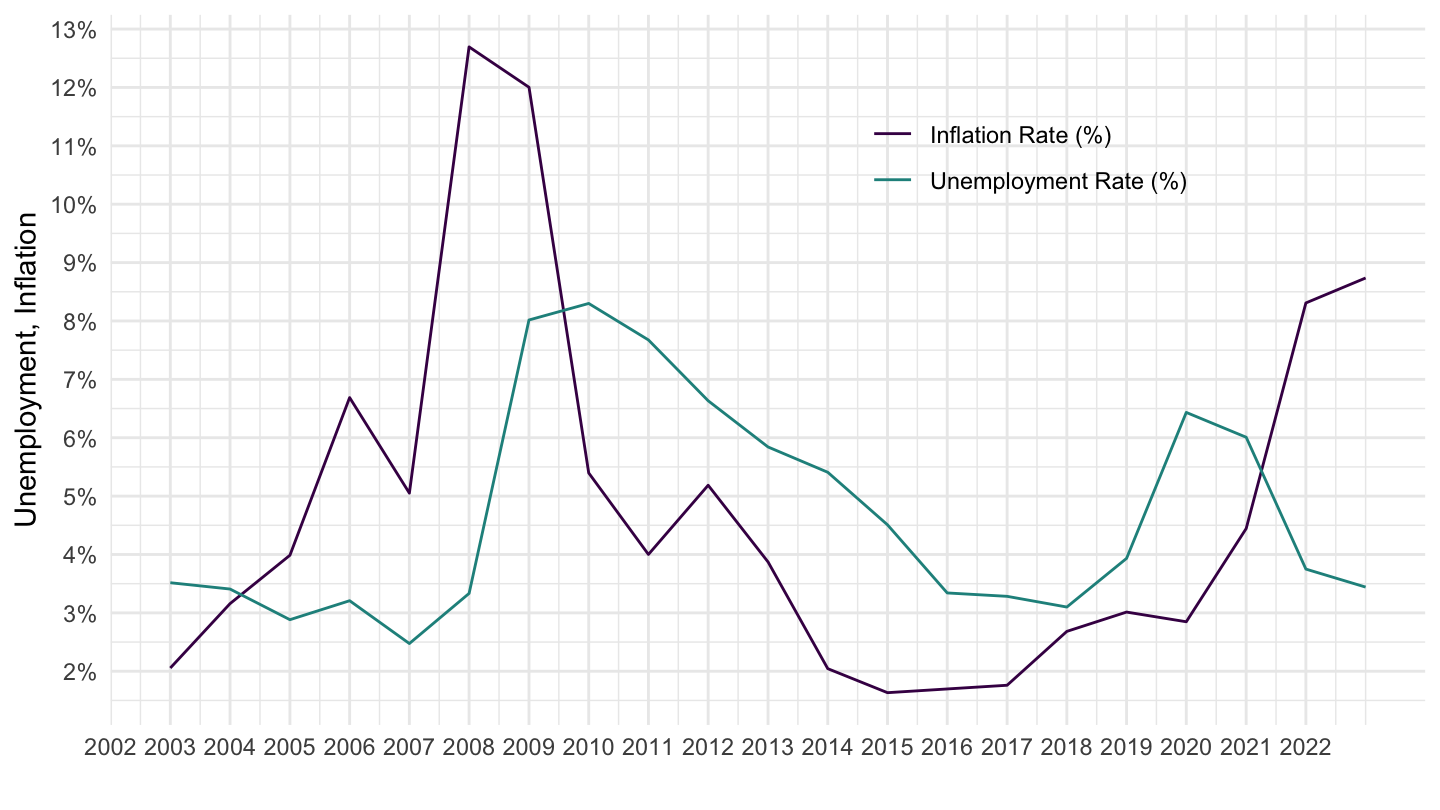
Quarterly
Code
graph_inflation_unemployment("ISL", 1, "Q")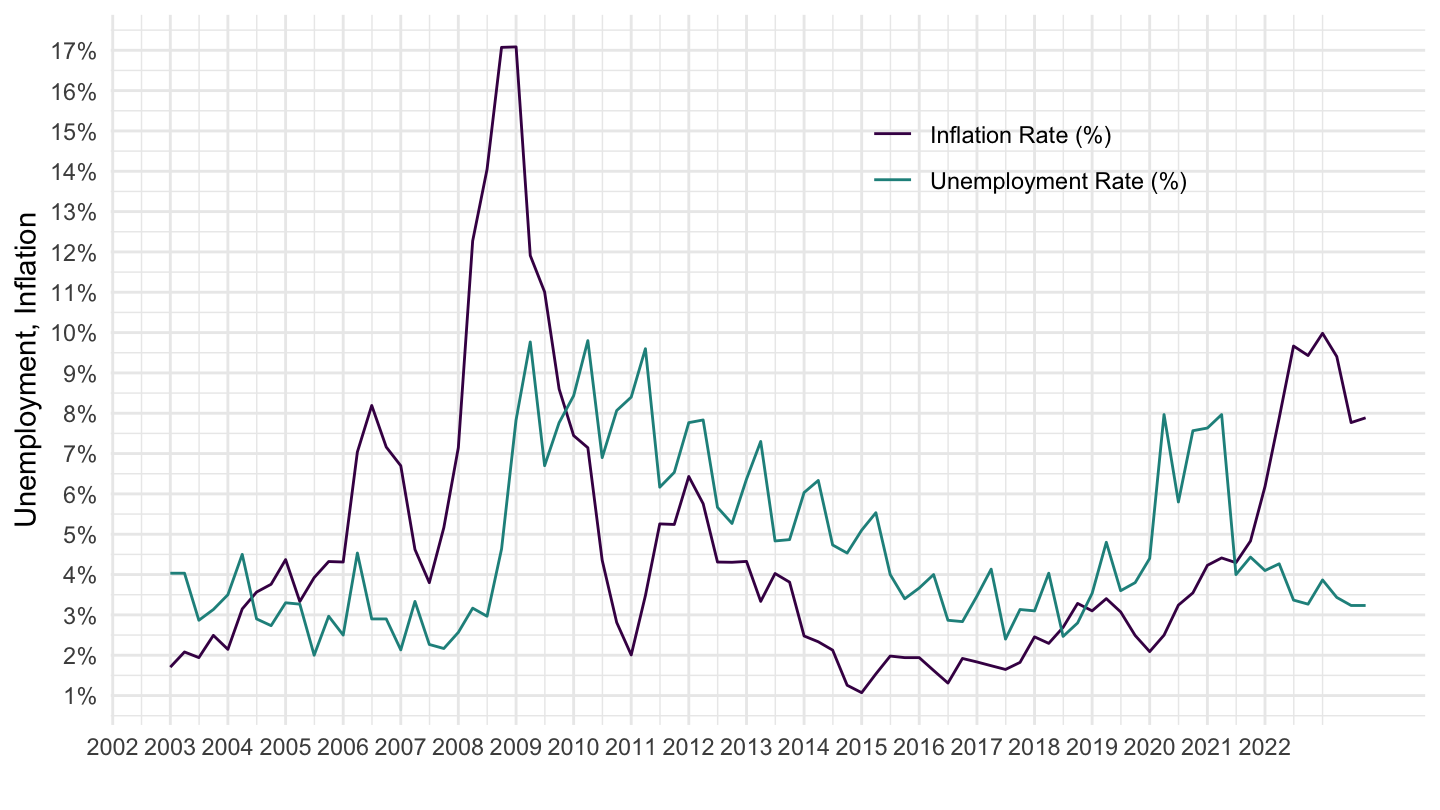
Monthly
Code
graph_inflation_unemployment("ISL", 1, "M")
Greece
Annual
Code
graph_inflation_unemployment("GRC", 1, pos = c(0.2, 0.8))
Quarterly
Code
graph_inflation_unemployment("GRC", 1, "Q", pos = c(0.2, 0.8))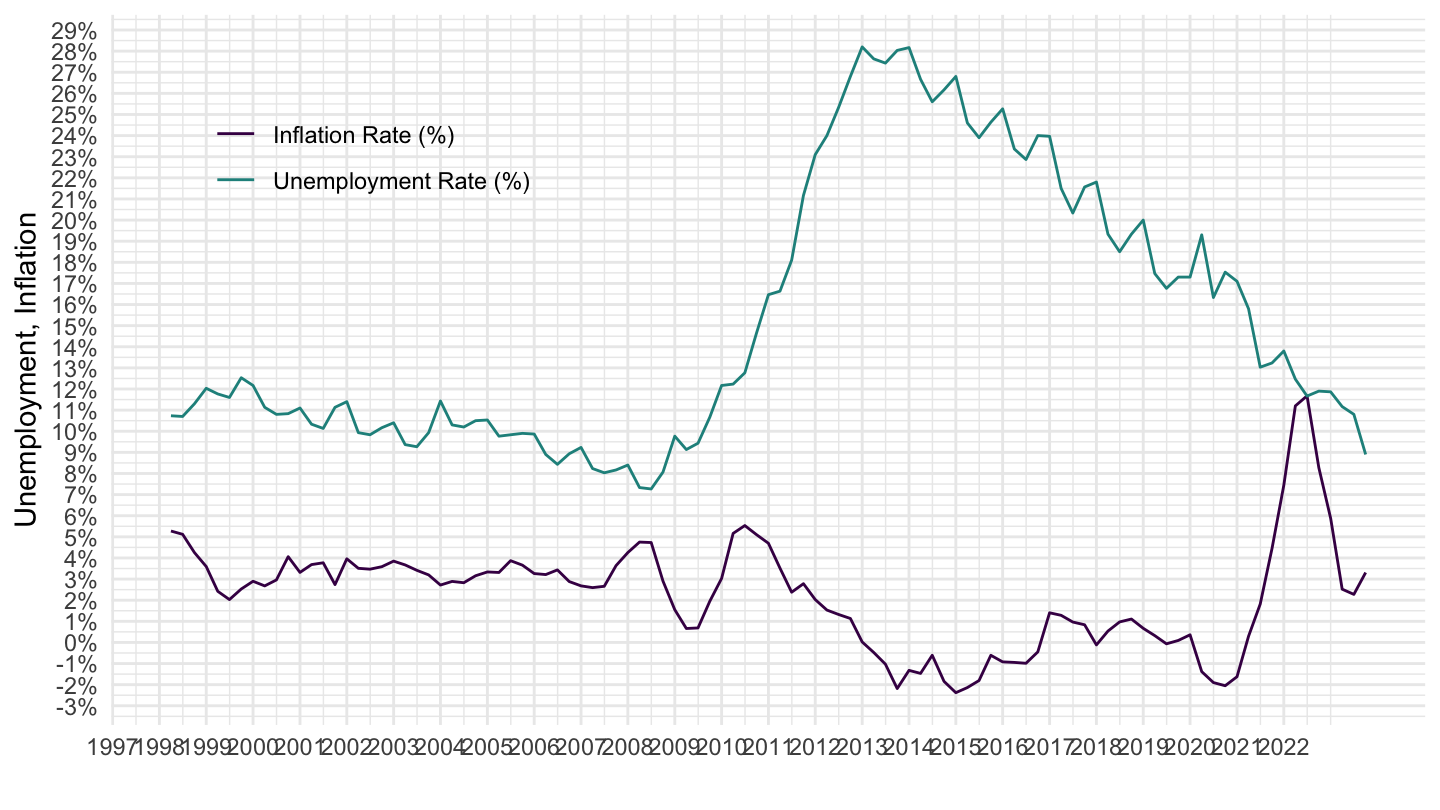
Monthly
Code
graph_inflation_unemployment("GRC", 1, "M", pos = c(0.2, 0.8))
Slovak Republic
Code
graph_inflation_unemployment("SVK", 1, pos = c(0.8, 0.9))
Estonia
Code
graph_inflation_unemployment("EST", 1)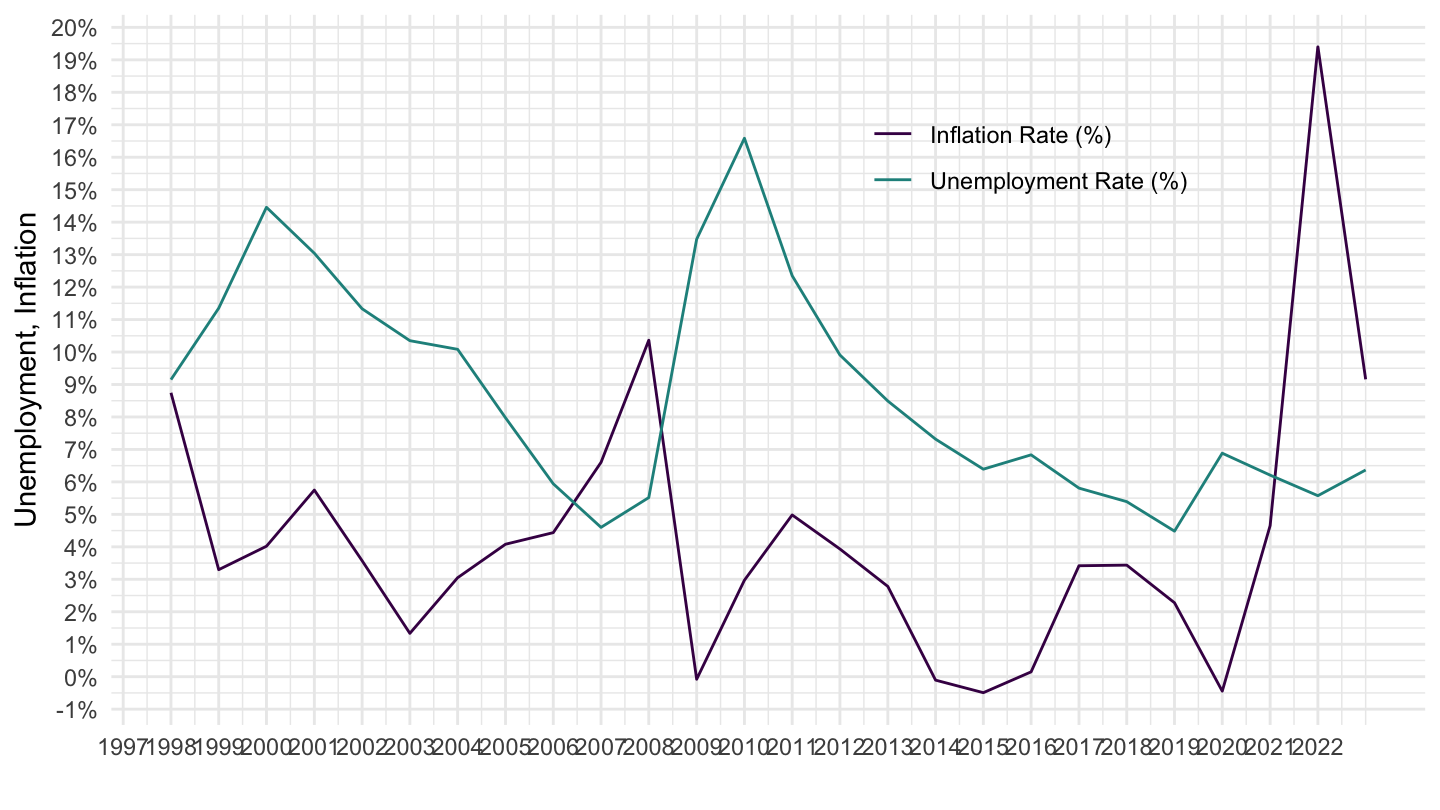
Poland
Code
graph_inflation_unemployment("POL", 2)
Hungary
Code
graph_inflation_unemployment("HUN", 2)
Slovenia
Code
graph_inflation_unemployment("SVN", 2, pos = c(0.2, 0.2))
Israel
Code
graph_inflation_unemployment("ISR", 2)
Austria
Code
graph_inflation_unemployment("AUT", 2)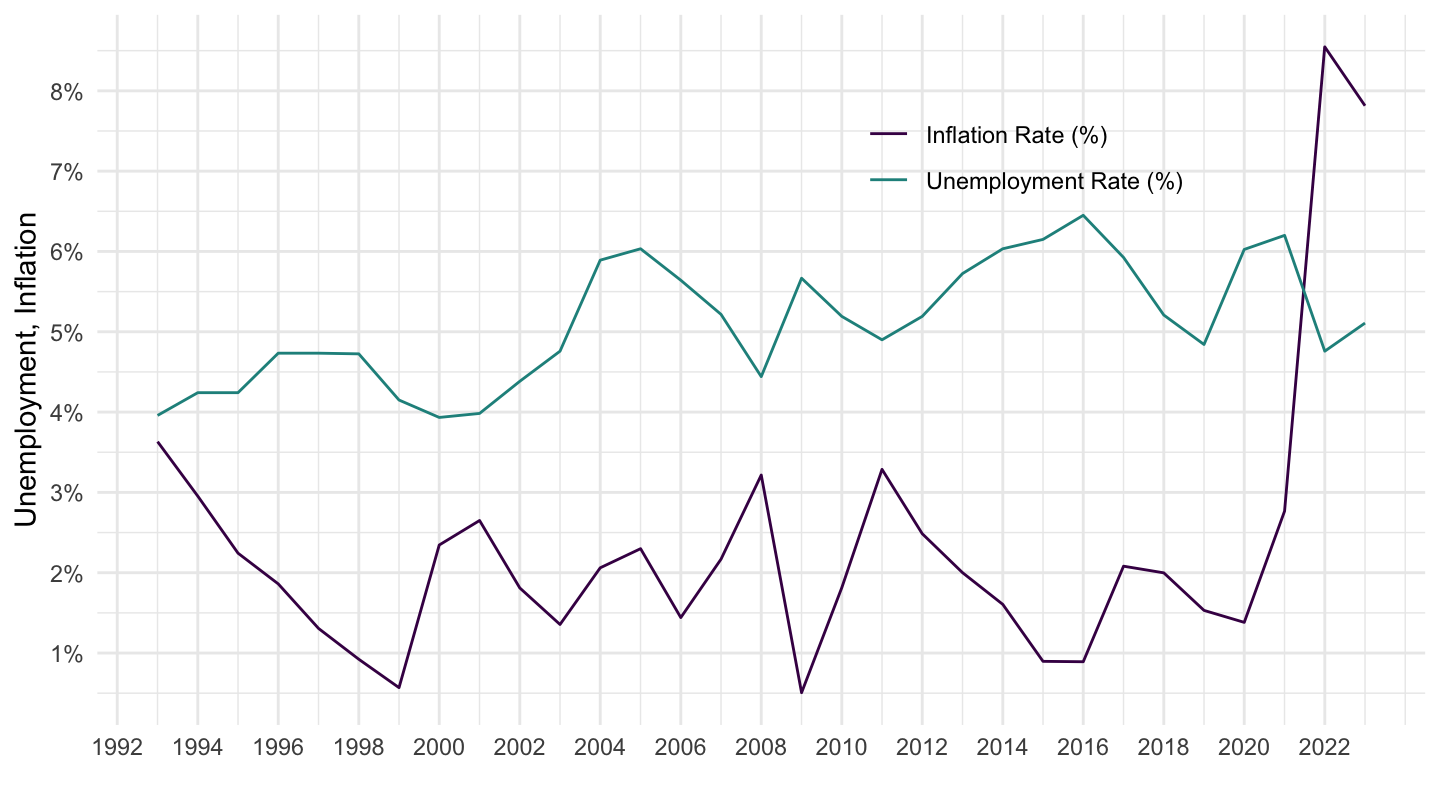
Czech Republic
Code
graph_inflation_unemployment("CZE", 2)
Germany
Annual
Code
graph_inflation_unemployment("DEU", 2)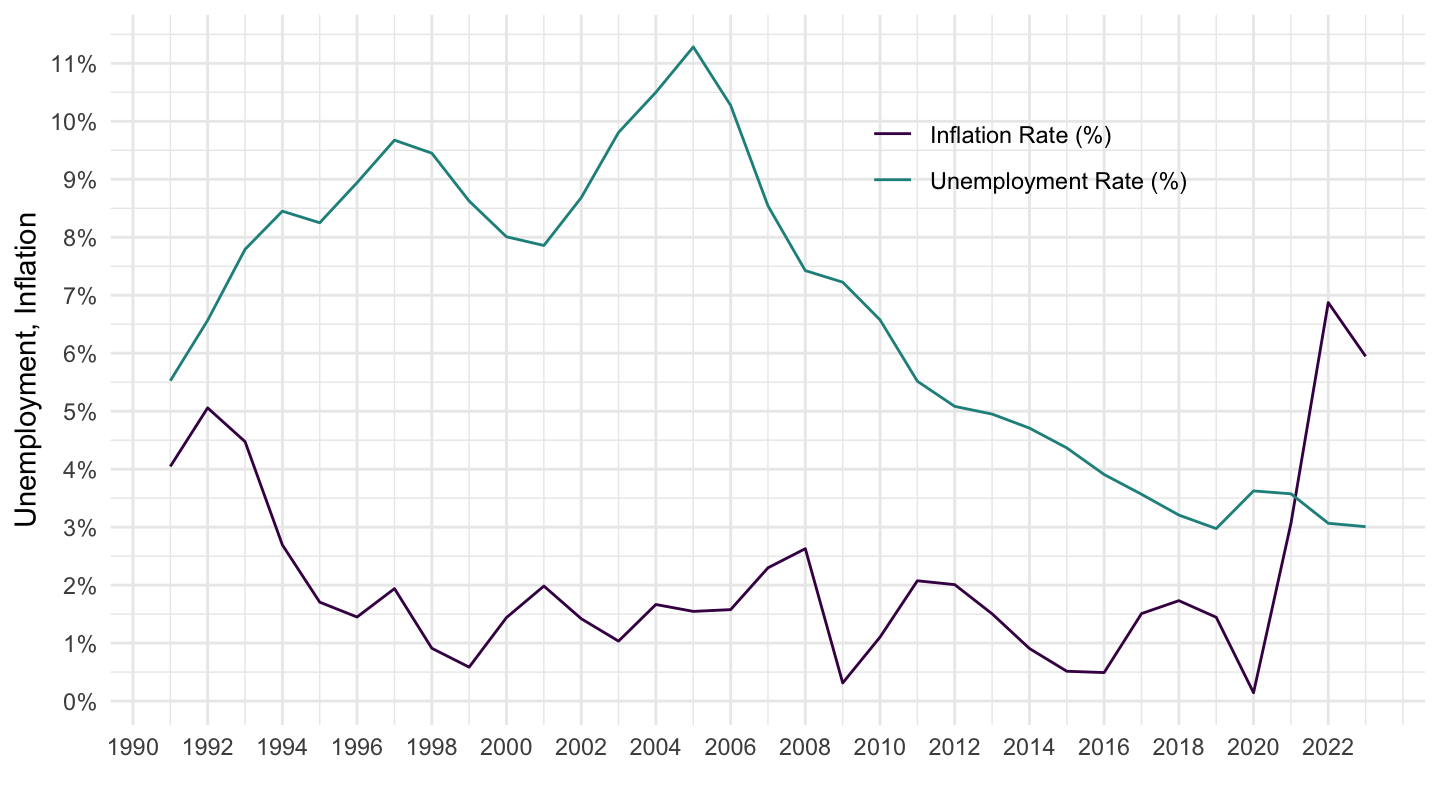
Quarterly
Code
graph_inflation_unemployment("DEU", 2, "Q")
Monthly
Code
graph_inflation_unemployment("DEU", 2, "M")
Korea
Code
graph_inflation_unemployment("KOR", 2)
Norway
Code
graph_inflation_unemployment("NOR", 2)
Finland
Code
graph_inflation_unemployment("FIN", 2)
Spain
Code
graph_inflation_unemployment("ESP", 2)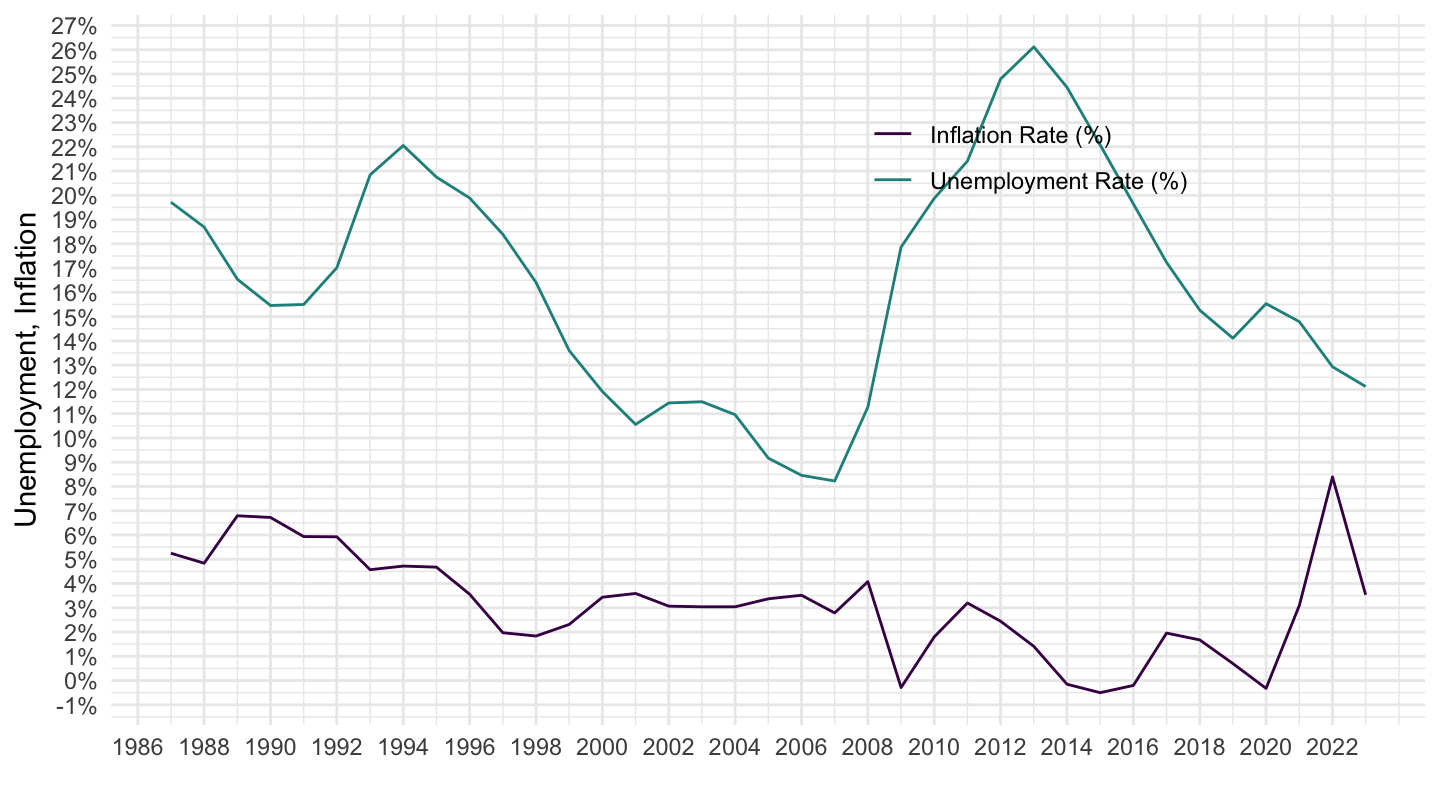
Mexico
Code
graph_inflation_unemployment("MEX", 2)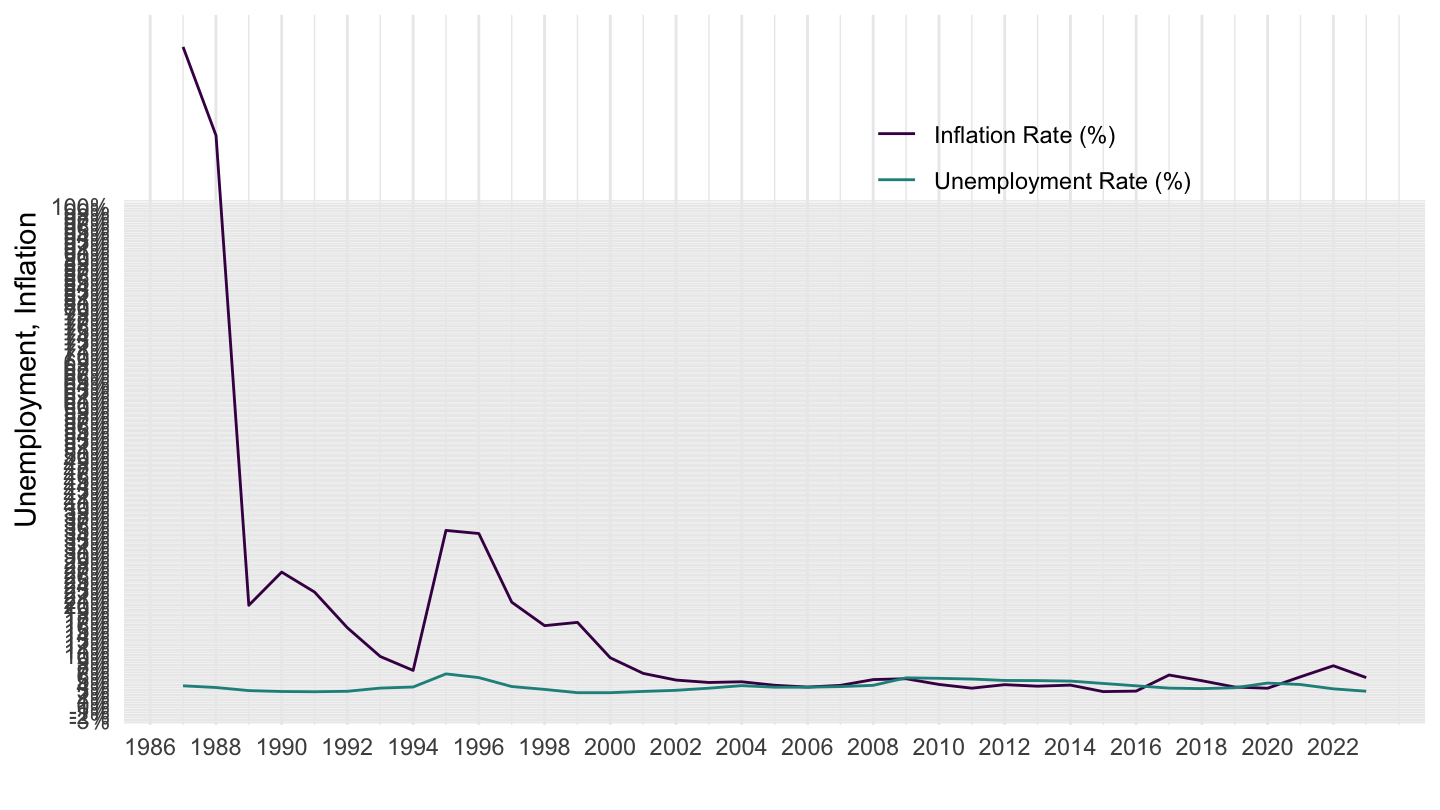
Chile
Code
graph_inflation_unemployment("CHL", 2)
Belgium
Code
graph_inflation_unemployment("BEL", 2)
Denmark
Code
graph_inflation_unemployment("DNK", 2)
France
Annual
Code
graph_inflation_unemployment("FRA", 2, pos = c(0.85, 0.9))
Quarterly
Code
graph_inflation_unemployment("FRA", 2, "Q", pos = c(0.85, 0.9))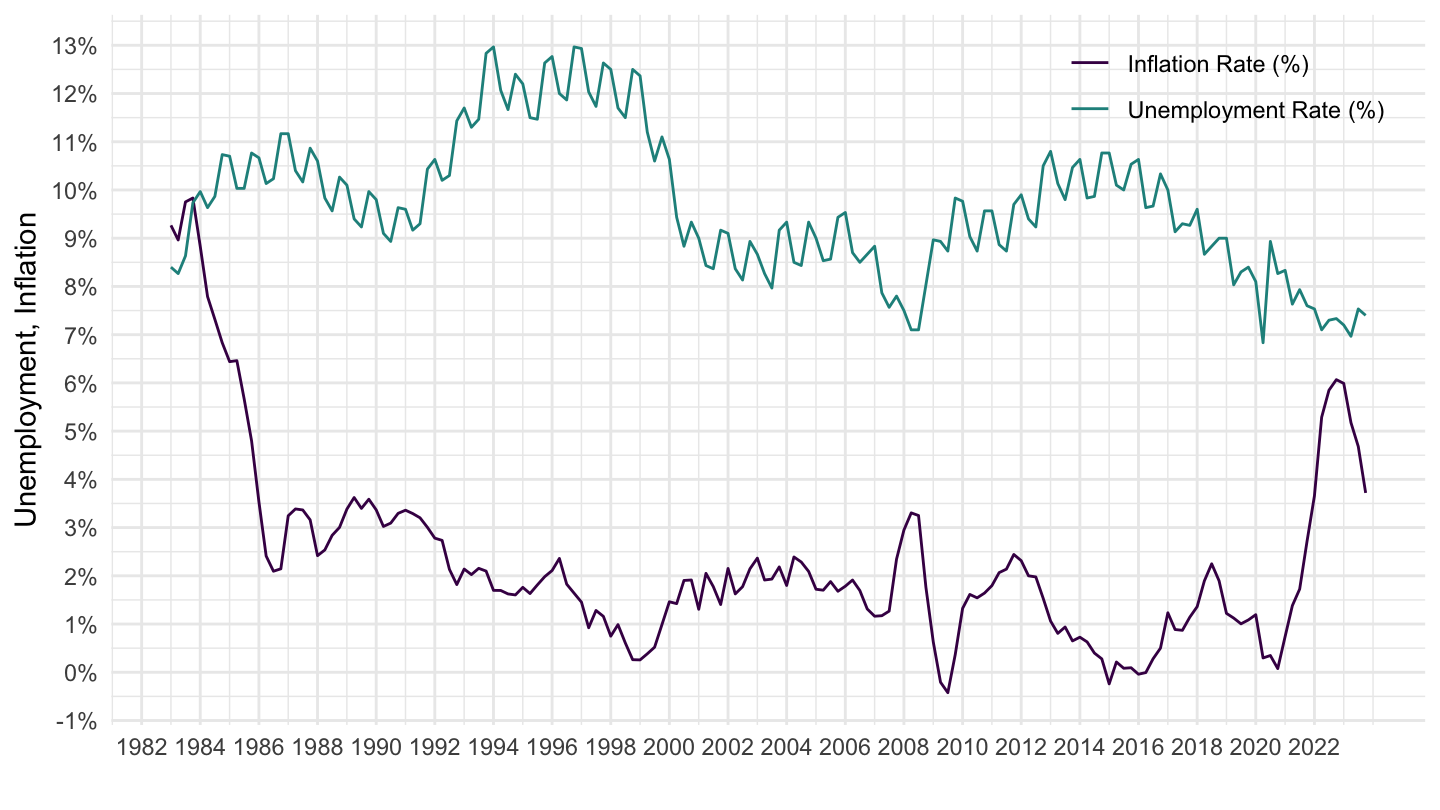
Monthly
Code
graph_inflation_unemployment("FRA", 2, "M", pos = c(0.85, 0.9))
United Kingdom
Annual
Code
graph_inflation_unemployment("GBR", 2)
Quarterly
Code
graph_inflation_unemployment("GBR", 2, "Q", pos = c(0.85, 0.9))
Monthly
Code
graph_inflation_unemployment("GBR", 2, "M", pos = c(0.85, 0.9))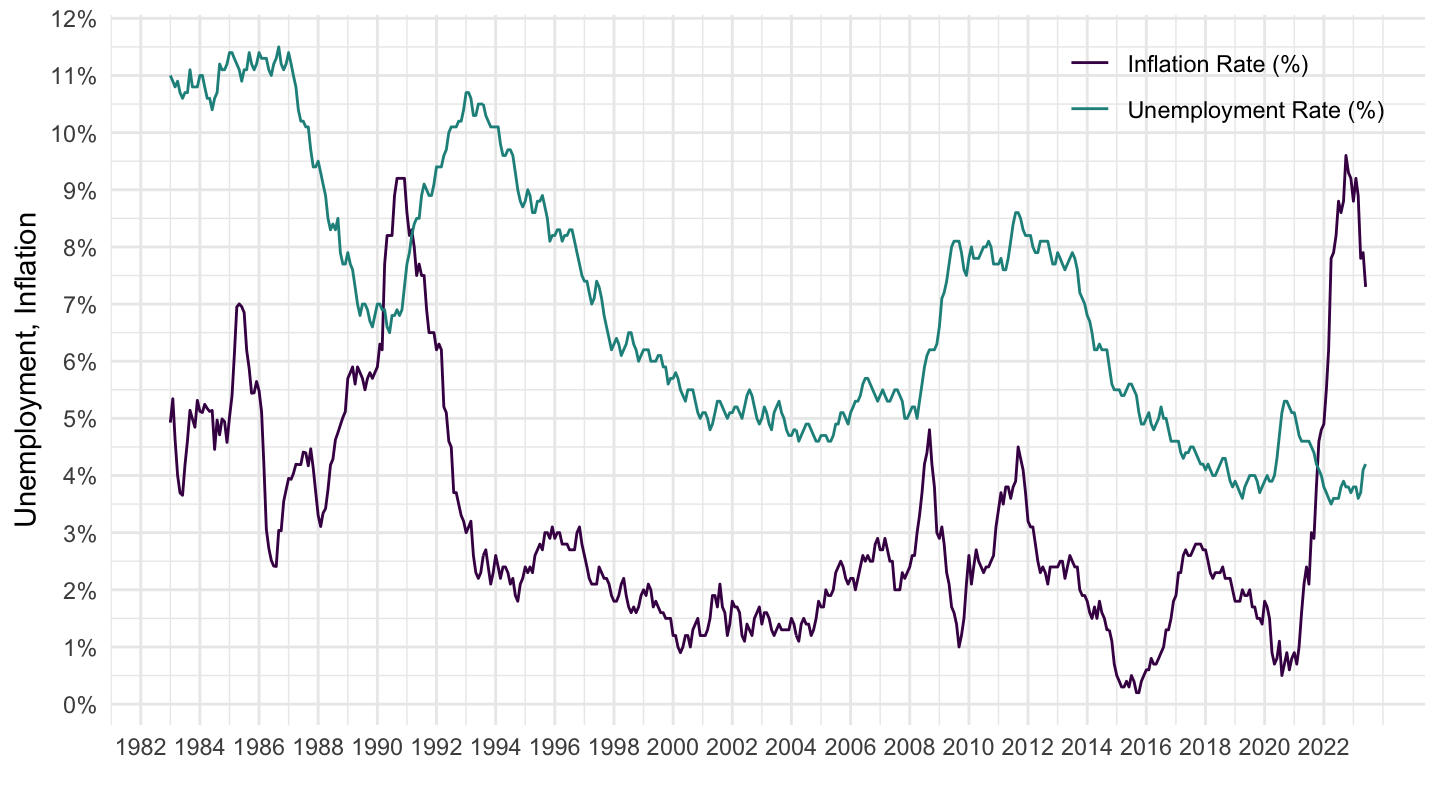
Ireland
Code
graph_inflation_unemployment("IRL", 2)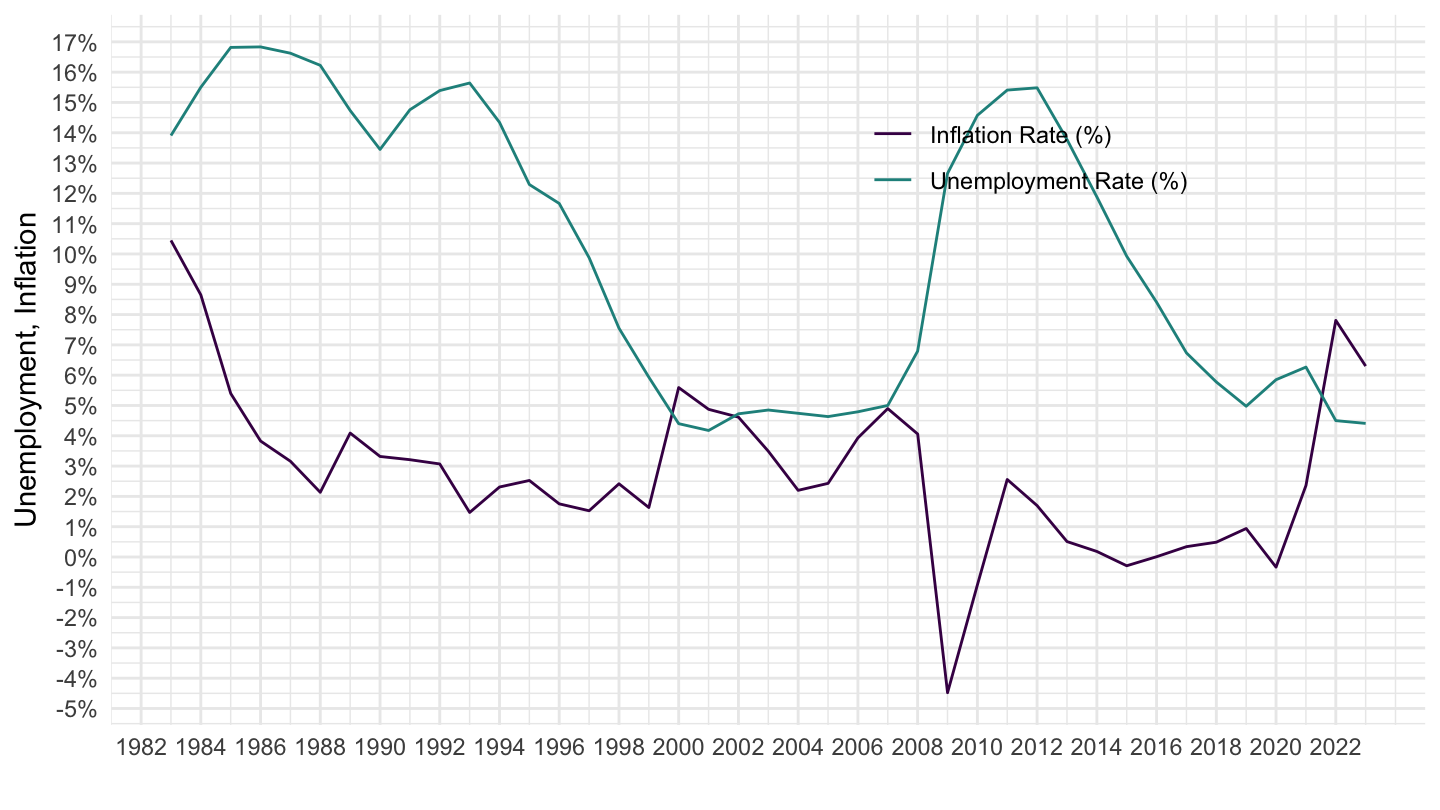
Italy
Annual
Code
graph_inflation_unemployment("ITA", 2, pos = c(0.6, 0.9))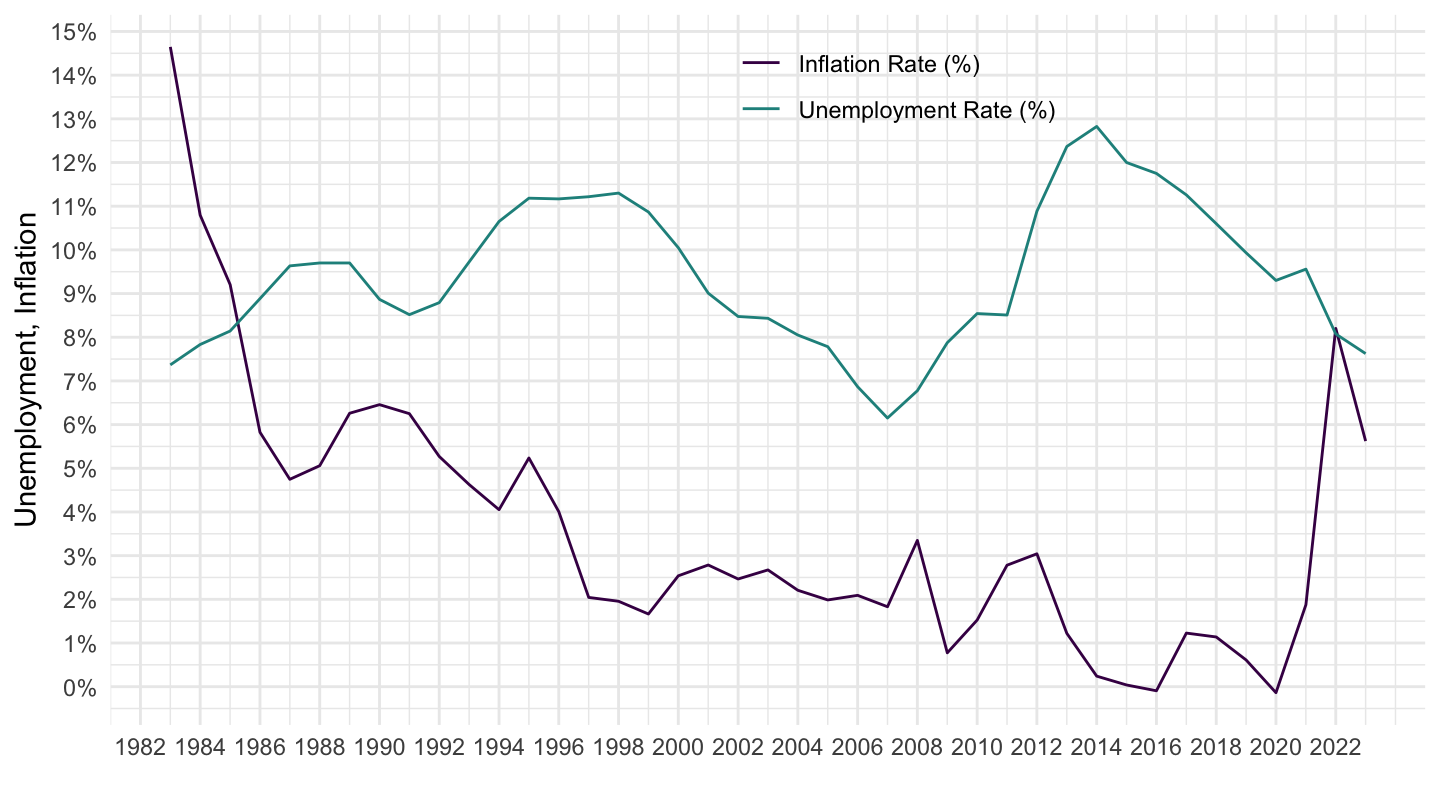
Quarterly
Code
graph_inflation_unemployment("ITA", 2, "Q", pos = c(0.6, 0.9))
Monthly
Code
graph_inflation_unemployment("ITA", 2, "M", pos = c(0.6, 0.9))
Luxembourg
Code
graph_inflation_unemployment("LUX", 2)
Nertherlands
Code
graph_inflation_unemployment("NLD", 2)
Portugal
Annual
Code
graph_inflation_unemployment("PRT", 2)
Quarterly
Code
graph_inflation_unemployment("PRT", 2, "Q")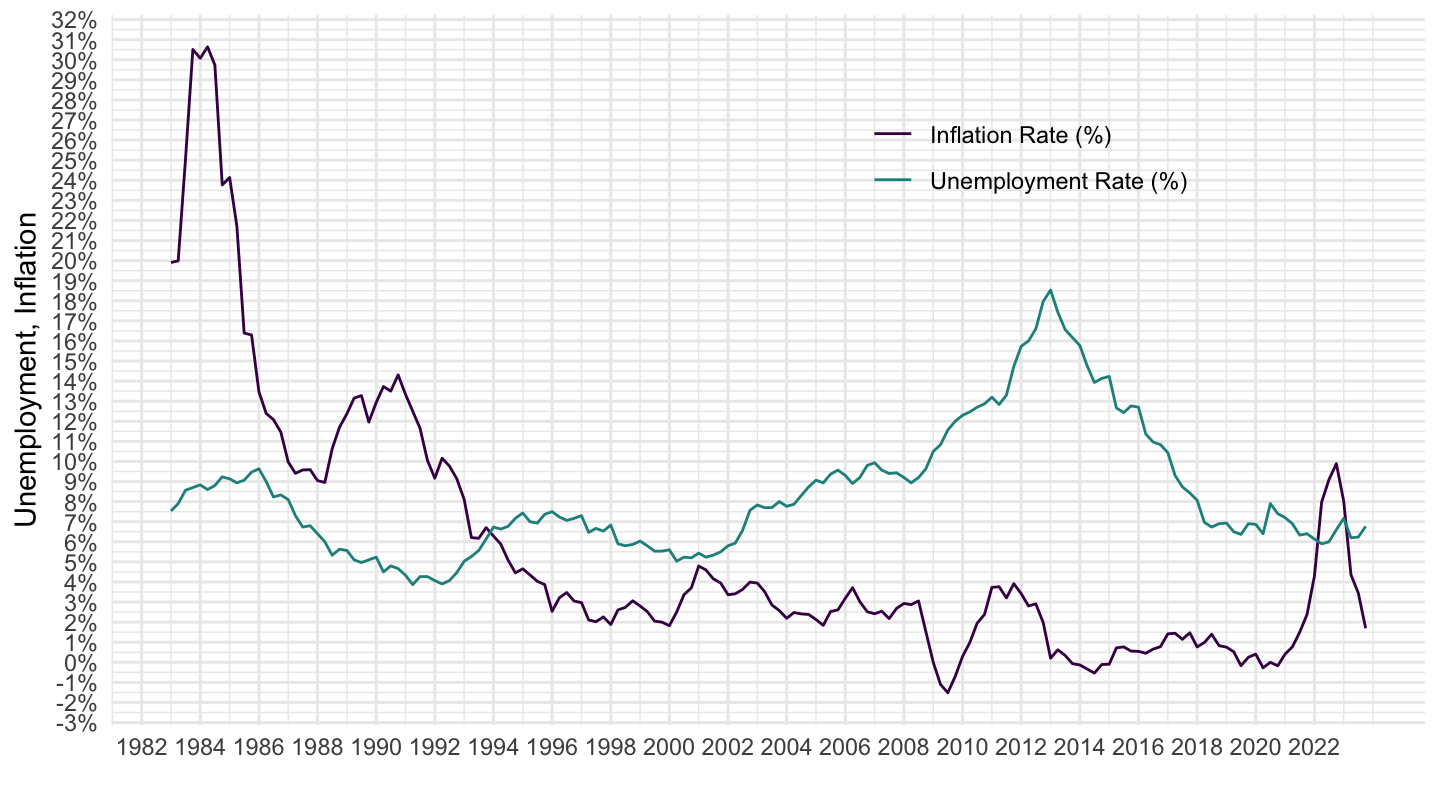
Monthly
All
Code
graph_inflation_unemployment("PRT", 2, "M")
2002-
Code
graph_inflation_unemployment("PRT", 2, "M", minyear = 2002, pos = c(0.85, 0.9))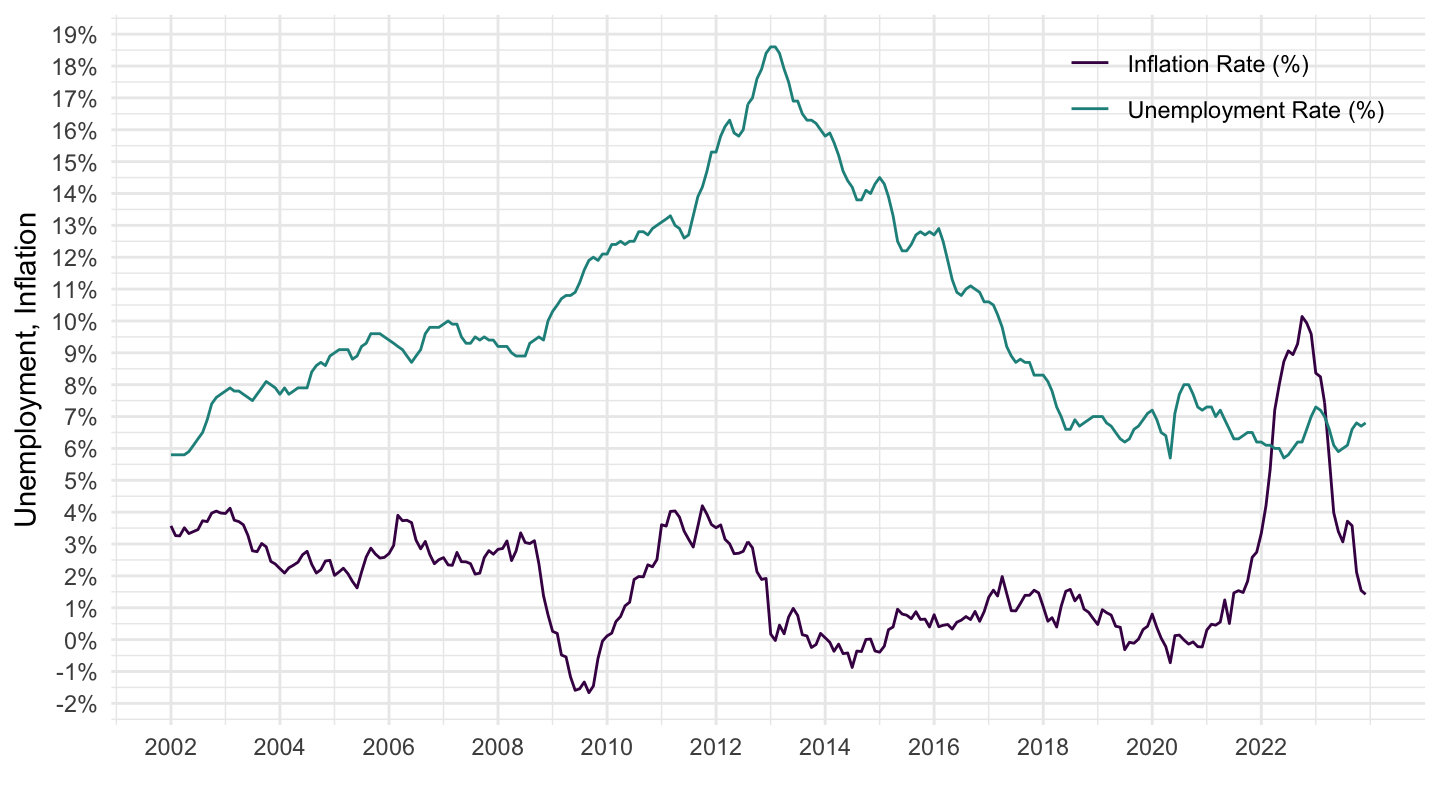
Sweden
Code
graph_inflation_unemployment("SWE", 2)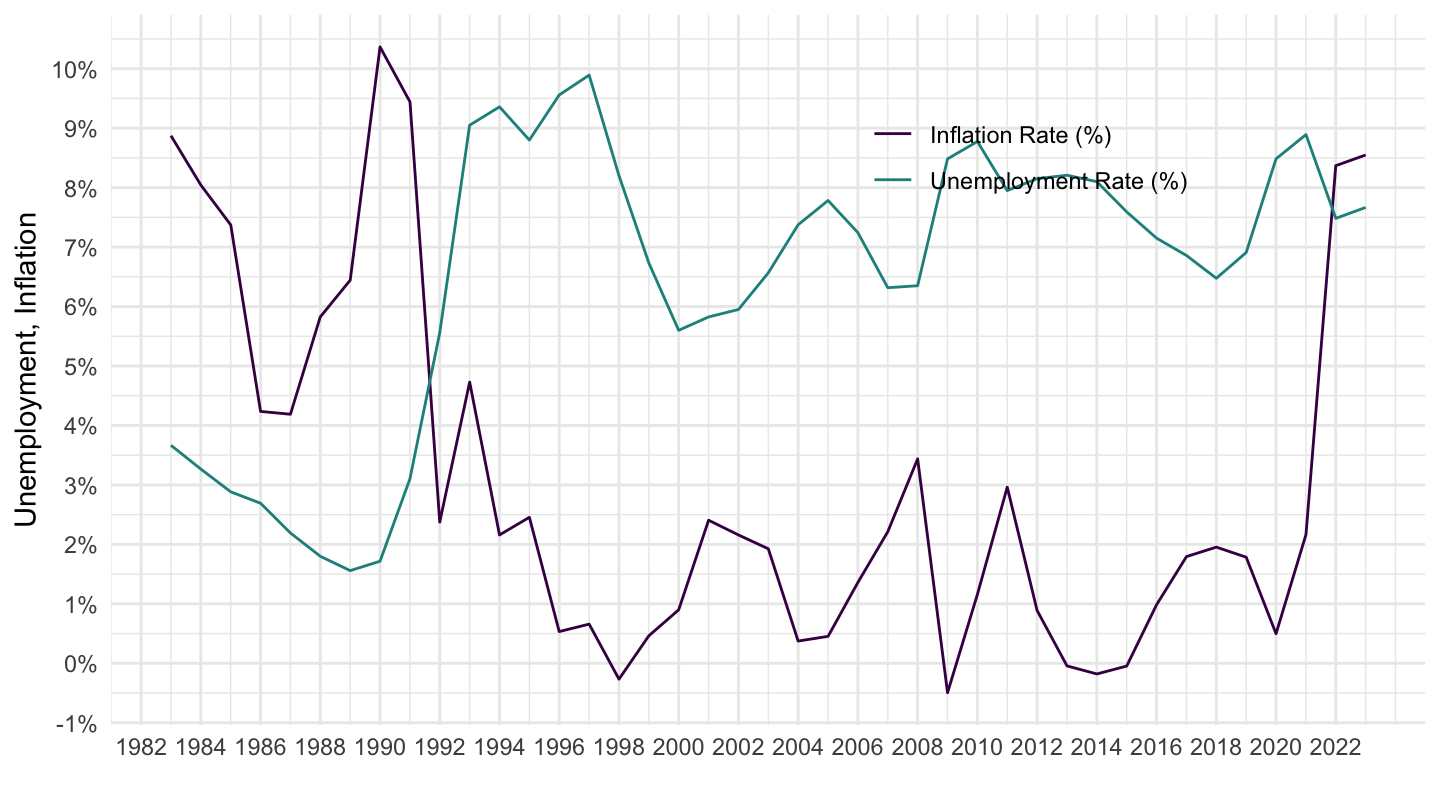
Australia
Code
graph_inflation_unemployment("AUS", 2)
Canada
Code
graph_inflation_unemployment("CAN", 2)
Japan
Annual
Code
graph_inflation_unemployment("JPN", 5)
Quarterly
Code
graph_inflation_unemployment("JPN", 5, "Q")
Monthly
Code
graph_inflation_unemployment("JPN", 5, "M")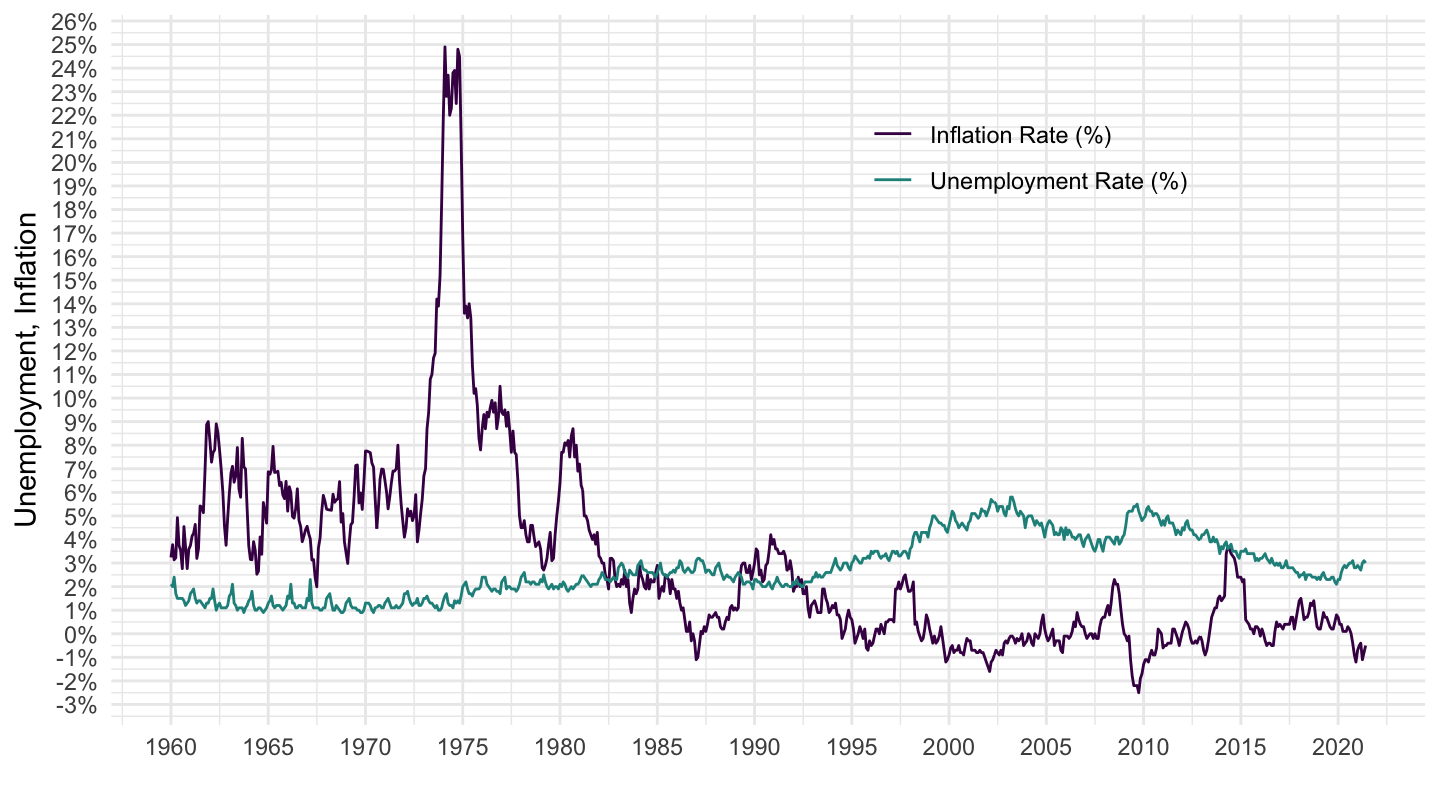
New Zealand
Annual
Code
graph_inflation_unemployment("NZL", 5)
Quarterly
Code
graph_inflation_unemployment("NZL", 2, "Q")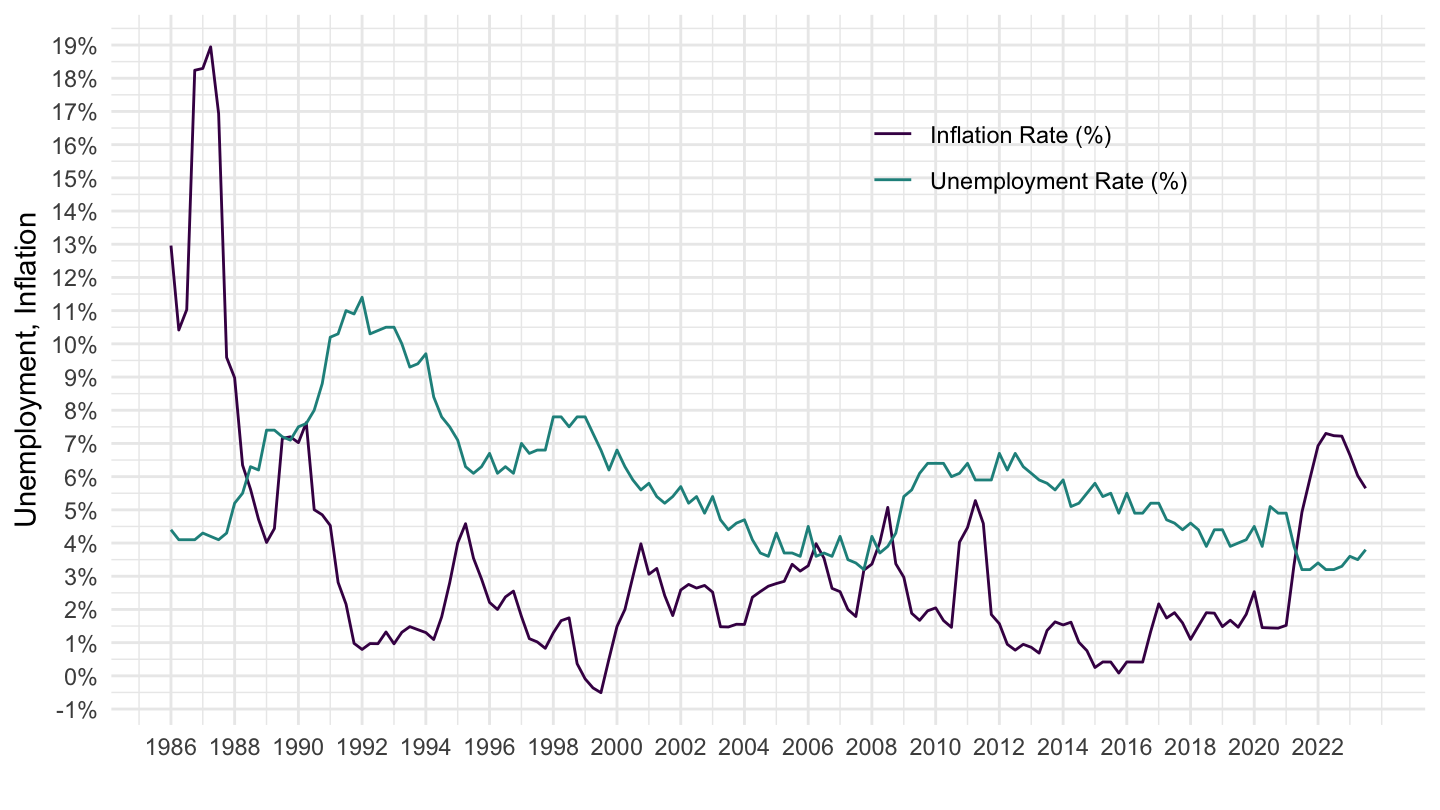
United States
Annual
Code
graph_inflation_unemployment("USA", 5)
Quarterly
Code
graph_inflation_unemployment("USA", 5, "Q")
Monthly
Code
graph_inflation_unemployment("USA", 5, "M")