
Last compile: 09 oct. 2026, 23:09
Structure
LAST_COMPILE
| LAST_COMPILE |
|---|
| 2026-10-09 |
Last
Code
prc_hicp_midx |>
  group_by(time) |>
  summarise(Nobs = n()) |>
  arrange(desc(time)) |>
  head(1) |>
print_table_conditional()| time | Nobs |
|---|---|
| 2025M12 | 27318 |
coicop
All
Code
prc_hicp_midx |>
  left_join(coicop, by = "coicop") |>
  group_by(coicop, Coicop) |>
  summarise(Nobs = n()) |>
  arrange(-Nobs) |>
  print_table_conditional()
2-digit (12 categories)
Code
prc_hicp_midx |>
  left_join(coicop, by = "coicop") |>
  filter(nchar(coicop) == 4 & substr(coicop, 1, 2) == "CP") |>
  group_by(coicop, Coicop) |>
  summarise(Nobs = n()) |>
  arrange(-Nobs) |>
print_table_conditional()| coicop | Coicop | Nobs |
|---|---|---|
| CP00 | All-items HICP | 40745 |
| CP01 | Food and non-alcoholic beverages | 40745 |
| CP02 | Alcoholic beverages, tobacco and narcotics | 40745 |
| CP03 | Clothing and footwear | 40745 |
| CP04 | Housing, water, electricity, gas and other fuels | 40745 |
| CP05 | Furnishings, household equipment and routine household maintenance | 40745 |
| CP06 | Health | 40745 |
| CP07 | Transport | 40745 |
| CP08 | Communications | 40745 |
| CP09 | Recreation and culture | 40745 |
| CP11 | Restaurants and hotels | 40745 |
| CP12 | Miscellaneous goods and services | 40745 |
| CP10 | Education | 40291 |
3-digit (42 categories)
Code
prc_hicp_midx |>
  left_join(coicop, by = "coicop") |>
  filter(nchar(coicop) == 5) |>
  group_by(coicop, Coicop) |>
  summarise(Nobs = n()) |>
  print_table_conditional()
4-digit (95 categories)
Code
prc_hicp_midx |>
  left_join(coicop, by = "coicop") |>
  filter(nchar(coicop) == 6 & substr(coicop, 1, 2) == "CP") |>
  group_by(coicop, Coicop) |>
  summarise(Nobs = n()) |>
  print_table_conditional()
5-digit (264 categories)
Code
prc_hicp_midx |>
  left_join(coicop, by = "coicop") |>
  filter(nchar(coicop) == 7 & substr(coicop, 1, 2) == "CP") |>
  group_by(coicop, Coicop) |>
  summarise(Nobs = n()) |>
  print_table_conditional()
Non-Coicop
Code
prc_hicp_midx |>
  left_join(coicop, by = "coicop") |>
  filter(substr(coicop, 1, 2) != "CP") |>
  group_by(coicop, Coicop) |>
  summarise(Nobs = n()) |>
  arrange(-Nobs) |>
  print_table_conditional()
geo
Code
prc_hicp_midx |>
  left_join(geo, by = "geo") |>
  group_by(geo, Geo) |>
  summarise(Nobs = n()) |>
  mutate(Flag = gsub(" ", "-", str_to_lower(gsub(" ", "-", Geo))),
         Flag = paste0('<img src="../../icon/flag/vsmall/', Flag, '.png" alt="Flag">')) |>
  select(Flag, everything()) %>%
  {if (is_html_output()) datatable(., filter = 'top', rownames = F, escape = F) else .}
Last
Code
prc_hicp_midx |>
  filter(time == last_time) |>
  select_if(function(col) length(unique(col)) > 1) |>
  left_join(geo, by = "geo") |>
  left_join(coicop, by = "coicop") |>
  select(geo, Geo, coicop, Coicop, values) |>
  print_table_conditional()
2017T1-
Monthly
Code
prc_hicp_midx |>
  filter(unit == "I15",
         coicop %in% c("CP00"),
         geo %in% c("DE", "FR", "IT", "EA20", "ES")) |>
  left_join(geo, by = "geo") |>
  select(geo, Geo, coicop, time, values) |>
  month_to_date() |>
  filter(date >= as.Date("2017-01-01")) |>
  group_by(Geo) |>
  arrange(date) |>
  mutate(values = 100*values/values[1]) |>
  add_flag_color("Geo") |>
  ggplot() + geom_line(aes(x = date, y = values, color = color)) +
  theme_minimal() + xlab("") + ylab("Augmentation vs. Octobre 2021") +
  scale_x_date(breaks = seq.Date(as.Date("2017-01-01"), Sys.Date(), "6 months"),
               labels = date_format("%b %Y")) +
  scale_y_log10(breaks = seq(0, 200, 5)) +
  scale_color_identity() + add_flags +
  theme(legend.position = "none",
        axis.text.x = element_text(angle = 45, vjust = 1, hjust = 1))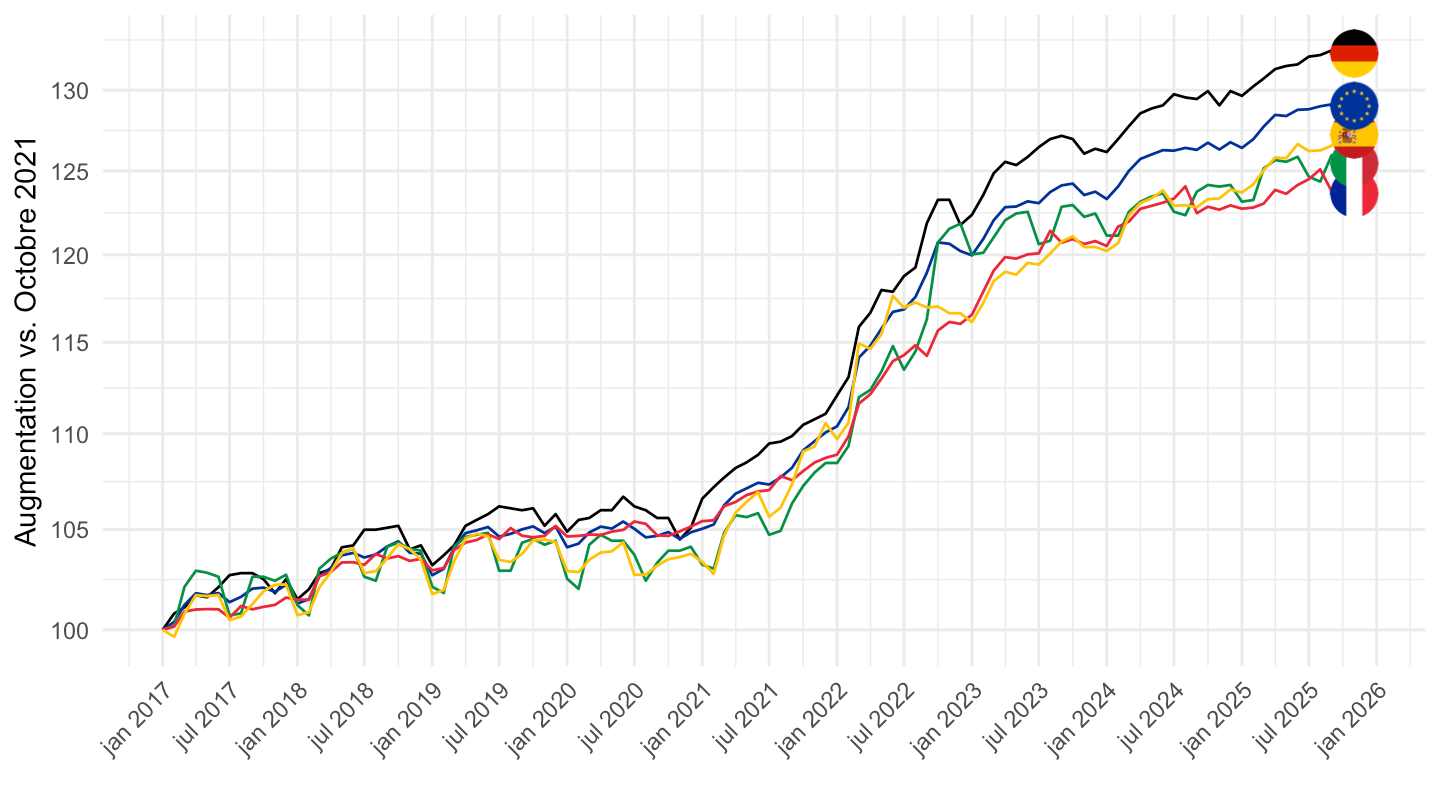
Quarterly
Code
prc_hicp_midx |>
  filter(unit == "I15",
         coicop %in% c("CP00"),
         geo %in% c("DE", "FR", "IT", "EA20", "ES")) |>
  left_join(geo, by = "geo") |>
  select(Geo, time, values) |>
  month_to_date() |>
  filter(date >= as.Date("2017-01-01")) |>
  mutate(date = as.yearqtr(date)) |>
  group_by(Geo, date) |>
  filter(n() == 3) |>
  summarise(values = mean(values)) |>
  ungroup() |>
  group_by(Geo) |>
  arrange(date) |>
  mutate(values = 100*values/values[1]) |>
  add_flag_color("Geo") |>
  ggplot() + geom_line(aes(x = date, y = values, color = color)) +
  theme_minimal() + xlab("") + ylab("") +
  scale_y_log10(breaks = seq(0, 200, 2),
                labels = percent(seq(0, 200, 2)/100-1)) +
  zoo::scale_x_yearqtr(labels = date_format("%YT%q"),
                       breaks = expand.grid(2017:2100, c(1, 3)) |>
                         mutate(breaks = zoo::as.yearqtr(paste0(Var1, "Q", Var2))) |>
                         pull(breaks)) +
  scale_color_identity() + add_flags +
  theme(legend.position = "none",
        axis.text.x = element_text(angle = 45, vjust = 1, hjust = 1)) +
  geom_text_repel(data = . %>% filter(date == max(date)),
                  aes(x = date, y = values, color = color, label = percent(values/100-1, acc = 0.01)))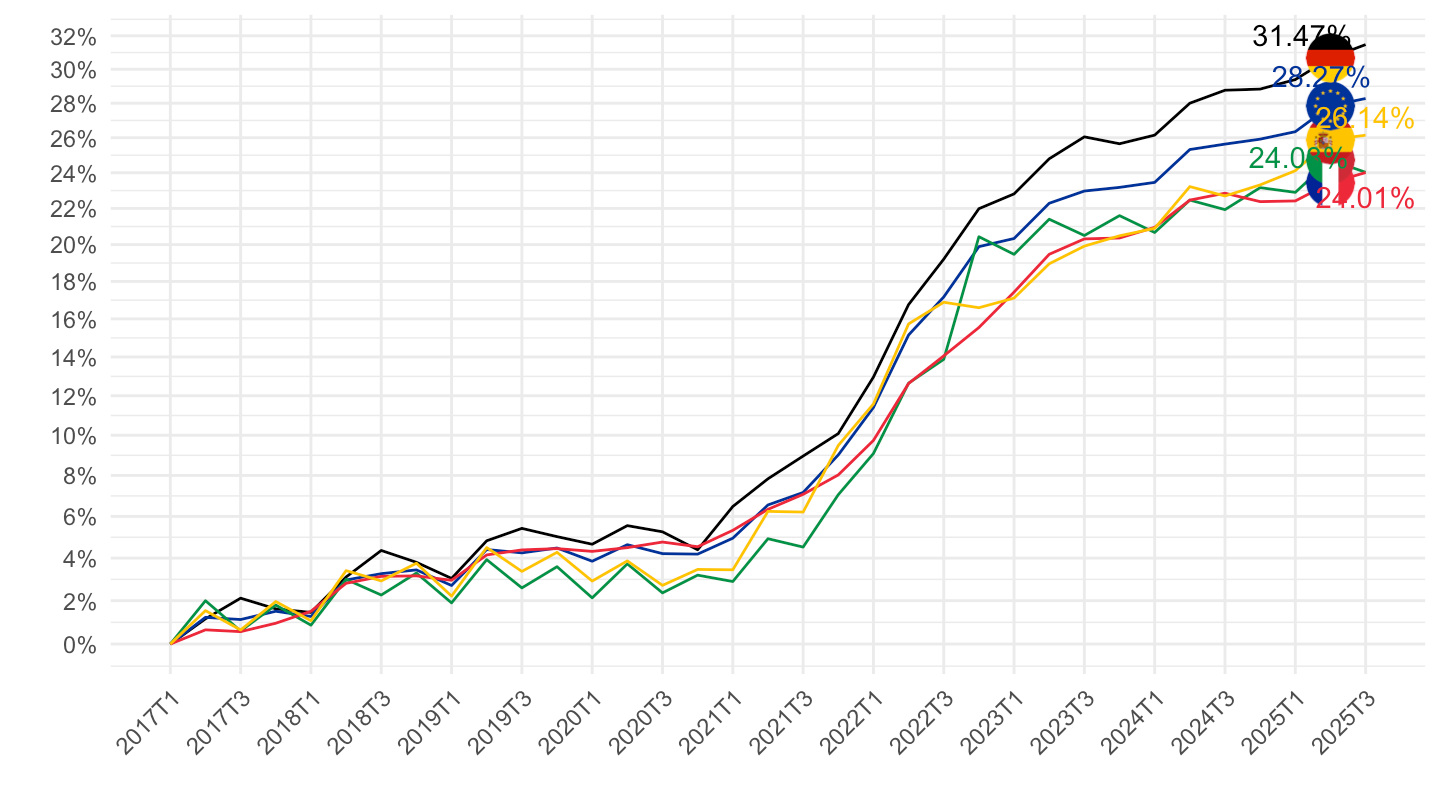
2017T2-2024T2
Monthly
Code
prc_hicp_midx |>
  filter(unit == "I15",
         coicop %in% c("CP00"),
         geo %in% c("DE", "FR", "IT", "NL", "ES")) |>
  left_join(geo, by = "geo") |>
  select(geo, Geo, coicop, time, values) |>
  month_to_date() |>
  filter(date >= as.Date("2017-04-01")) |>
  group_by(Geo) |>
  arrange(date) |>
  mutate(values = 100*values/values[1]) |>
  add_flag_color("Geo") |>
  ggplot() + geom_line(aes(x = date, y = values, color = color)) +
  theme_minimal() + xlab("") + ylab("Augmentation vs. Octobre 2021") +
  scale_x_date(breaks = "6 months",
               labels = date_format("%b %Y")) +
  scale_y_log10(breaks = seq(0, 200, 2),
                labels = percent(seq(0, 200, 2)/100-1)) +
  scale_color_identity() + add_flags +
  theme(legend.position = "none",
        axis.text.x = element_text(angle = 45, vjust = 1, hjust = 1))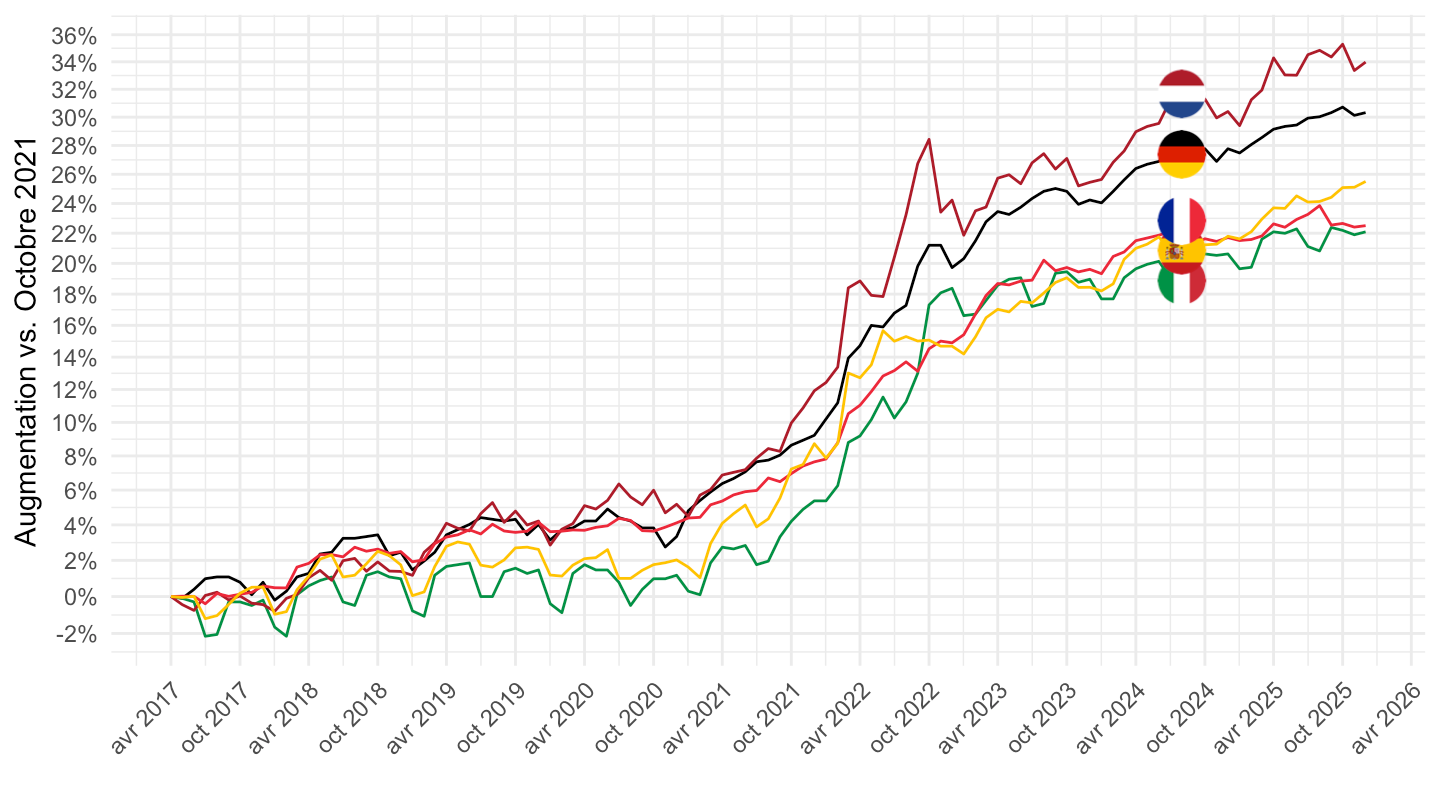
Quarterly
Code
prc_hicp_midx |>
  filter(unit == "I15",
         coicop %in% c("CP00"),
         geo %in% c("DE", "FR", "IT", "NL", "ES")) |>
  left_join(geo, by = "geo") |>
  select(Geo, time, values) |>
  month_to_date() |>
  mutate(date = as.yearqtr(date)) |>
  filter(date >= as.yearqtr("2017 Q2"),
         date <= as.yearqtr("2024 Q2")) |>
  group_by(Geo, date) |>
  filter(n() == 3) |>
  summarise(values = mean(values)) |>
  ungroup() |>
  group_by(Geo) |>
  arrange(date) |>
  mutate(values = 100*values/values[1]) |>
  add_flag_color("Geo") |>
  ggplot() + geom_line(aes(x = date, y = values, color = color)) +
  theme_minimal() + xlab("") + ylab("Augmentation vs. Octobre 2021") +
  scale_y_log10(breaks = seq(0, 200, 2),
                labels = percent(seq(0, 200, 2)/100-1)) +
  zoo::scale_x_yearqtr(labels = date_format("%YT%q"),
                       breaks = expand.grid(2017:2100, c(2, 4)) |>
                         mutate(breaks = zoo::as.yearqtr(paste0(Var1, "Q", Var2))) |>
                         pull(breaks)) +
  scale_color_identity() + add_flags +
  theme(legend.position = "none",
        axis.text.x = element_text(angle = 45, vjust = 1, hjust = 1)) +
  geom_text_repel(data = . %>% filter(date == max(date)),
                  aes(x = date, y = values, color = color, label = percent(values/100-1, acc = 0.01)))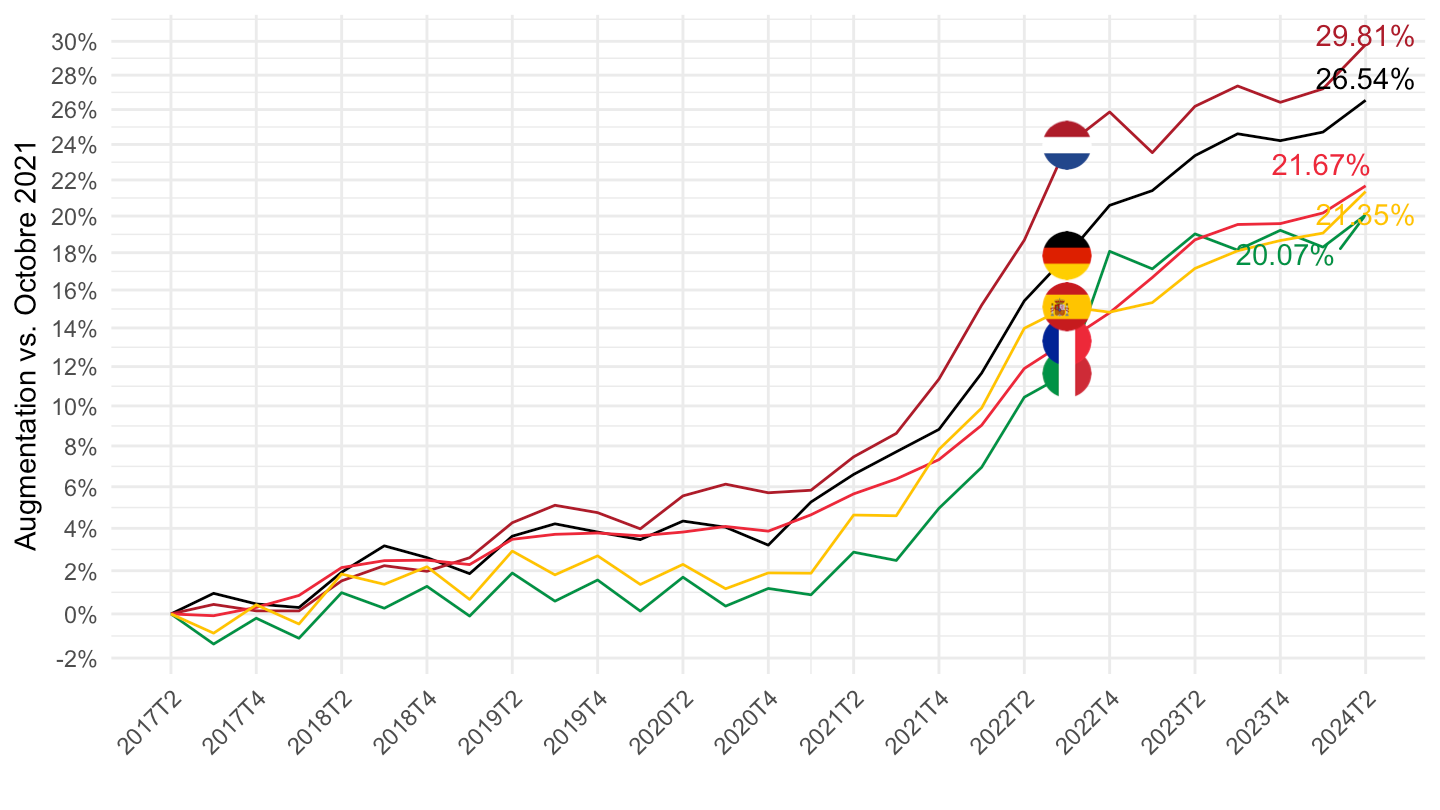
Related Data
Inflation in Europe since 2017
| source | dataset | Title | Updated |
|---|---|---|---|