Last observation: 2026-T2 (N = 2)
First observation: 2007-T1 (N = 2)
Last data update: 30 oct. 2026, 22:57
Last compile: 30 oct. 2026, 23:05
`les-licenciements` |>
  ggplot(aes(x = date, y = value, color = variable)) +
  geom_line() +
  theme_minimal() + xlab("") + ylab("licenciements (par trimestre)") +
  scale_x_date(date_breaks = "2 years", labels = date_format("%Y")) +
  scale_y_continuous(labels = label_number(big.mark = " ")) +
  theme(legend.position = "bottom", legend.title = element_blank(),
        axis.text.x = element_text(angle = 45, vjust = 1, hjust = 1))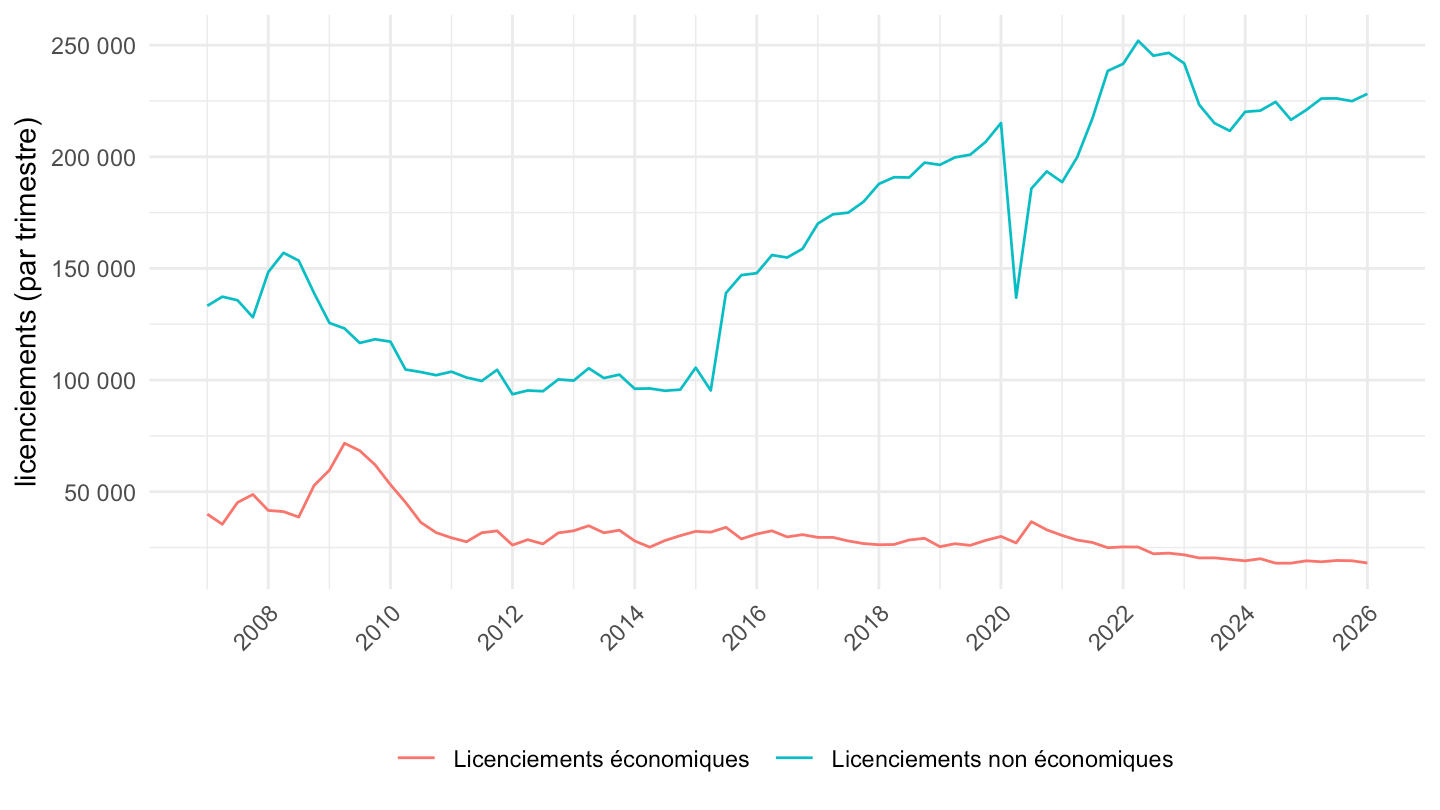
| source | dataset | Title | Updated |
|---|---|---|---|