BPM6 |>

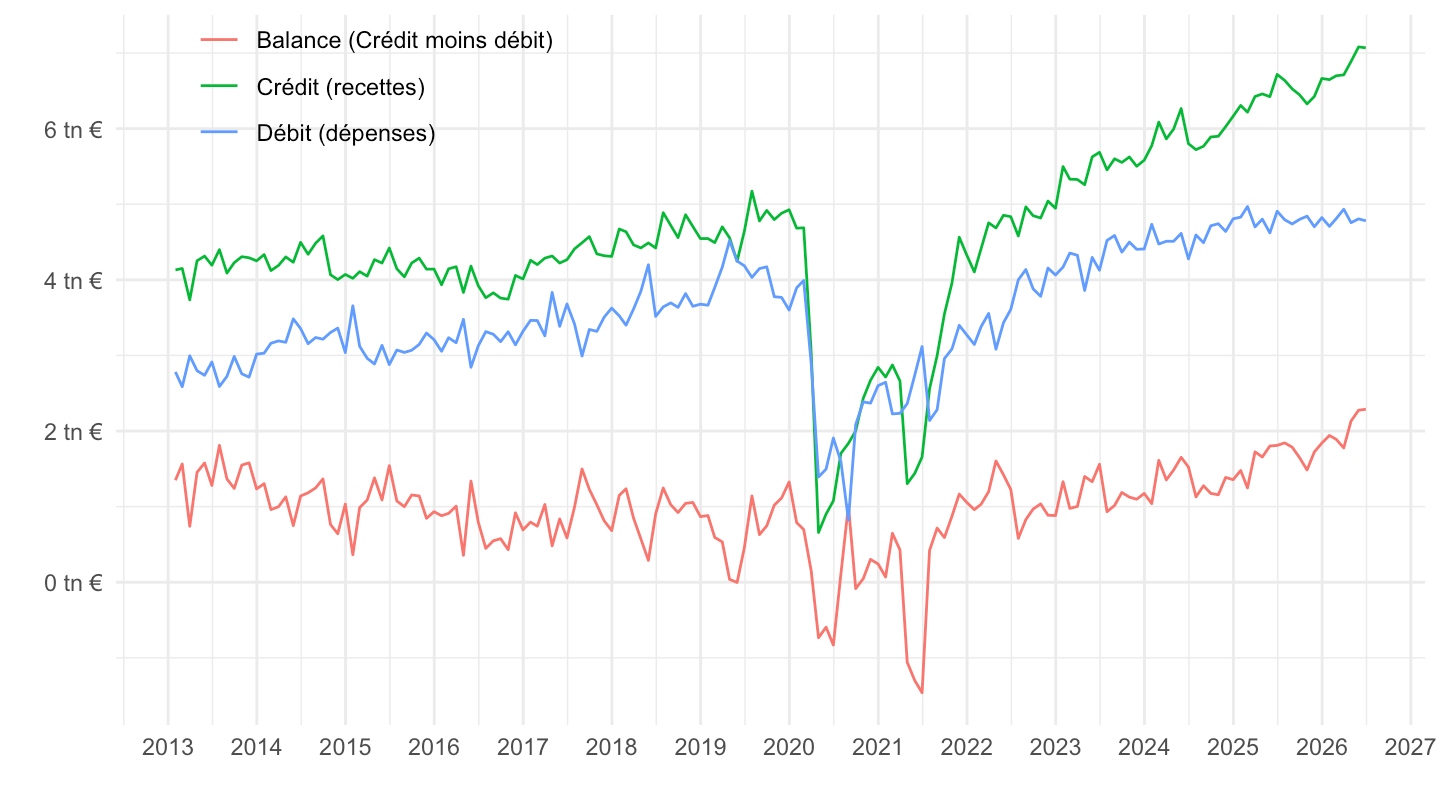
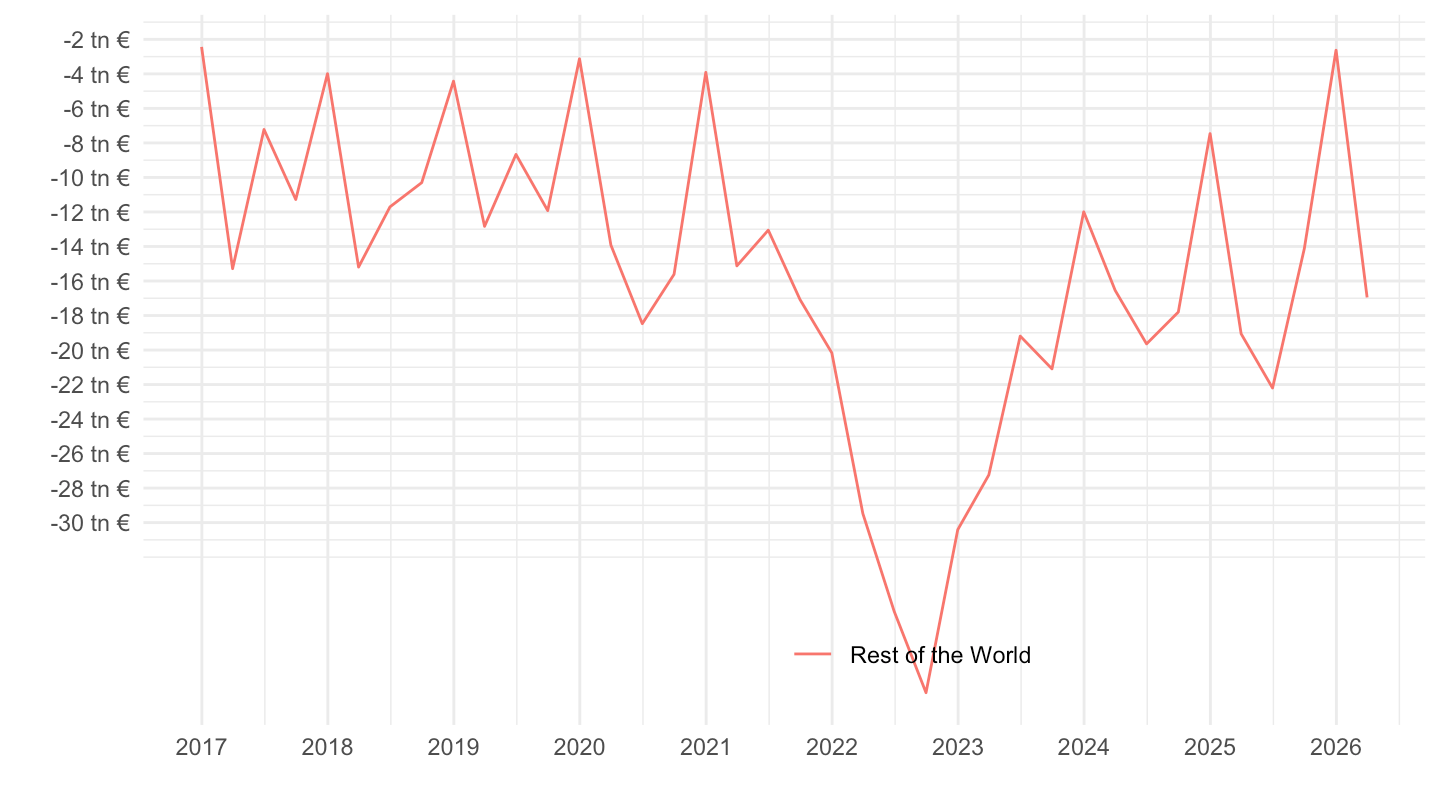
  filter(date >= as.Date("2018-01-01"),
         FREQ == "M",
         ADJUSTMENT == "S",
         COUNTERPART_AREA == "W1",
         REF_SECTOR == "S1",
         COUNTERPART_SECTOR == "S1",
         FLOW_STOCK_ENTRY == "T",
         ACCOUNTING_ENTRY == "B",
         INT_ACC_ITEM %in% c("G", "S")) |>

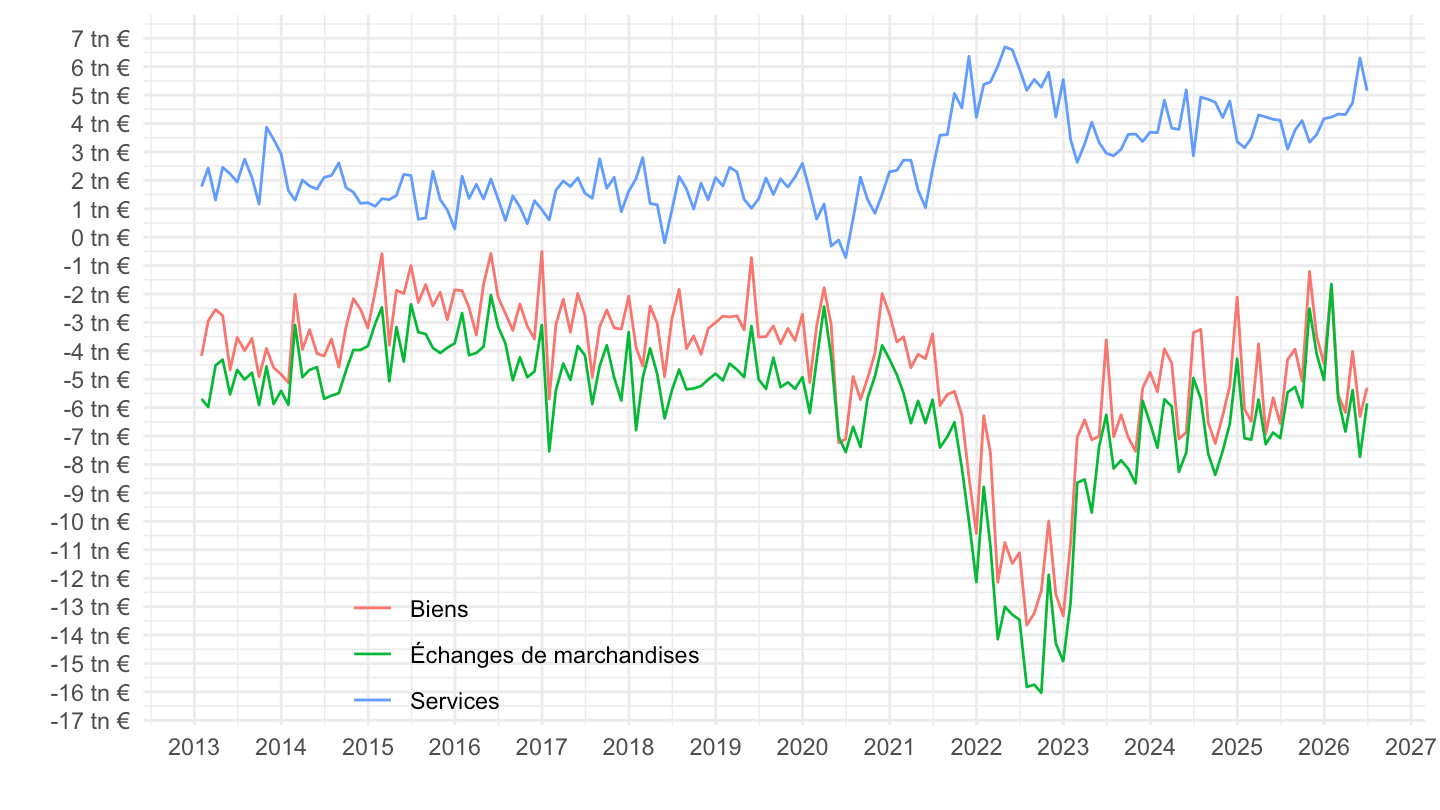
  ggplot() + geom_line(aes(x = date, y = value / 1000, color = Int_acc_item)) +

  theme_minimal() + xlab("") + ylab("") +
  scale_x_date(breaks = "3 months",
               labels = date_format("%b-%Y")) +
  theme(legend.position = c(0.3,0.1),
        legend.title = element_blank(),
        legend.direction = "vertical",
        axis.text.x = element_text(angle = 45, vjust = 1, hjust = 1)) +
  scale_y_continuous(breaks = seq(-100, 10, 1),
                labels = dollar_format(suffix = " tn €",  accuracy = 1, prefix = ""))
 Data - Banque de France