Quarterly compensation of employees by economic activity
Data - OECD
Info
Last observation: Quarterly: 2026-Q1 (N = 272) · Annual: 2025 (N = 286)
First observation: Quarterly: 1947-Q1 (N = 2) · Annual: NA (N = 1)
Last data update: 25 jul 2026, 23:59. Last compile: 26 jul 2026, 04:08
Structure
U.S., Europe, France, Germany
Population
1995-
Code
QNA_POP_EMPNC %>%
  filter(REF_AREA %in% c("USA", "EA", "FRA", "DEU"),
         FREQ == "Q",
         TRANSACTION == "POP",
         ADJUSTMENT == "Y",
         SECTOR == "S1") %>%
  quarter_to_date %>%
  arrange(desc(date)) %>%
  rename(LOCATION = REF_AREA) %>%

  filter(date >= as.Date("1995-01-01")) %>%
  mutate(Ref_area = ifelse(LOCATION == "EA", "Europe", Ref_area)) %>%
  group_by(Ref_area) %>%
  mutate(obsValue = 100 * obsValue / obsValue[date == as.Date("2007-04-01")]) %>%
  left_join(colors, by = c("Ref_area" = "country")) %>%
  mutate(color = ifelse(LOCATION != "DEU", color2, color)) %>%
  ggplot(.) + theme_minimal() + xlab("") + ylab("") +
  geom_line(aes(x = date, y = obsValue, color = color)) + add_4flags +
  scale_color_identity() +
  scale_x_date(breaks = c(seq(1995, 2100, 5)) %>% paste0("-01-01") %>% as.Date,
               labels = date_format("%Y")) +
  theme(legend.position = "none") +
  scale_y_log10(breaks = seq(50, 200, 5))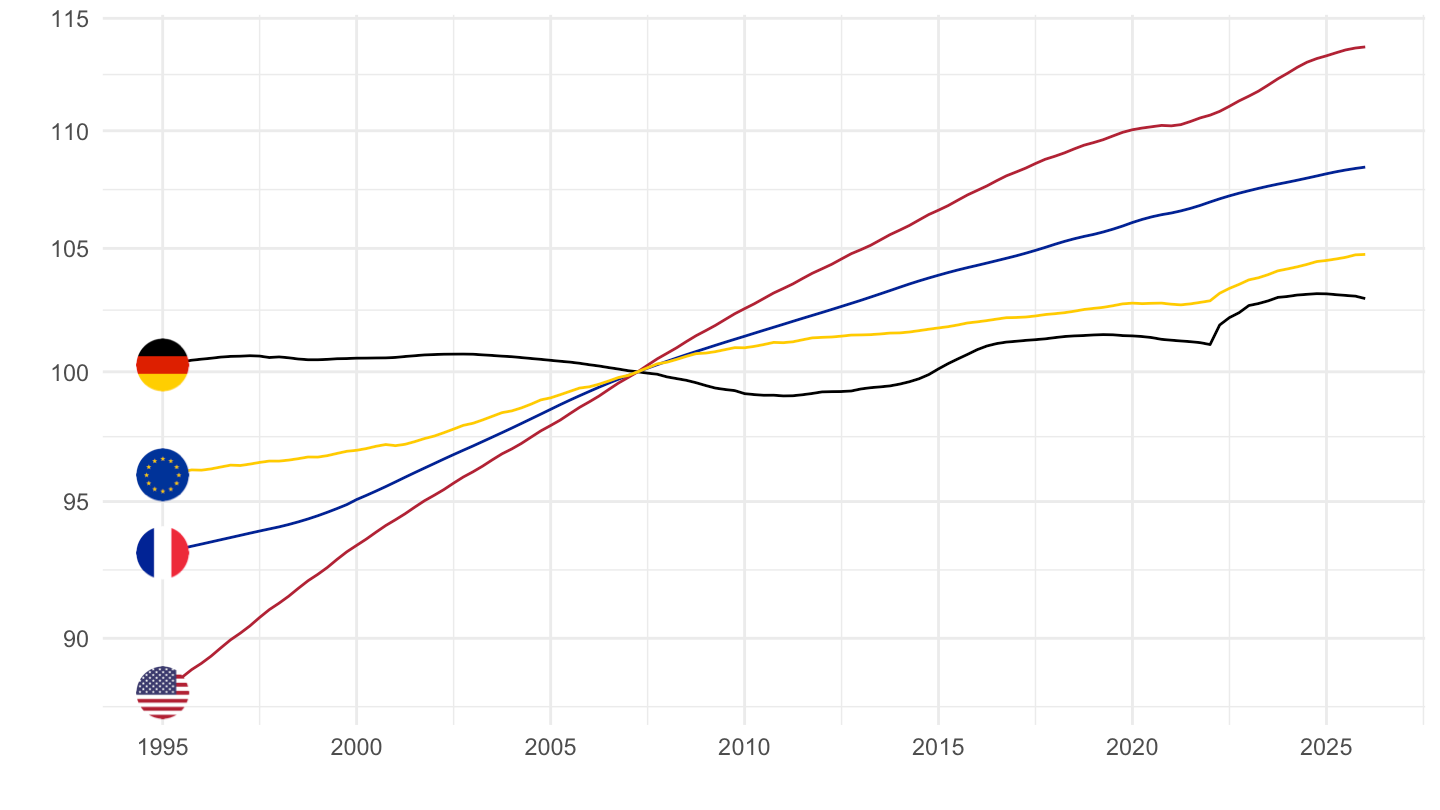
1999-
Tous
Code
QNA_POP_EMPNC %>%
  filter(REF_AREA %in% c("USA", "EA", "FRA", "DEU"),
         FREQ == "Q",
         TRANSACTION == "POP",
         ADJUSTMENT == "Y",
         SECTOR == "S1") %>%
  quarter_to_date %>%
  rename(LOCATION = REF_AREA) %>%

  filter(date >= as.Date("1999-01-01")) %>%
  mutate(Ref_area = ifelse(LOCATION == "EA", "Europe", Ref_area)) %>%
  group_by(Ref_area) %>%
  mutate(obsValue = 100 * obsValue / obsValue[date == as.Date("2007-04-01")]) %>%
  left_join(colors, by = c("Ref_area" = "country")) %>%
  mutate(color = ifelse(LOCATION != "DEU", color2, color)) %>%
  ggplot(.) + theme_minimal() + xlab("") + ylab("") +
  geom_line(aes(x = date, y = obsValue, color = color)) + add_4flags +
  scale_color_identity() +
  scale_x_date(breaks = c(seq(1999, 2100, 5), seq(1997, 2100, 5)) %>% paste0("-01-01") %>% as.Date,
               labels = date_format("%Y")) +
  theme(legend.position = "none") +
  scale_y_log10(breaks = seq(50, 200, 5))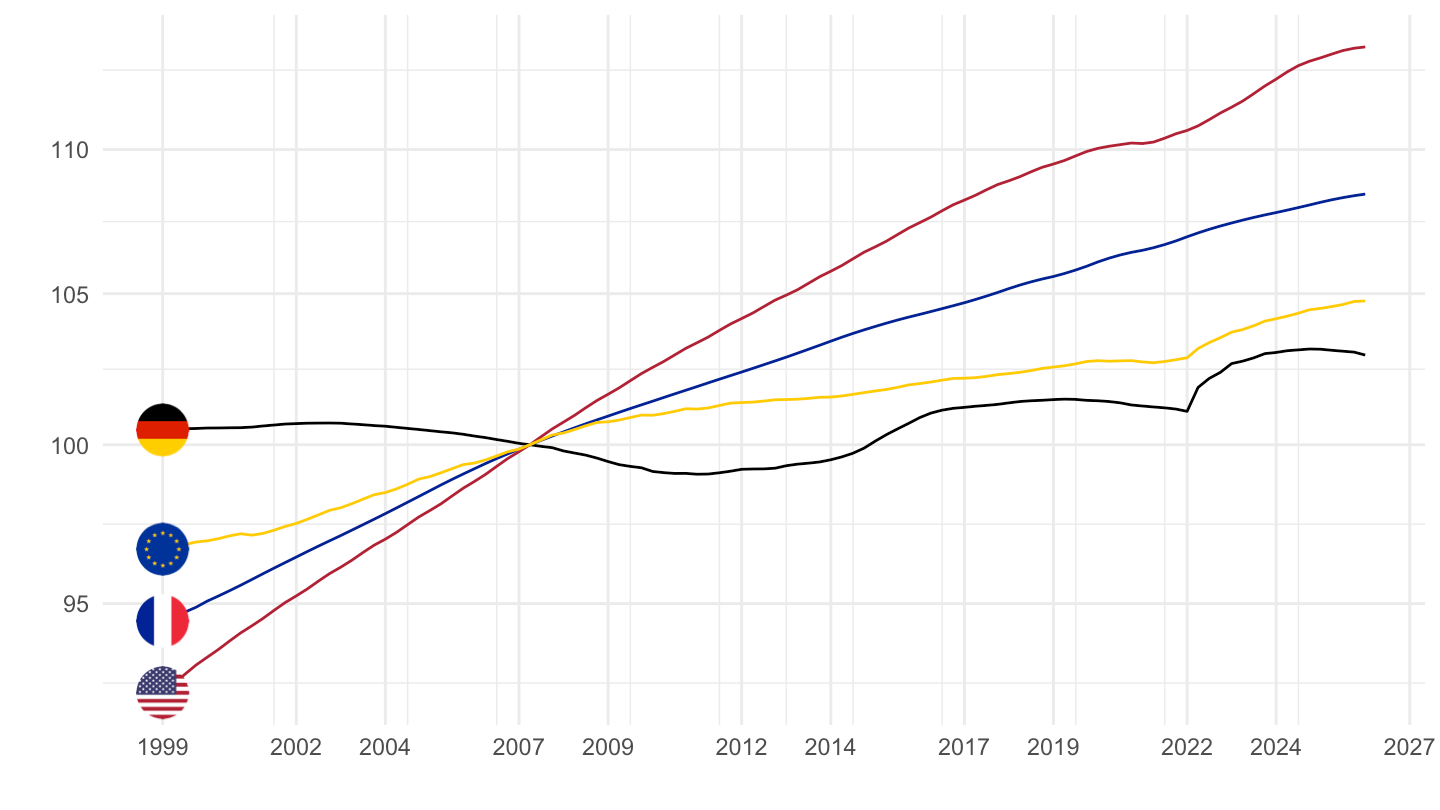
Base 100 = 1999
Code
QNA_POP_EMPNC %>%
  filter(REF_AREA %in% c("USA", "EA", "FRA", "DEU"),
         FREQ == "Q",
         TRANSACTION == "POP",
         ADJUSTMENT == "Y",
         SECTOR == "S1") %>%
  quarter_to_date %>%
  rename(LOCATION = REF_AREA) %>%

  filter(date >= as.Date("1999-01-01")) %>%
  mutate(Ref_area = ifelse(LOCATION == "EA", "Europe", Ref_area)) %>%
  group_by(Ref_area) %>%
  mutate(obsValue = 100 * obsValue / obsValue[date == as.Date("1999-01-01")]) %>%
  left_join(colors, by = c("Ref_area" = "country")) %>%
  mutate(color = ifelse(LOCATION != "DEU", color2, color)) %>%
  ggplot(.) + theme_minimal() + xlab("") + ylab("") +
  geom_line(aes(x = date, y = obsValue, color = color)) + add_4flags +
  scale_color_identity() +
  scale_x_date(breaks = c(seq(1999, 2100, 5), seq(1997, 2100, 5)) %>% paste0("-01-01") %>% as.Date,
               labels = date_format("%Y")) +
  theme(legend.position = "none") +
  scale_y_log10(breaks = seq(50, 200, 5)) +
  geom_label(data = . %>% filter(date == max(date)), aes(x = date, y = obsValue, label = round(obsValue, 1), color = color))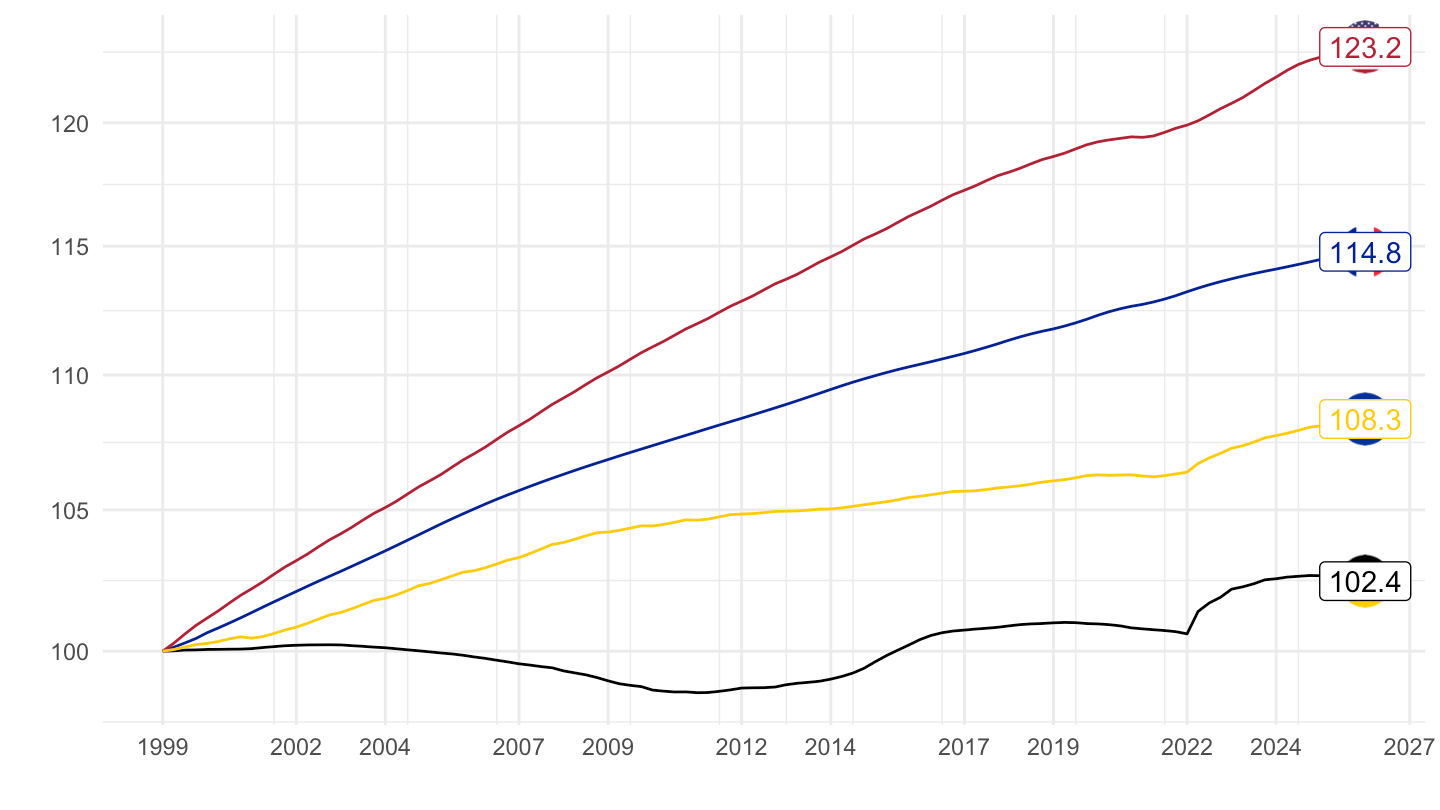
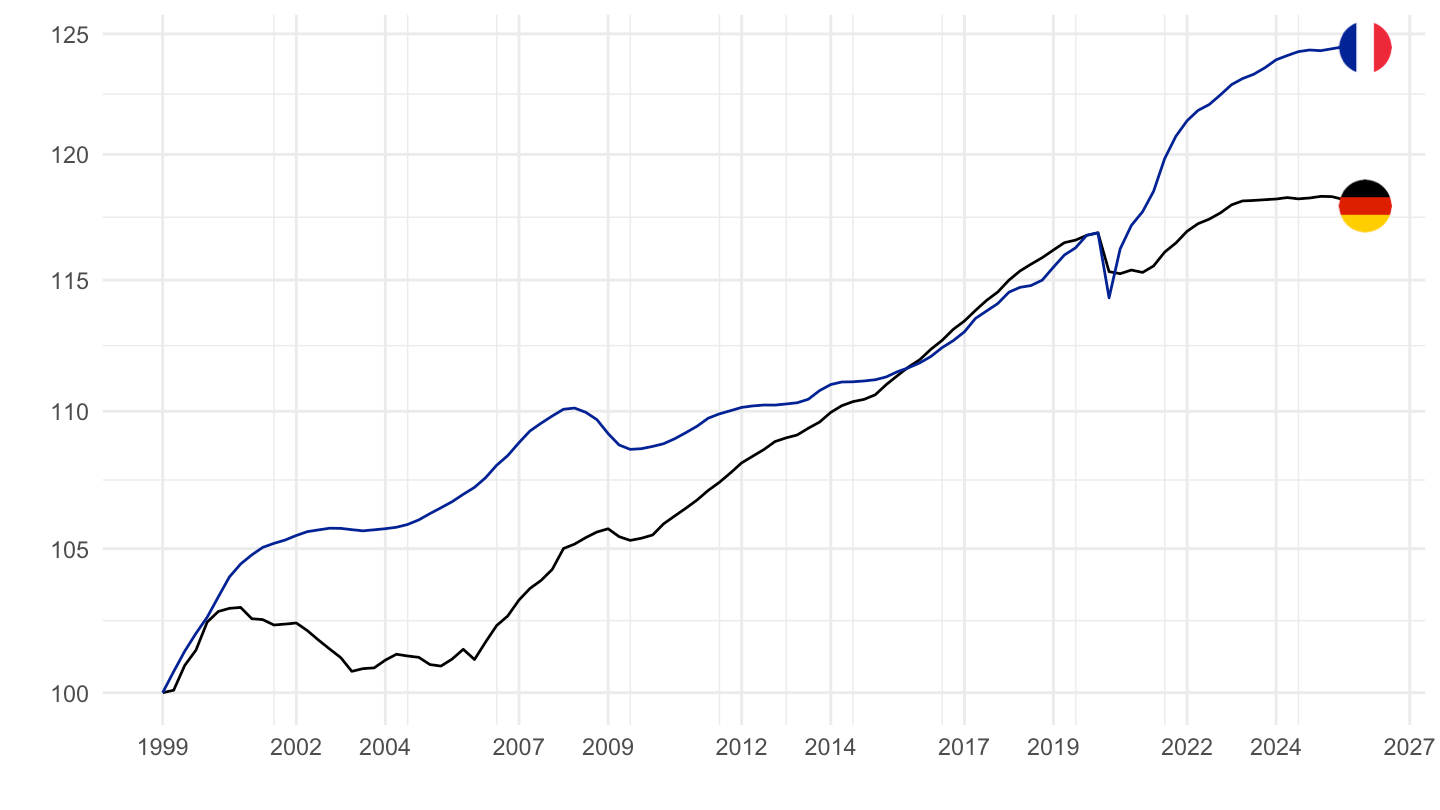
Employment
1995-
Code
QNA_POP_EMPNC %>%
  filter(REF_AREA %in% c("USA", "EA", "FRA", "DEU"),
         FREQ == "Q",
         TRANSACTION == "EMP",
         ADJUSTMENT == "Y",
         SECTOR == "S1") %>%
  quarter_to_date %>%
  arrange(desc(date)) %>%
  rename(LOCATION = REF_AREA) %>%

  filter(date >= as.Date("1995-01-01")) %>%
  mutate(Ref_area = ifelse(LOCATION == "EA", "Europe", Ref_area)) %>%
  group_by(Ref_area) %>%
  mutate(obsValue = 100 * obsValue / obsValue[date == as.Date("2007-04-01")]) %>%
  left_join(colors, by = c("Ref_area" = "country")) %>%
  mutate(color = ifelse(LOCATION != "DEU", color2, color)) %>%
  ggplot(.) + theme_minimal() + xlab("") + ylab("") +
  geom_line(aes(x = date, y = obsValue, color = color)) + add_4flags +
  scale_color_identity() +
  scale_x_date(breaks = c(seq(1995, 2100, 5)) %>% paste0("-01-01") %>% as.Date,
               labels = date_format("%Y")) +
  theme(legend.position = "none") +
  scale_y_log10(breaks = seq(50, 200, 5))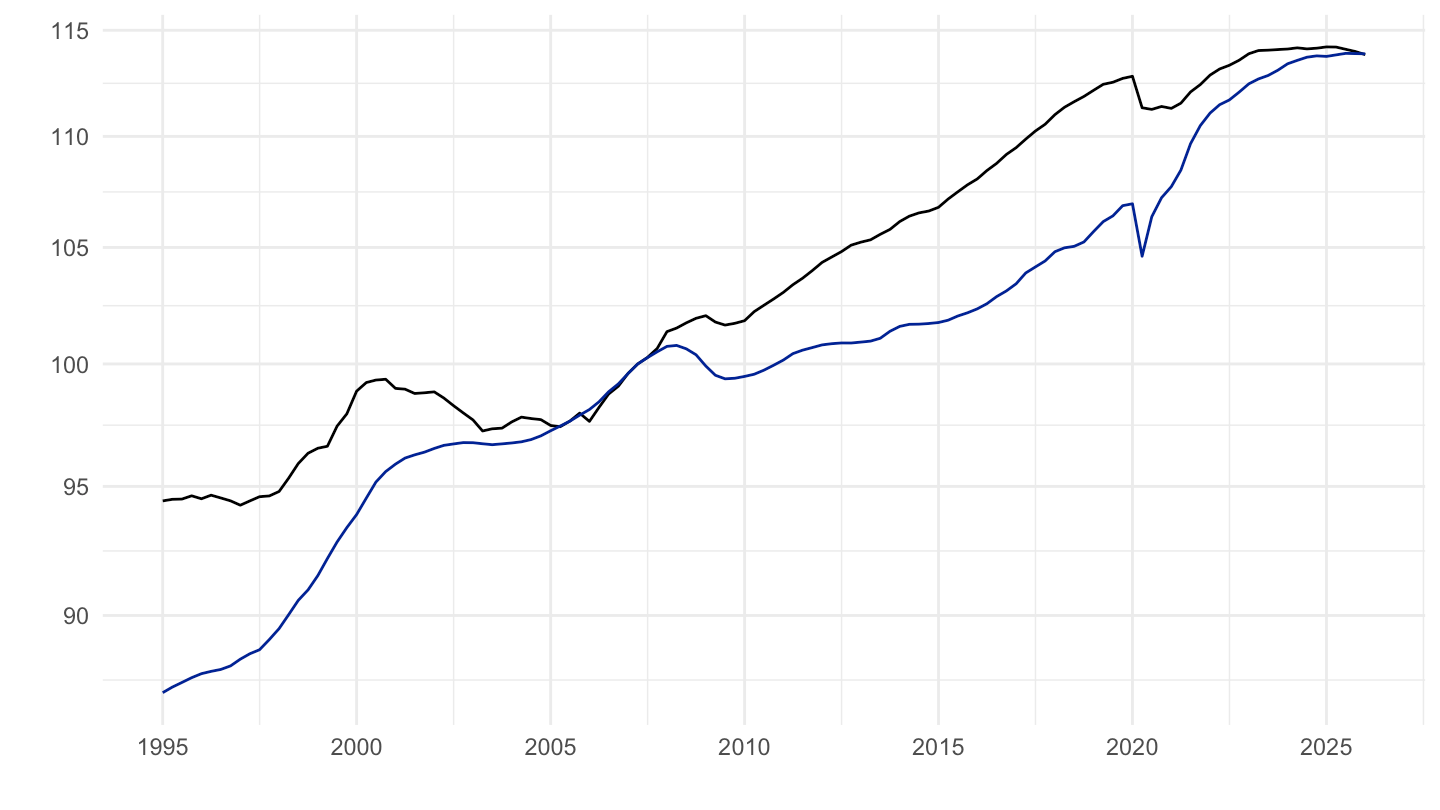
1999-
Tous
Code
QNA_POP_EMPNC %>%
  filter(REF_AREA %in% c("USA", "EA", "FRA", "DEU"),
         FREQ == "Q",
         TRANSACTION == "EMP",
         ADJUSTMENT == "Y",
         SECTOR == "S1") %>%
  quarter_to_date %>%
  rename(LOCATION = REF_AREA) %>%

  filter(date >= as.Date("1999-01-01")) %>%
  mutate(Ref_area = ifelse(LOCATION == "EA", "Europe", Ref_area)) %>%
  group_by(Ref_area) %>%
  mutate(obsValue = 100 * obsValue / obsValue[date == as.Date("2007-04-01")]) %>%
  left_join(colors, by = c("Ref_area" = "country")) %>%
  mutate(color = ifelse(LOCATION != "DEU", color2, color)) %>%
  ggplot(.) + theme_minimal() + xlab("") + ylab("") +
  geom_line(aes(x = date, y = obsValue, color = color)) + add_4flags +
  scale_color_identity() +
  scale_x_date(breaks = c(seq(1999, 2100, 5), seq(1997, 2100, 5)) %>% paste0("-01-01") %>% as.Date,
               labels = date_format("%Y")) +
  theme(legend.position = "none") +
  scale_y_log10(breaks = seq(50, 200, 5))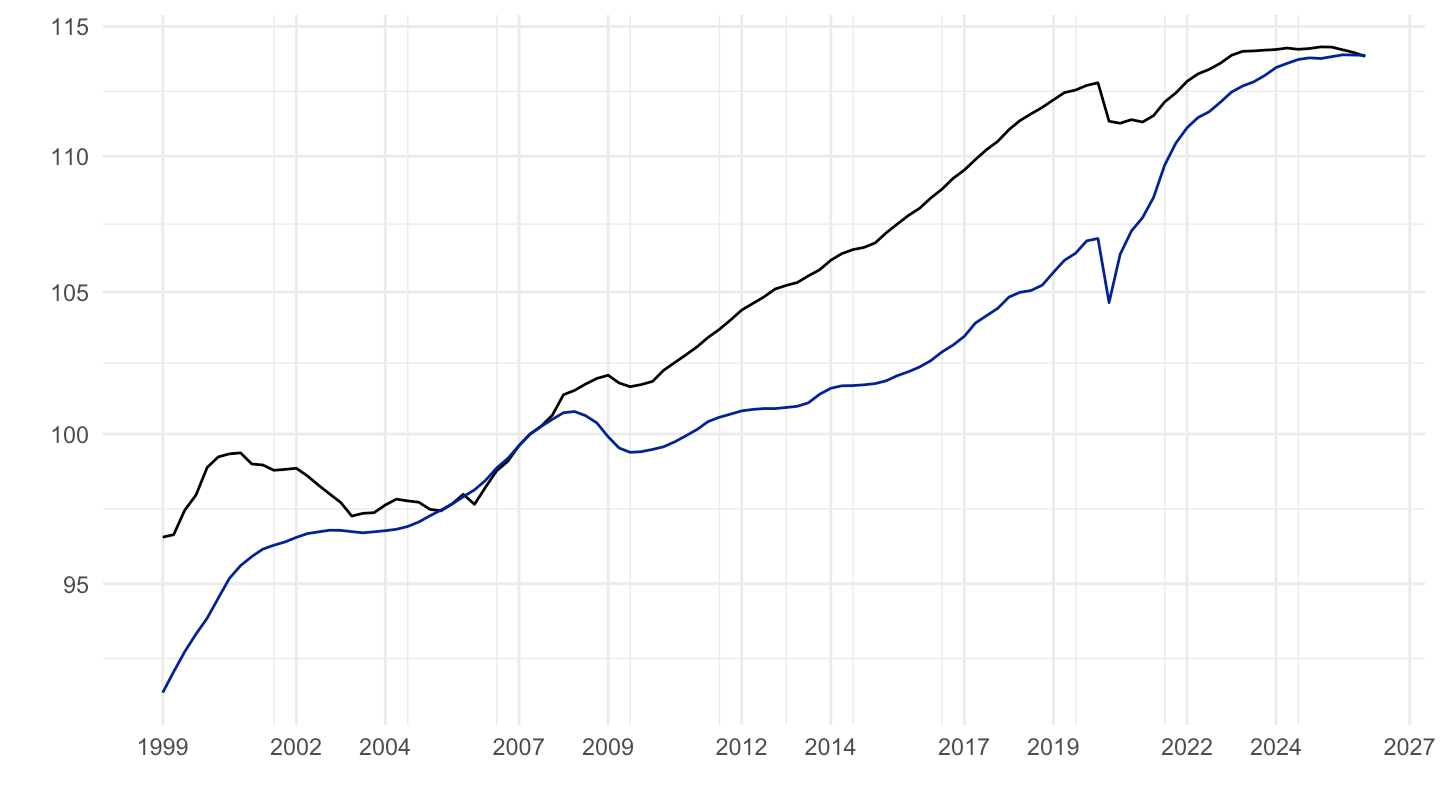
Base 100 = 1999
Code
QNA_POP_EMPNC %>%
  filter(REF_AREA %in% c("USA", "EA", "FRA", "DEU"),
         FREQ == "Q",
         TRANSACTION == "EMP",
         ADJUSTMENT == "Y",
         SECTOR == "S1") %>%
  quarter_to_date %>%
  rename(LOCATION = REF_AREA) %>%

  filter(date >= as.Date("1999-01-01")) %>%
  mutate(Ref_area = ifelse(LOCATION == "EA", "Europe", Ref_area)) %>%
  group_by(Ref_area) %>%
  mutate(obsValue = 100 * obsValue / obsValue[date == as.Date("1999-01-01")]) %>%
  left_join(colors, by = c("Ref_area" = "country")) %>%
  mutate(color = ifelse(LOCATION != "DEU", color2, color)) %>%
  ggplot(.) + theme_minimal() + xlab("") + ylab("") +
  geom_line(aes(x = date, y = obsValue, color = color)) + add_2flags +
  scale_color_identity() +
  scale_x_date(breaks = c(seq(1999, 2100, 5), seq(1997, 2100, 5)) %>% paste0("-01-01") %>% as.Date,
               labels = date_format("%Y")) +
  theme(legend.position = "none") +
  scale_y_log10(breaks = seq(50, 200, 5))